
hii , use this image , answer accordingly with every question from Q1 to Q15 in a brief detailed manner without removing any point , let imp words be in bold-caps , use images , graphs wherever required and use guytons physiology , take time but just let it be complete answer not to miss anything , answer every whys and where wherever req but give detailed long answer in brief
| Q | Topic | Key Points Covered |
|---|---|---|
| Q1 | Physiology of Cardiac Muscle | Types, syncytium, AP phases (0-4), plateau, excitation-contraction coupling, torsion |
| Q2 | Cardiac Cycle | Wiggers diagram, systole/diastole phases, a-c-v waves, heart sounds S1-S4, EDV/ESV/SV |
| Q3 | Regulation of Heart Pumping | Frank-Starling mechanism, Bainbridge reflex, SNS/PNS control, cardiac output formula |
| Q4 | Specialized Conductive System | SA node, internodal pathways, AV node delay, Bundle of His, Purkinje fibers, pacemaker hierarchy |
| Q5 | Control of Excitation & Conduction | Vagal/sympathetic mechanisms, ion effects (K+, Ca2+), pathway dominance |
| Q6 | Normal ECG Characteristics | P-QRS-T waves, intervals, depolarization vs repolarization, WHY T is positive |
| Q7 | ECG Leads | Bipolar limb (I, II, III), augmented (aVR/aVL/aVF), precordial V1-V6, R-wave progression |
| Q8 | Vectorial Analysis | Depolarization sequence, projection method, QRS vector generation step-by-step |
| Q9 | Mean Electrical Axis | How to calculate, normal range (-30 to +90°), LAD vs RAD causes |
| Q10 | Abnormal QRS Patterns | High/low voltage causes, RBBB/LBBB, bizarre patterns from infarct/conduction blocks |
| Q11 | Current of Injury & J Point | Definition, mechanism, ST elevation/depression, infarct localization, progressive MI changes |
| Q12 | T Wave Abnormalities | Inversion, peaked, flat, LQTS (congenital/acquired), torsades de pointes |
| Q13 | Blood Volume & Pressure | % distribution (84% systemic, 64% in veins), velocity vs cross-section, pressure table |
| Q14 | Basic Circulatory Theory | Q=ΔP/R, Ohm's law analogy, series vs parallel resistance, pressure-flow-resistance triangle |
| Q15 | Poiseuille's Law & Viscosity | Full equation, r⁴ dominance, hematocrit-viscosity table, Fahraeus-Lindqvist effect, clinical conditions |

same for this
| Q | Topic | Key Points |
|---|---|---|
| Q16 | Laminar/Turbulent Flow + Reynolds' Number | Parabolic profile, Re = vdρ/η, critical values 200/2000, causes of turbulence |
| Q17 | Vascular Distensibility and Compliance | Compliance = Distensibility × Volume; veins 24× more compliant; Windkessel effect; stress-relaxation |
| Q18 | Arterial Pressure Pulsations | Systolic/diastolic/pulse pressure, Korotkoff sounds, pulse wave, factors altering pulse pressure |
| Q19 | Veins and Their Functions | Conduit, reservoir (64% blood), venous pump (muscle/respiratory/cardiac), valves, CVP |
| Q20 | Capillary Flow/Vasomotion/Interstitium | Precapillary sphincters, vasomotion mechanism, capillary wall structure, interstitial pressures |
| Q21 | Plasma Colloid Osmotic Pressure/Starling Forces | 28 mmHg oncotic, four Starling forces, filtration/reabsorption analysis, edema causes |
| Q22 | Lymphatic System | Anchoring filaments, intrinsic + extrinsic pump, thoracic duct, safety factor against edema |
| Q23 | Local Blood Flow Control/Hormonal Regulation | Metabolic theory, myogenic theory, vasoconstrictors (NE, AngII, ADH), vasodilators (NO, bradykinin) |
| Q24 | Nervous Regulation/Vasomotor Center | Three areas of medullary center, vasomotor tone, higher center control, NE as transmitter |
| Q25 | Rapid Nervous BP Control | Baroreflex (carotid/aortic), atrial reflexes (Bainbridge, Gauer-Henry, ANP), CNS ischemic response, Cushing reflex |
| Q26 | Role of Kidney in BP | Pressure natriuresis, infinite gain concept, renal function curve, Goldblatt hypertension |
| Q27 | Renin-Angiotensin System | Full RAAS pathway, AngII dual actions (acute vasoconstriction + chronic fluid retention), clinical drugs |
| Q28 | Cardiac Output Control | CO = HR×SV, CO curve, venous return curve, equilibrium point, sympathetic shifting |
| Q29 | Venous Return/Mean Systemic Filling Pressure | Psf = 7 mmHg, VR = (Psf - RAP)/Resistance, venous collapse plateau, factors regulating VR |
| Q30 | Fick's Method | VO₂/(CaO₂ - CvO₂), mixed venous from PA, thermodilution, indicator dilution |
| Q31 | Skeletal Muscle Blood Flow | 3-4 → 100-200 mL/min/100g, compression paradox, metabolic > sympathetic control, exercise cardiovascular response |
| Q32 | Coronary Circulation | LCA/RCA anatomy, diastolic-dominant LCA flow, adenosine regulation, MI zones/stages, angina mechanism |
| Q33 | Heart Sounds | S1 (AV closure), S2 (semilunar closure), S3 (rapid filling/heart failure), S4 (stiff ventricle), murmur grading |
give one-page image of high-yeild notes of Aortic stenosis include every info using diff colours , and the normal vs aortic stenoic pressure vs volume graph
One-page high-yield medical notes poster for Aortic Stenosis. Dark background (#0d1117). Organized into clearly labeled colored sections with icons and diagrams. Include: TOP HEADER: "AORTIC STENOSIS" in large bold white text with a red heart icon. Subtitle: "High-Yield Notes" in yellow. LEFT COLUMN (blue theme): Section: DEFINITION & ETIOLOGY (blue header) - Narrowing of aortic valve orifice (normal: 3-4 cm², critical: <1 cm²) - Causes listed with bullet points: Calcific/Degenerative (most common, elderly), Bicuspid Aortic Valve (young adults, congenital), Rheumatic fever - Small anatomical diagram showing normal valve vs stenotic valve side by side with labels Section: PATHOPHYSIOLOGY (orange header, flowchart style) Arrow diagram: Obstruction to LV outflow → LV pressure overload → Concentric LV Hypertrophy → Diastolic dysfunction → Eventually systolic dysfunction → Heart Failure Section: CLASSIC TRIAD (bright green box, large text) Title: "SAD TRIAD" - S = SYNCOPE (exertional) - survival 3 years - A = ANGINA (exertional) - survival 5 years - D = DYSPNEA (heart failure) - survival 1-2 years MIDDLE COLUMN: Section: PRESSURE-VOLUME LOOP DIAGRAM (white/yellow) Large hand-drawn style PV loop showing: - Normal PV loop in blue (smaller, normal shape, labeled: Normal, EDP ~12mmHg, ESV ~50mL, EDV ~120mL) - Aortic Stenosis PV loop in red (taller/higher, shifted, labeled: AS loop, peak LV systolic pressure >200mmHg, narrow pulse pressure, reduced stroke volume, increased LVEDP) - X-axis labeled "Volume (mL)" with values 40, 80, 120 - Y-axis labeled "Pressure (mmHg)" with values 0, 80, 120, 200 - Arrows indicating: LV systolic pressure >> Aortic pressure (gradient), Increased afterload, Concentric hypertrophy shifts loop leftward - Legend box showing blue=Normal, red=Aortic Stenosis Section: CLINICAL FEATURES (purple header) Symptoms: Angina, Syncope, Dyspnea, Fatigue Signs listed: - Pulse: Pulsus Parvus et Tardus (weak + slow rising) - BP: Narrow pulse pressure - Apex: Sustained heaving undisplaced - Thrill: Systolic thrill at base/neck - Auscultation box with heart diagram: Harsh crescendo-decrescendo SYSTOLIC EJECTION MURMUR, best at right 2nd ICS, radiates to carotids, EJECTION CLICK (bicuspid), Soft/absent A2, S4 gallop RIGHT COLUMN: Section: INVESTIGATIONS (teal header) ECG: LVH (tall R in V5-V6, deep S in V1-V2), ST depression/T inversion (strain), LAD Echo: Gold standard, valve area, gradient (severe: mean gradient >40mmHg), EF CXR: Boot-shaped heart, calcified valve, pulmonary congestion, post-stenotic aortic dilation Cardiac Cath: Definitive - LV-Aortic pressure gradient Section: SEVERITY GRADING TABLE (colored table) | Grade | Valve Area | Mean Gradient | | Mild | >1.5 cm² | <25 mmHg | | Moderate | 1.0-1.5 cm² | 25-40 mmHg | | Severe | <1.0 cm² | >40 mmHg | | Critical | <0.6 cm² | very high | Section: MANAGEMENT (red/green header) Medical (temporizing only): - Diuretics for congestion (cautiously) - AVOID: Vasodilators (reduce preload → syncope), Beta-blockers in severe AS, Vigorous exercise Surgical/Interventional: - SAVR (Surgical Aortic Valve Replacement) - gold standard for surgical candidates - TAVR/TAVI (Transcatheter) - for high surgical risk patients - Balloon Valvuloplasty - palliative/bridge in children/pregnancy BOTTOM BAR: "KEY MURMUR" in yellow box: Harsh ejection systolic murmur, 2nd right ICS, radiates to carotids, peaks in mid-systole, DECREASES on Valsalva (vs HCM which increases), paradoxical splitting of S2 All text sharp and legible, medical poster style, dense but organized, color-coded sections, professional clinical notes format
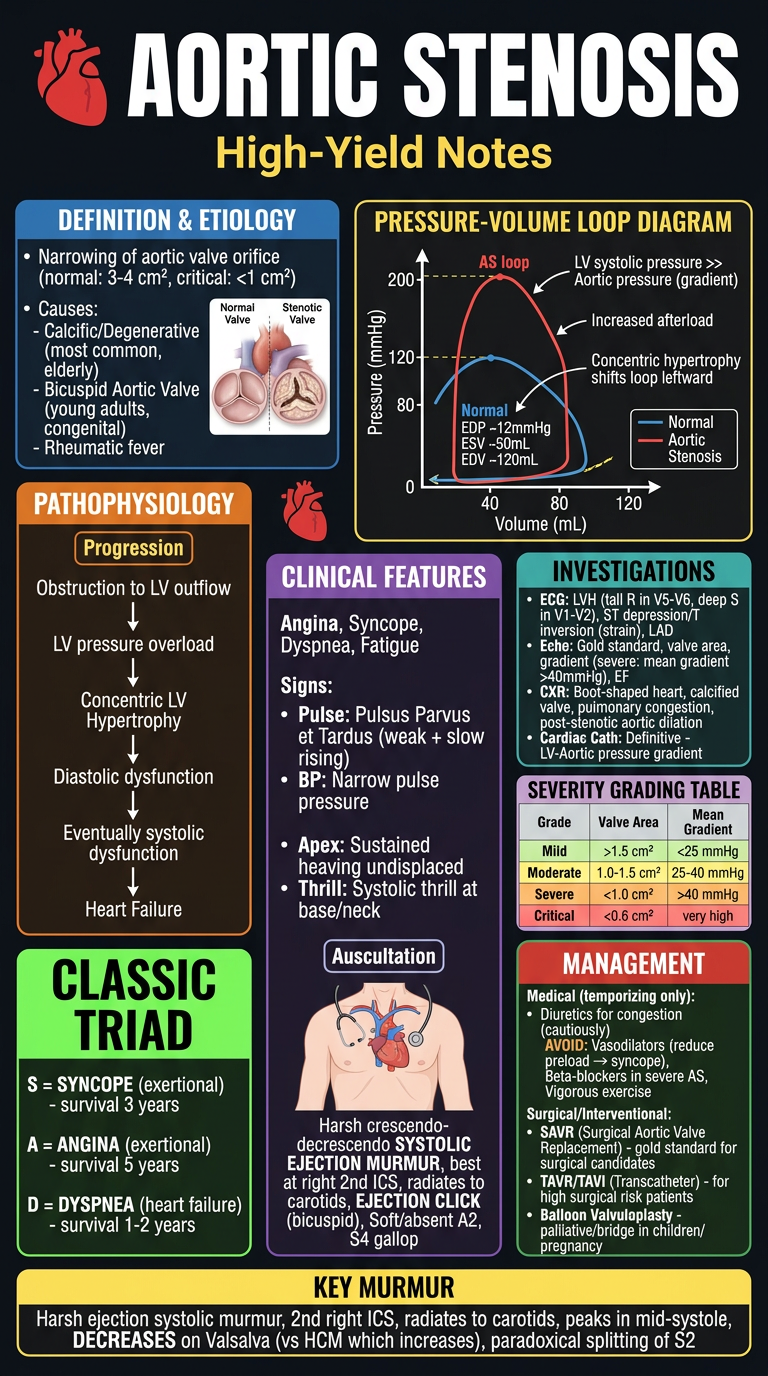
- Normal (3-4 cm²) vs Critical (<1 cm²) valve area
- Causes: Calcific, Bicuspid AV, Rheumatic
- Flowchart: obstruction → LV pressure overload → concentric hypertrophy → failure
- Syncope (3yr survival), Angina (5yr), Dyspnea (1-2yr)
- Blue = Normal loop
- Red = AS loop (taller, higher LV pressure >200 mmHg, narrow pulse pressure, reduced stroke volume, leftward shift from concentric hypertrophy)
- Pulsus parvus et tardus, narrow pulse pressure
- Harsh crescendo-decrescendo systolic ejection murmur at right 2nd ICS → radiates to carotids
- Severity table (Mild >1.5 cm² / Moderate 1.0-1.5 / Severe <1.0 / Critical <0.6)
- AVOID vasodilators/vigorous exercise
- SAVR (gold standard) / TAVR (high-risk) / Balloon valvuloplasty (bridge)
- KEY: murmur DECREASES on Valsalva (differentiates from HCM)
now seperate sepearte for Aortic regurtitation , PAD & arteriosclerosis
One-page high-yield medical notes poster for AORTIC REGURGITATION (Aortic Insufficiency). Dark navy background. Colorful, dense, organized clinical notes poster style. All text sharp and legible. TOP HEADER: "AORTIC REGURGITATION" in large bold white text, red heart icon. Subtitle: "High-Yield Notes" in yellow. Small label: "Volume Overload of LV" LEFT COLUMN (blue theme): DEFINITION & ETIOLOGY (blue header box): - Backflow of blood from aorta into LV during diastole - Acute causes (red): Infective Endocarditis, Aortic dissection, Trauma - Chronic causes (green): Bicuspid AV, Rheumatic fever, Marfan syndrome, Syphilitic aortitis, Ankylosing spondylitis, Hypertension PATHOPHYSIOLOGY (orange flowchart): Incompetent AV → Blood regurgitates to LV → LV volume overload → LV dilates (eccentric hypertrophy) → ↑EDV & ↑SV (Frank-Starling) → Wide pulse pressure → Eventually LV decompensates → Heart Failure Note: ACUTE AR = no time to compensate → sudden pulmonary edema CLASSIC SIGNS BOX (bright colors): WIDE PULSE PRESSURE (systolic high, diastolic low) "WATER HAMMER / CORRIGAN'S PULSE" - bounding collapsing pulse MIDDLE COLUMN: PRESSURE-VOLUME LOOP DIAGRAM: Large clear diagram with: - Blue loop = Normal (EDV 120mL, ESV 50mL, SV 70mL, peak pressure 120mmHg) - Red loop = Chronic AR (wide loop, EDV increased to 220-250mL, ESV increased, SV doubled ~150mL, normal/low diastolic pressure, wide pulse pressure, loop shifted rightward and downward) - Green loop = Acute AR (small loop, high LVEDP, low output - no compensation time) - X-axis: "Volume (mL)" 0 to 300 - Y-axis: "Pressure (mmHg)" 0 to 200 - Labels: Increased EDV, Increased SV, Low diastolic pressure, Wide pulse pressure - Legend with colored boxes EPONYMOUS SIGNS TABLE (yellow header, organized): Sign | Description Corrigan's pulse | Bounding water-hammer pulse de Musset's sign | Head bobbing with heartbeat Quincke's sign | Capillary pulsations in nailbed Duroziez's sign | To-fro murmur over femoral artery Traube's sign | Pistol-shot sound over femoral Müller's sign | Uvula pulsations Hill's sign | Popliteal > brachial SBP by >20mmHg RIGHT COLUMN: AUSCULTATION BOX (purple): - High-pitched early diastolic decrescendo murmur - Best heard: Left sternal border, 3rd-4th ICS, patient leaning forward, held expiration - Austin Flint murmur: Low-pitched mid-diastolic rumble at apex (regurgitant jet hits anterior MV leaflet mimicking MS) - S3 gallop (volume overload) - Loud S1, Displaced apex (LV dilation) - Ejection systolic murmur (increased flow across AV) INVESTIGATIONS (teal): ECG: LVH (tall R V5-V6), volume overload pattern, LAD Echo: Gold standard - regurgitant jet, LV dimensions, EF, severity grading CXR: Cardiomegaly (boot-shaped), dilated aorta, pulmonary congestion (acute) Cardiac Cath: Aortography, LV-Aortic gradient absent SEVERITY GRADING TABLE: Mild / Moderate / Severe based on regurgitant fraction, vena contracta, EROA MANAGEMENT (red/green): ACUTE AR (EMERGENCY): - IV vasodilators (Nitroprusside) - reduce afterload - Urgent surgical valve replacement - AVOID: IABP (worsens regurgitation), Beta-blockers (slow HR increases regurgitation time) CHRONIC AR: - Vasodilators: ACE inhibitors, Nifedipine (if HTN or symptoms) - Surgery indication: Symptoms OR EF<50% OR severe LV dilation (LVEDD>65mm, LVESD>50mm) - Valve replacement: tissue or mechanical - Asymptomatic with normal EF: watch and wait BOTTOM KEY FACTS BAR (yellow): - Murmur INCREASES on squatting and handgrip (increases afterload → more regurgitation audible) - Chronic AR: longest asymptomatic period of all valve diseases - Hill's sign: Popliteal SBP exceeds brachial by >20mmHg = severe AR Clean, color-coded, medical poster, all text legible, professional style
One-page high-yield medical notes poster for PERIPHERAL ARTERIAL DISEASE (PAD). Dark background (#0d1117). Colorful, dense, organized, professional clinical notes medical poster. All text sharp and legible. TOP HEADER: "PERIPHERAL ARTERIAL DISEASE (PAD)" in large bold white text with a leg/artery icon. Subtitle: "High-Yield Notes" in yellow. Small note: "Atherosclerotic occlusion of non-coronary arteries" LEFT COLUMN (blue theme): DEFINITION & EPIDEMIOLOGY (blue header): - Narrowing/occlusion of peripheral arteries (usually lower limbs) due to atherosclerosis - Prevalence: 12-20% in adults >65 years - Strong association with coronary and cerebrovascular disease RISK FACTORS (orange box): Major: Smoking (#1 risk factor - 4x risk), Diabetes Mellitus, Hypertension, Dyslipidemia, Age >50, Male sex Others: Hyperhomocysteinemia, CKD, Hypercoagulable states, Family history PATHOPHYSIOLOGY (flowchart, orange arrows): Atherosclerosis → Plaque formation in arterial wall → Progressive stenosis → ↓ Blood flow to limb → Ischemia during exercise → REST PAIN in severe cases → Tissue necrosis (gangrene) Most common sites: Aortoiliac (Leriche syndrome), Femoral-popliteal (most common), Tibial-peroneal MIDDLE COLUMN: CLINICAL FEATURES - FONTAINE CLASSIFICATION TABLE (colored table, green/yellow/orange/red): Stage | Symptoms | Description I | Asymptomatic | ABI abnormal, no symptoms IIa | Mild claudication | Walking >200m IIb | Moderate-severe claudication | Walking <200m III | Ischemic rest pain | Pain in forefoot at rest, relieved by dangling leg IV | Tissue loss | Ulcer / Gangrene INTERMITTENT CLAUDICATION BOX (bright yellow): - Pain/cramping in calf/thigh/buttock on walking - RELIEVED BY REST (distinguish from spinal stenosis: need to sit) - Reproducible at same walking distance - Specific muscle group affected = localizes stenosis level LERICHE SYNDROME BOX (red alert): Aortoiliac occlusion TRIAD: - Bilateral buttock/thigh claudication - Erectile dysfunction - Absent femoral pulses CLINICAL SIGNS (purple box): - Decreased/absent peripheral pulses - Buerger's test: pallor on elevation, rubor on dependency (>20° elevation → pallor) - Buerger's angle: <20° = severe ischemia - Skin changes: shiny, hairless, thin skin; thickened nails - Cool, pale limb - Dry gangrene (arterial) vs wet gangrene (infected) - Capillary refill >2 seconds RIGHT COLUMN: INVESTIGATIONS (teal header): ABI (ANKLE-BRACHIAL INDEX) - KEY TEST: Large table: ABI Value | Interpretation >1.3 | Non-compressible (calcified) vessels 1.0-1.4 | NORMAL 0.9-1.0 | Borderline 0.7-0.9 | Mild PAD 0.4-0.7 | Moderate PAD <0.4 | Severe/Critical ischemia Duplex Ultrasound: First-line imaging, flow velocities, stenosis CTA / MRA: Pre-operative planning, anatomy Conventional Angiography: Gold standard, therapeutic CRITICAL LIMB ISCHEMIA (CLI) - RED BOX: Definition: ABI <0.4, rest pain, tissue loss "6 Ps" of ACUTE ISCHEMIA: Pain, Pallor, Pulselessness, Paraesthesia, Paralysis, Perishing cold Medical emergency - needs urgent revascularization MANAGEMENT (green/red header): CONSERVATIVE: - Smoking cessation (#1 priority) - Exercise rehabilitation (supervised - first line for claudication) - Risk factor modification: statin (atorvastatin), antiplatelet (aspirin/clopidogrel), BP control, DM control - Cilostazol (PDE3 inhibitor) - improves claudication distance INTERVENTIONAL: - Endovascular: Angioplasty ± stenting (short segment stenosis) - Surgical: Bypass grafting (long segment occlusion) - aorto-bifemoral, fem-pop bypass - Amputation: Last resort for non-salvageable limb BOTTOM BAR (yellow): KEY DIFFERENTIALS: Venous claudication (heaviness, slower relief), Spinal stenosis (neurogenic - need to sit/flex), DVT, Buerger's disease (young male smoker, affects small vessels) ABI formula: Ankle systolic BP ÷ Brachial systolic BP (use higher of both ankles, higher of both arms) Clean, color-coded, professional medical poster style, all text clearly legible
One-page high-yield medical notes poster for ARTERIOSCLEROSIS & ATHEROSCLEROSIS. Dark background (#0d1117). Colorful, dense, organized, professional clinical notes medical poster. All text sharp and legible. TOP HEADER: "ARTERIOSCLEROSIS & ATHEROSCLEROSIS" in large bold white text with artery cross-section icon. Subtitle: "High-Yield Notes" in yellow. Small definitions: Arteriosclerosis = hardening of arteries (broad term) | Atherosclerosis = lipid-laden plaque in intima (most important type) LEFT COLUMN (blue theme): TYPES OF ARTERIOSCLEROSIS (blue header): 1. ATHEROSCLEROSIS (most common, most important) - intimal plaques 2. MONCKEBERG'S MEDIAL CALCIFIC SCLEROSIS - calcification of media, no lumen narrowing, affects medium vessels (muscular arteries), NOT atherosclerosis, NOT obstructive, incidental finding 3. ARTERIOLOSCLEROSIS - small arteries/arterioles: - Hyaline arteriolosclerosis (benign HTN, diabetes) - Hyperplastic arteriolosclerosis (malignant HTN - onion-skin appearance) RISK FACTORS FOR ATHEROSCLEROSIS (orange box): NON-MODIFIABLE: Age (men >45, women >55), Male sex, Family history, Genetics MODIFIABLE (major): Smoking, Hypertension, Dyslipidemia (high LDL, low HDL), Diabetes mellitus MODIFIABLE (minor): Obesity, Sedentary lifestyle, Hyperhomocysteinemia, CRP elevation, Metabolic syndrome PATHOGENESIS - RESPONSE TO INJURY HYPOTHESIS (flowchart, orange/yellow): Step 1: ENDOTHELIAL INJURY (HTN, smoking, DM, dyslipidemia) ↓ Step 2: LDL enters intima → OXIDIZED LDL (ox-LDL) - key step ↓ Step 3: Macrophage recruitment → engulf ox-LDL → FOAM CELLS (macrophages full of lipid) ↓ Step 4: FATTY STREAK formation (earliest visible lesion - reversible, yellow lipid streaks) ↓ Step 5: Smooth muscle cell migration from media to intima → proliferation ↓ Step 6: FIBROUS PLAQUE (lipid core + fibrous cap) = ATHEROMA ↓ Step 7: Complications: Calcification, Ulceration, PLAQUE RUPTURE → THROMBOSIS → ACUTE EVENTS MIDDLE COLUMN: ATHEROSCLEROTIC PLAQUE STRUCTURE DIAGRAM (cross-section of artery): Detailed labeled cross-section showing: - Outer: adventitia - Fibrous cap (smooth muscle + collagen) labeled in blue - Lipid/necrotic core labeled in yellow - Foam cells labeled in orange - Calcification spots labeled in white - Luminal narrowing shown in red - Labels: "Stable plaque = thick cap, small core" vs "Vulnerable plaque = thin cap, large core → RUPTURE RISK" COMPLICATIONS TABLE (colored): Complication | Mechanism | Clinical Result Thrombosis | Plaque rupture → platelet aggregation | MI, stroke, acute limb ischemia Aneurysm | Vessel wall weakening | AAA, dissection Calcification | Dystrophic calcification | Stiff vessels, valve disease Stenosis | Progressive narrowing | Stable angina, claudication, renal failure Embolism | Plaque/thrombus fragments | Stroke, mesenteric ischemia VESSELS MOST AFFECTED (diagram, labeled arteries): Aorta (most commonly), Coronary arteries, Carotid arteries, Iliac/femoral arteries, Renal arteries, Circle of Willis RIGHT COLUMN: CLINICAL MANIFESTATIONS BY TERRITORY (teal header): Coronary arteries → IHD: Stable angina, ACS (NSTEMI/STEMI), Sudden cardiac death Cerebral arteries → Stroke, TIA, Vascular dementia Renal arteries → Renovascular hypertension, Ischemic nephropathy Peripheral arteries → PAD, Claudication, Critical limb ischemia, Gangrene Mesenteric arteries → Mesenteric ischemia, Intestinal angina Aorta → AAA (Abdominal Aortic Aneurysm), Aortic dissection INVESTIGATIONS (purple): Lipid panel: LDL, HDL, total cholesterol, triglycerides hsCRP: inflammation marker, risk stratification Coronary Calcium Score (CT): quantifies calcification burden Imaging: Duplex USS, CTA, MRA, Angiography ABI for PAD PREVENTION & MANAGEMENT (green/red): PRIMARY PREVENTION: - Lifestyle: diet (Mediterranean), exercise, smoking cessation, weight loss - Treat HTN (target <130/80), DM (HbA1c <7%), Dyslipidemia - Statins: MOST important drug - reduce LDL, stabilize plaques, anti-inflammatory - Rosuvastatin/Atorvastatin (high intensity) for high-risk SECONDARY PREVENTION: - Antiplatelet: Aspirin 75-100mg/day ± Clopidogrel - Statin: mandatory (target LDL <70 mg/dL or <1.8 mmol/L) - ACE inhibitor: cardioprotective - Beta-blocker: post-MI - PCSK9 inhibitors (evolocumab/alirocumab): for statin-refractory cases BOTTOM BAR (yellow): KEY HISTOLOGY: Foam cells = macrophages + smooth muscle cells engorged with lipid (Oil Red O stain positive) Fatty streak = earliest lesion (can appear in aorta of children!) Fibrous plaque = raised, white, hard, encroaches on lumen VULNERABLE PLAQUE = thin fibrous cap + large lipid core + inflammation → RUPTURE → THROMBOSIS = ACS Clean, color-coded, professional medical poster style, comprehensive, all text legible
1. AORTIC REGURGITATION
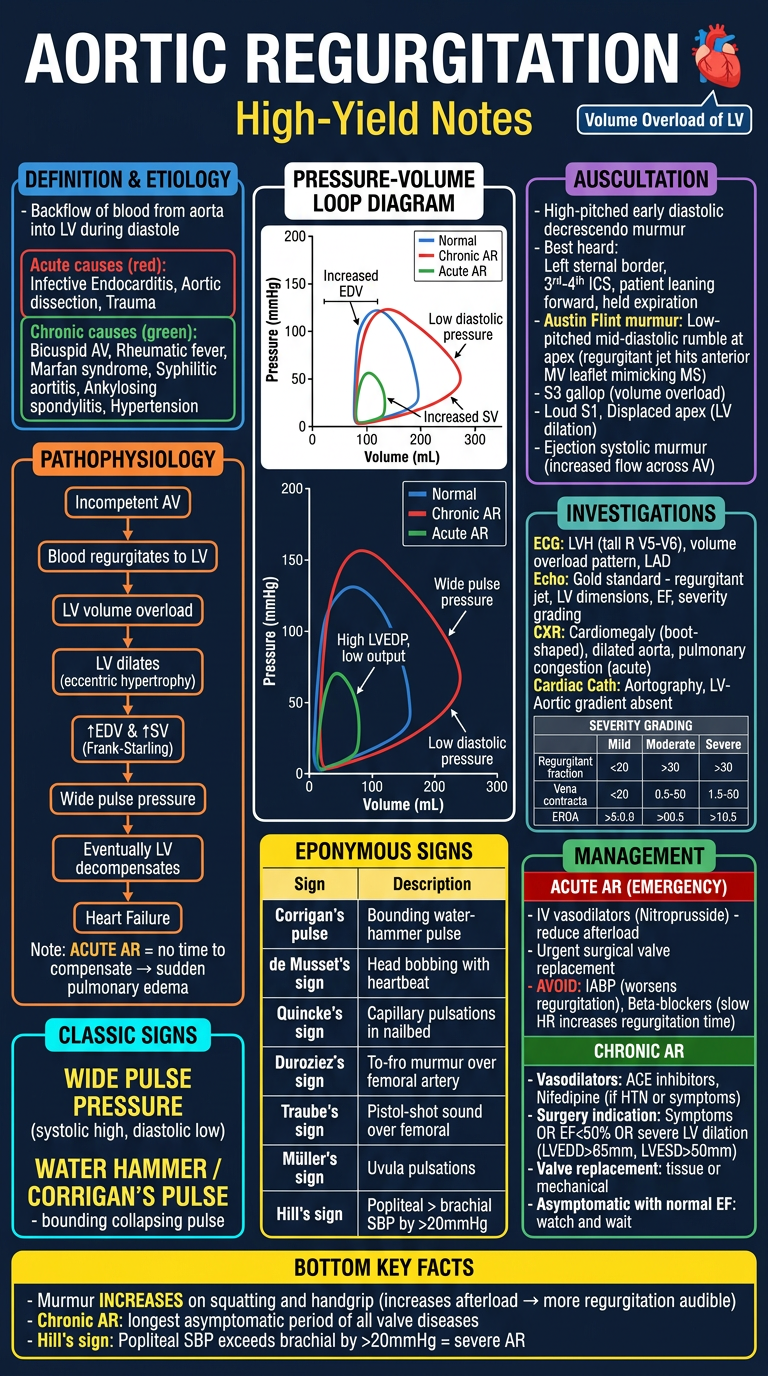
- Volume overload of LV (vs AS = pressure overload)
- PV Loop: Wide rightward-shifted loop (↑EDV, ↑SV, low diastolic pressure)
- Acute vs Chronic AR pathophysiology
- All eponymous signs: Corrigan's, de Musset's, Quincke's, Duroziez's, Traube's, Hill's
- Austin Flint murmur at apex
- Management: Vasodilators (ACE-I) + Surgery when EF <50%
2. PERIPHERAL ARTERIAL DISEASE (PAD)
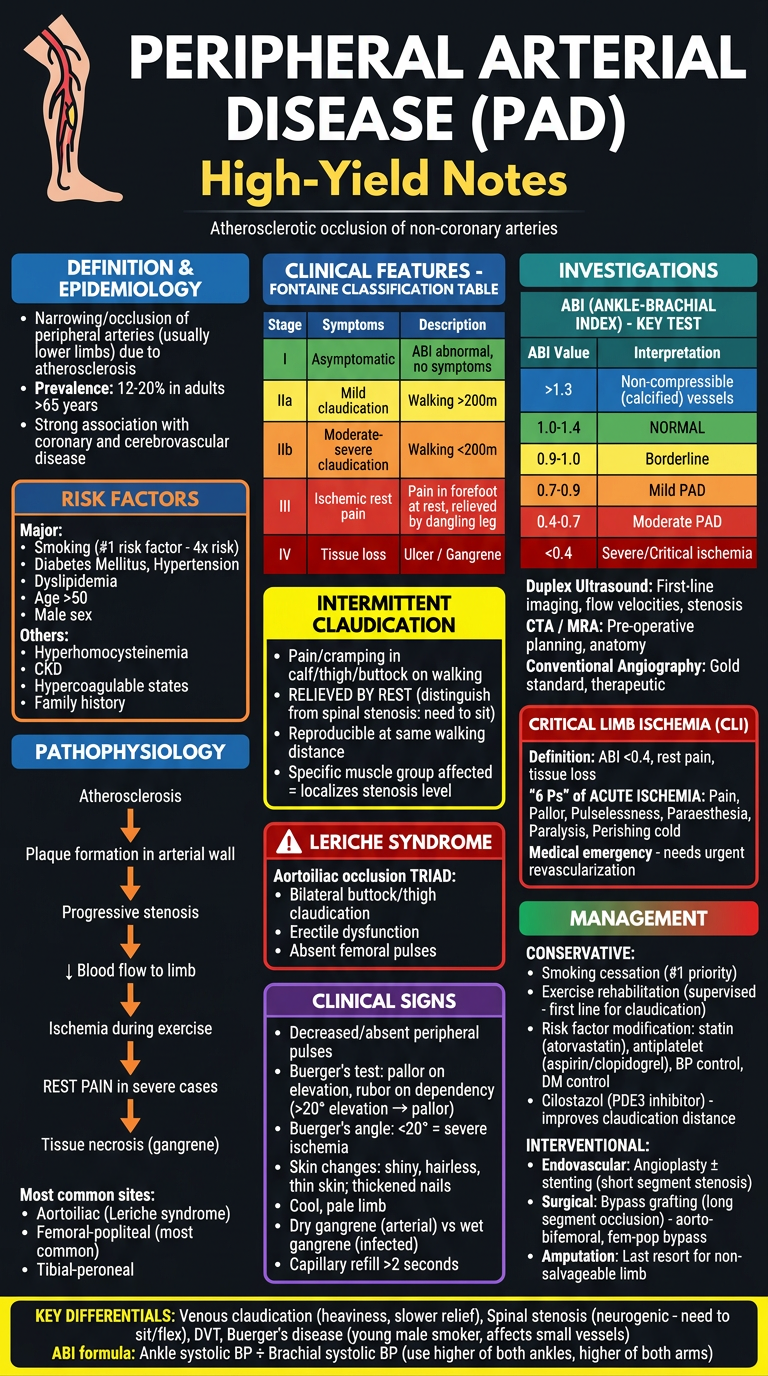
- Fontaine Classification (Stage I-IV)
- ABI values table (Normal 1.0-1.4 → Critical <0.4)
- Leriche Syndrome triad (buttock claudication + impotence + absent femoral pulses)
- Buerger's test + Buerger's angle
- 6 Ps of acute ischemia
- Management: Smoking cessation #1, Cilostazol, Angioplasty vs Bypass
3. ARTERIOSCLEROSIS & ATHEROSCLEROSIS
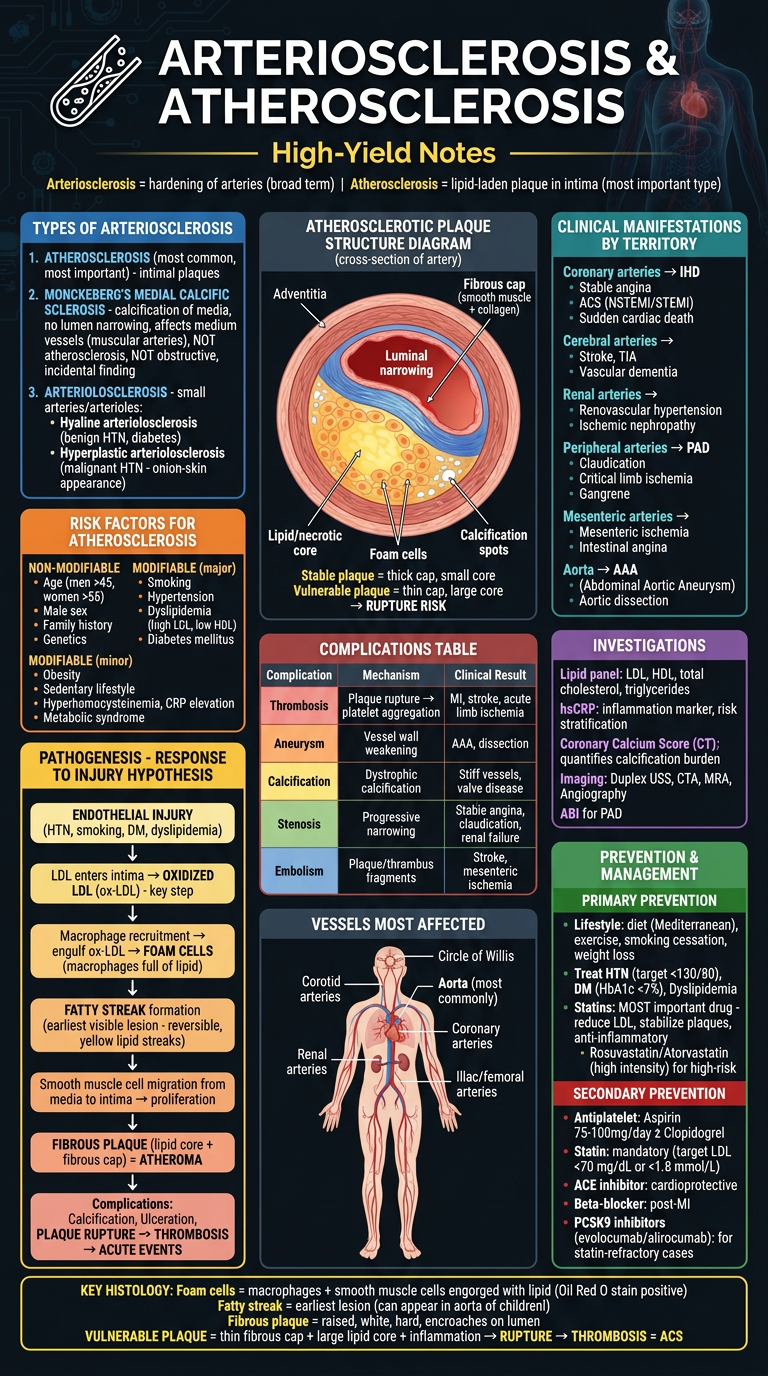
- Three types: Atherosclerosis / Monckeberg's / Arteriolosclerosis
- Full pathogenesis flowchart: Endothelial injury → ox-LDL → Foam cells → Fatty streak → Fibrous plaque → Rupture
- Artery cross-section diagram: stable vs vulnerable plaque
- Clinical manifestations by vascular territory
- Prevention: Statins (most important), antiplatelet, ACE-I, PCSK9 inhibitors
create poster on chapter 19 and ch 20 of guytons but make sure you add every point , diagrams , make pictures accordingly , make pictures i dont mind numer of pictures , just go add evrything , just it should involve everything in it
Comprehensive medical physiology poster: GUYTON Ch.19 PART 1 — "Role of Kidneys in Long-Term Arterial Pressure Regulation & Renin-Angiotensin System". Dark navy background. Dense, color-coded, all text legible, professional medical notes style. TOP HEADER: "Ch.19 — KIDNEY & ARTERIAL PRESSURE REGULATION" bold white. Subtitle: "Guyton & Hall | Long-Term BP Control" in yellow. === SECTION 1: RENAL-BODY FLUID MECHANISM (LEFT, blue) === Header: "THE INFINITE GAIN MECHANISM" in bright blue box Core principle: "Kidneys are the ONLY mechanism with theoretically INFINITE GAIN for long-term BP control" GRAPH 1 - PRESSURE NATRIURESIS CURVE (draw clearly): X-axis: Arterial Pressure (mmHg) — 0 to 200 Y-axis: Urinary Output (× normal) — 0 to 4× Curve: Steep S-shaped curve rising steeply around 100 mmHg Dotted horizontal line at 1.0 = "Normal intake = Output" Vertical line at 100 mmHg = "SET POINT / EQUILIBRIUM POINT" Arrow: "↑ Pressure → ↑ Natriuresis → ↓ Volume → BP falls back" Arrow: "↓ Pressure → ↓ Natriuresis → ↑ Volume → BP rises back" Label: "This curve can be shifted RIGHT (hypertension) or LEFT by various factors" Example: "Excess AngII or Aldosterone → shifts curve RIGHT → hypertension at new equilibrium" SALT INTAKE vs. URINARY OUTPUT DIAGRAM: Simple bar chart showing: When salt intake varies 10-fold (from 1/10 normal to 10× normal), arterial pressure barely changes IF RAAS is intact. WITHOUT RAAS: salt intake directly raises BP. THREE FACTORS that determine equilibrium pressure: 1. LEVEL OF SALT INTAKE (horizontal line moves up/down) 2. POSITION OF RENAL FUNCTION CURVE (shifts left/right) 3. INTERSECT = steady-state arterial pressure === SECTION 2: RENIN-ANGIOTENSIN-ALDOSTERONE SYSTEM (CENTER, orange) === Header: "RAAS — THE VASOCONSTRICTOR ARM" in orange COMPLETE RAAS FLOWCHART (vertical arrows): [↓ Arterial Pressure / ↓ Na delivery / ↑ Sympathetics] ↓ JUXTAGLOMERULAR (JG) CELLS — afferent arteriole of kidney 3 mechanisms for renin release: (1) JG cell baroreceptors sense ↓ pressure (2) Macula densa senses ↓ NaCl delivery to distal tubule (3) β1 adrenergic receptor stimulation ↓ RENIN (enzyme, t½ = 30-60 min) acts on ↓ ANGIOTENSINOGEN (α2-globulin, liver) ↓ Renin cleaves ANGIOTENSIN I (10 amino acids, mild vasoconstrictor) ↓ ACE (Angiotensin Converting Enzyme) — primarily LUNGS endothelium ANGIOTENSIN II (8 amino acids, POTENT) ↓ Angiotensinases (t½ = 1-2 min) ANGIOTENSIN III (7 amino acids — stimulates aldosterone) ANGIOTENSIN II ACTIONS (5 colored boxes around central AngII): 1. RED: ARTERIOLAR VASOCONSTRICTION → ↑ TPR → ↑ BP (RAPID, minutes) 2. BLUE: ALDOSTERONE secretion from adrenal cortex → Na+ & H2O retention → ↑ volume → ↑ BP (SLOW, hours-days) 3. GREEN: DIRECT RENAL EFFECTS → constricts efferent arteriole → ↑ filtration fraction → ↑ tubular reabsorption of Na+ 4. PURPLE: THIRST stimulation (hypothalamic dipsogenic center) 5. YELLOW: ADH (vasopressin) release → water retention TIMELINE BOX: RAAS active within 20 min after hemorrhage; returns BP at least 50% toward normal === SECTION 3: GOLDBLATT HYPERTENSION (RIGHT, red/yellow) === Header: "GOLDBLATT HYPERTENSION" in red Two diagrams side by side: LEFT DIAGRAM — ONE-KIDNEY GOLDBLATT: Simple kidney drawing with clamp on renal artery + cross on other kidney Timeline graph: Phase 1 (minutes): Renin → AngII → acute vasoconstriction → BP rises Phase 2 (5-7 days): Fluid retention (AngII + aldosterone) → sustained hypertension Renin levels: Rise then fall back to normal BP: Stays elevated (new equilibrium) RIGHT DIAGRAM — TWO-KIDNEY GOLDBLATT: Two kidneys, clamp on ONE artery Ischemic kidney: ↑ Renin → AngII → acts on BOTH kidneys Normal kidney: also retains fluid due to circulating AngII + aldosterone RESULT: BILATERAL salt/water retention → hypertension Clinical correlate: Renal artery stenosis in one kidney GRAPH — Renin secretion over time after one-kidney Goldblatt: X-axis: Days (0 to 8) Y-axis: Renin secretion rate (arbitrary units) Curve: peaks at day 1, returns near normal by day 5-7 Second curve: Arterial pressure — rises in 2 phases (acute then sustained) === BOTTOM ROW — KEY CONCEPTS === BOX 1 (green): INFINITE GAIN explained: Any sustained pressure change → continued urinary output change → fluid volume adjusts → pressure FULLY corrected (theoretically). Only mechanism that can completely fix long-term BP. BOX 2 (orange): NORMAL RAAS ROLE: When Na intake varies 100-fold, RAAS fully compensates → BP barely changes. ACE inhibitors prove this. BOX 3 (red): ACE INHIBITOR EFFECT: Block AngI→AngII conversion → ↓ vasoconstriction + ↓ aldosterone → ↓ BP. Salt-sensitive hypertension worsens when RAAS blocked. BOX 4 (purple): ALDOSTERONE PRIMARY (Conn's syndrome): Adrenal adenoma → excess aldosterone → Na+ retention → ↑ volume → hypertension. Early: ↑ CO; Late: ↑ TPR (autoregulation). Hypokalemia hallmark. All diagrams labeled, all graphs with axes, color-coded, clean professional style
Comprehensive medical physiology poster: GUYTON Ch.19 PART 2 — "Hypertension — Types, Mechanisms, Primary & Secondary". Dark background (#0d1117). Dense, color-coded, professional medical notes poster, all text legible. TOP HEADER: "Ch.19 — HYPERTENSION: TYPES & MECHANISMS" bold white. Subtitle: "Guyton & Hall | Primary & Secondary Hypertension" in yellow. === SECTION 1: CLASSIFICATION OF HYPERTENSION (LEFT, blue) === TYPES TABLE (color-coded rows): Type | % of cases | Key Feature PRIMARY/ESSENTIAL | 90-95% | Unknown origin; obesity/SNS/kidney impairment SECONDARY | 5-10% | Identifiable cause SECONDARY HYPERTENSION CAUSES (orange bullets): • Renal artery stenosis (Goldblatt) → ↑ Renin • Chronic renal disease → ↓ pressure natriuresis • Primary aldosteronism (Conn's) → Na+ retention • Pheochromocytoma → excess catecholamines • Cushing's syndrome → excess cortisol/corticosteroids • Coarctation of aorta → mechanical obstruction • Monogenic hypertension (rare, <1%) → single gene mutations (all cause impaired renal function) === SECTION 2: PRIMARY (ESSENTIAL) HYPERTENSION — OBESITY LINK (CENTER, orange) === Header: "PRIMARY HYPERTENSION — OBESITY PATHWAY" in orange FLOWCHART: EXCESS WEIGHT GAIN / OBESITY ↓ (multiple pathways drawn with arrows) ├── ↑ Leptin → Hypothalamus → ↑ SNS activity → ↑ Renal sympathetics → ↑ Renin → AngII ├── ↑ Cardiac output (increased tissue blood flow demands) ├── ↑ AngII + Aldosterone → ↑ renal Na+ reabsorption ├── Physical compression of kidneys by perinephric fat → impaired pressure natriuresis ├── Activation of chemoreceptors (esp. in sleep apnea) └── Reduced baroreceptor sensitivity ↓ IMPAIRED RENAL PRESSURE NATRIURESIS ↓ CHRONIC HYPERTENSION EARLY vs LATE STAGES BOX: EARLY PRIMARY HTN: ↑ Cardiac output (↑ blood volume), normal/low TPR LATE PRIMARY HTN: CO returns to normal, TPR increases (vascular remodeling/hypertrophy) → maintained hypertension WHY? Autoregulation: tissues constrict arterioles when excess flow occurs → ↑ TPR === SECTION 3: TIMELINE OF BP CONTROL MECHANISMS (RIGHT TOP, multi-color) === Header: "TIMELINE OF BP CONTROL" in green BEAUTIFUL TIMELINE GRAPH: X-axis: Time after BP disturbance (seconds → minutes → hours → days → weeks) Three colored bands: RED BAND (seconds-minutes): Baroreceptor reflex, Chemoreceptor reflex, CNS ischemic response Gain: 1-2 (corrects 50-67%) ORANGE BAND (minutes-hours): RAAS (vasoconstriction arm), Stress relaxation of vessels, Aldosterone (early) Gain: 3-4 (corrects ~75%) GREEN BAND (hours-days-weeks): Renal-body fluid mechanism + RAAS fluid arm Gain: INFINITE (corrects ~100%) Key label: "ONLY the kidney mechanism has INFINITE GAIN" === SECTION 4: HYPERTENSION CONSEQUENCES (LEFT BOTTOM, purple) === Header: "CONSEQUENCES OF CHRONIC HYPERTENSION" Organ system list with small icons: HEART: LV hypertrophy (concentric) → diastolic dysfunction → Heart failure; Accelerated coronary artery disease → MI; Aortic dissection BRAIN: Stroke (hemorrhagic > ischemic), Vascular dementia, Hypertensive encephalopathy KIDNEY: Hypertensive nephrosclerosis → CKD; Proteinuria; Renal failure (end-organ damage) EYES: Hypertensive retinopathy (Keith-Wagener classification) Grade I: arterial narrowing Grade II: AV nipping Grade III: flame hemorrhages, cotton wool spots Grade IV: papilledema (hypertensive emergency) VESSELS: Accelerated atherosclerosis; AAA; Peripheral arterial disease === SECTION 5: TREATMENT OF HYPERTENSION (RIGHT BOTTOM, green/red) === Header: "ANTIHYPERTENSIVE DRUGS — MECHANISMS" in green Table with drug classes and mechanisms: Drug Class | Mechanism | Effect on RAAS ACE Inhibitors (captopril, enalapril) | Block AngI→AngII | ↓ AngII, ↓ Aldosterone ARBs (losartan, valsartan) | Block AT1 receptor | ↓ AngII effects Beta-blockers (atenolol) | ↓ Renin release + ↓ HR/CO | ↓ RAAS, ↓ CO Calcium channel blockers (amlodipine) | ↓ Ca2+ → vasodilation | Neutral/↑ RAAS Thiazide diuretics (HCTZ) | ↓ Na+ reabsorption → ↓ volume | ↑ RAAS (compensatory) Aldosterone antagonists (spironolactone) | Block aldosterone receptors | Direct RAAS blockade RAAS inhibitors (aliskiren) | Block renin directly | ↓ Angiotensin I LIFESTYLE MODIFICATIONS BOX (yellow): Weight loss (most effective), DASH diet (low Na+, high K+/Ca2+), Exercise, Quit smoking, Limit alcohol, Stress reduction Target BP: <130/80 mmHg (ACC/AHA 2017) === BOTTOM KEY FACTS BAR === CONCEPT: Renal autoregulation of GFR means kidney can maintain normal filtration over wide range of pressures (80-180 mmHg) — BUT chronic HTN → arteriolar hypertrophy → impairs this → CKD KEY FORMULA: Long-term BP controlled by: URINARY OUTPUT = SALT/WATER INTAKE at equilibrium. Any factor changing this balance changes set-point BP. Dense, detailed, color-coded, all text legible, professional physiology poster style
Comprehensive medical physiology poster: GUYTON Ch.20 PART 1 — "Cardiac Output, Cardiac Output Curves & Frank-Starling Mechanism". Dark navy background. Dense, color-coded, professional medical notes style, all text sharp and legible. TOP HEADER: "Ch.20 — CARDIAC OUTPUT & ITS REGULATION" bold white. Subtitle: "Guyton & Hall | Frank-Starling, CO Curves & Venous Return" in yellow. === SECTION 1: CARDIAC OUTPUT BASICS (LEFT TOP, blue) === Header: "CARDIAC OUTPUT — FUNDAMENTALS" in blue Key formulas box: CO = HR × SV Normal: 5 L/min (male 5.6, female 4.9) Cardiac Index = CO / BSA = 3.0 L/min/m² (for 70kg, BSA 1.7m²) Maximum (athlete): 25-35 L/min Maximum (trained): up to 35-40 L/min TABLE — FACTORS AFFECTING CO: Factor | Direction | Mechanism ↑ Metabolic rate (exercise) | ↑↑↑ | Local vasodilation → ↑ venous return ↑ Blood volume | ↑ | ↑ Preload → Frank-Starling ↑ HR (SNS) | ↑ | Direct ↑ Contractility (SNS) | ↑ | ↑ SV ↓ Peripheral resistance | ↑ | ↑ Venous return ↑ Afterload | ↓ | ↓ SV Heart failure | ↓↓ | ↓ Contractility Anemia | ↑ | Low viscosity + ↓ O2 → vasodilation === SECTION 2: CARDIAC OUTPUT CURVE — GRAPH (CENTER TOP) === Header: "CARDIAC OUTPUT (STARLING) CURVES" in orange LARGE GRAPH — Multiple CO curves: X-axis: "Right Atrial Pressure (mmHg)" from -4 to +12 Y-axis: "Cardiac Output (L/min)" from 0 to 25 Draw MULTIPLE curves in different colors: 1. RED CURVE = Maximum sympathetic stimulation (highest, plateaus at ~20-25 L/min) 2. ORANGE CURVE = Mild sympathetic stimulation (plateaus at ~15 L/min) 3. GREEN CURVE = NORMAL (plateaus at ~13 L/min, normal operating point at ~5 L/min at 0 mmHg RAP) 4. BLUE CURVE = Mild heart failure (lower plateau ~8 L/min) 5. PURPLE CURVE = Severe heart failure (very flat, low, even negative at high RAP) 6. DOTTED CURVE = Maximum parasympathetic (lowest of all) ANNOTATIONS on graph: • Arrow pointing to Normal operating point: "Normal: CO=5L/min, RAP=0 mmHg" • Label on plateau: "Maximum pumping capacity" • "Hypereffective heart: ↑ SNS, hypertrophy, exercise training" • "Hypoeffective heart: heart failure, MI, valvular disease, hypoxia" FACTORS SHIFTING CURVE UP (green list): ↑ SNS stimulation, Norepinephrine/Epinephrine, Cardiac hypertrophy, Decreased afterload, Tachycardia (mild) FACTORS SHIFTING CURVE DOWN (red list): Heart failure, ↑ Afterload (HTN, AS), Beta-blockers, Myocarditis, Ischemia, Vagal stimulation, Severe bradycardia === SECTION 3: FRANK-STARLING MECHANISM DETAIL (LEFT MIDDLE, green) === Header: "FRANK-STARLING LAW" in green DIAGRAM — Sarcomere length vs Force: Simple graph: X-axis: Sarcomere length / EDV Y-axis: Force of contraction / Stroke Volume Curve: Rises steeply, peaks at optimal sarcomere length (2.2 μm), then slightly declines Label "Optimal overlap" at peak Label "Overstretched" on downslope Label "Understretched" on upslope MECHANISM explanation box: ↑ Venous return → ↑ EDV → ↑ Fiber stretch → Better actin-myosin overlap → ↑ Cross-bridge formation → ↑ Force → ↑ SV → ↑ CO Formula visualization: SV increases in proportion to EDV (within physiological range) PHYSIOLOGICAL IMPORTANCE box: 1. Left and Right ventricles automatically balance their outputs 2. Heart automatically accommodates all venous return 3. Self-regulating without nervous system involvement === SECTION 4: HYPEREFFECTIVE vs HYPOEFFECTIVE HEART (RIGHT, red/purple) === Header: "HYPEREFFECTIVE vs HYPOEFFECTIVE HEART" HYPEREFFECTIVE (green box): Causes: • Strong sympathetic stimulation → NE → β1 → ↑ cAMP → ↑ Ca2+ → ↑ contractility • Cardiac hypertrophy (marathon runners: heart mass +50-75%, CO up to 30-40 L/min) • Effect: CO curve shifts UPWARD and LEFT (more output at same RAP) HYPOEFFECTIVE (red box): Causes: • ↑ Afterload (HTN, aortic stenosis) • Inhibition of nervous excitation • Arrhythmias • Coronary artery blockage (MI) • Valvular heart disease (MS, AS, MR, AR) • Congenital heart disease • Myocarditis • Cardiac hypoxia • Effect: CO curve shifts DOWNWARD and RIGHT NERVE IMPORTANCE DIAGRAM: Two graphs side by side: LEFT: With intact autonomic NS — peripheral vasodilation (dinitrophenol) → CO increases 4-fold, BP maintained RIGHT: Without autonomic NS — same vasodilation → BP falls to ½ normal, CO only increases 1.6-fold KEY MESSAGE: Normal arterial pressure maintained by NS is PREREQUISITE for high CO during exercise === BOTTOM: METHODS OF MEASURING CO === Header: "METHODS TO MEASURE CARDIAC OUTPUT" in teal Table: Method | Principle | Key Notes FICK METHOD | CO = VO2/(CaO2-CvO2) | Gold standard; requires PA catheter INDICATOR DILUTION | CO = Amt dye / (mean conc × time) | Cardiogreen dye; extrapolate curve THERMODILUTION | Cold saline; temp curve in PA | Most common ICU method (Swan-Ganz) ECHOCARDIOGRAPHY | LVOT velocity × CSA × HR | Noninvasive, Doppler based BIOIMPEDANCE | Thoracic electrical impedance | Noninvasive; error rate 20-40% All graphs labeled with axes and units, color-coded, professional physiology poster
Comprehensive medical physiology poster: GUYTON Ch.20 PART 2 — "Venous Return, Mean Systemic Filling Pressure & Combined CO-VR Analysis". Dark navy background. Dense, color-coded, professional medical notes style, all text sharp and legible. TOP HEADER: "Ch.20 — VENOUS RETURN & CO-VR INTERACTION" bold white. Subtitle: "Guyton & Hall | Mean Systemic Filling Pressure, Venous Return Curves, Combined Analysis" in yellow. === SECTION 1: VENOUS RETURN & MEAN SYSTEMIC FILLING PRESSURE (LEFT, blue/orange) === Header: "MEAN SYSTEMIC FILLING PRESSURE (Psf)" in blue DEFINITION BOX: Psf = pressure throughout systemic circulation when ALL FLOW STOPS and pressure equilibrates everywhere Normal Psf = 7 mmHg Think of it as the "elastic recoil pressure" of the entire vascular system FORMULA: Venous Return = (Psf − RAP) / Resistance to Venous Return Normal: VR = (7 − 0) / 1.4 PRU = 5 L/min GRAPH 1 — VENOUS RETURN CURVE: X-axis: Right Atrial Pressure (mmHg) from -4 to +10 Y-axis: Venous Return (L/min) from 0 to 7 Main green curve: Falls linearly as RAP rises; reaches ZERO at RAP = +7 mmHg (= Psf) PLATEAU at negative pressures (below -2 mmHg): Curve flattens (veins collapse in chest) Label at zero crossing: "Psf = 7 mmHg = Mean Systemic Filling Pressure" Label on plateau: "Venous collapse plateau — large intrathoracic veins collapse when RAP < -2 mmHg" Normal operating point: RAP = 0, VR = 5 L/min FACTORS CHANGING VENOUS RETURN CURVE (two columns): SHIFT RIGHT (↑ Psf → ↑ VR): • ↑ Blood volume • Sympathetic venoconstriction (↓ venous compliance) • Exercise SHIFT OF SLOPE (resistance to VR): • ↓ Peripheral resistance → steeper slope (more VR for same Psf-RAP gradient) • Arteriovenous fistula → very steep slope === SECTION 2: COMBINED CO + VR CURVES — THE MASTER GRAPH (CENTER TOP) === Header: "COMBINED CARDIAC OUTPUT & VENOUS RETURN ANALYSIS" in orange LARGE MASTER GRAPH: X-axis: Right Atrial Pressure (mmHg) — range -4 to +8 Y-axis: Cardiac Output / Venous Return (L/min) — range 0 to 20 Plot ALL of these simultaneously with CLEAR labels: CARDIAC OUTPUT CURVES (dashed lines): - Blue: Normal CO curve - Red: Hypereffective (SNS stimulated) CO curve — higher - Purple: Hypoeffective (heart failure) CO curve — lower VENOUS RETURN CURVES (solid lines): - Blue: Normal VR curve - Green: ↑ Blood volume / ↑ Psf — shifted right - Orange: ↓ Peripheral resistance — steeper slope EQUILIBRIUM POINTS (big dots): • Point A (blue+blue intersection): Normal = CO 5 L/min, RAP 0 mmHg • Point B (red CO + normal VR): SNS stimulation = CO 8 L/min, RAP slightly negative • Point C (purple CO + normal VR): Heart failure = CO 3 L/min, RAP +4 mmHg • Point D (normal CO + green VR): ↑ Blood volume = CO 7 L/min, RAP +2 mmHg Key insight box: "CO CANNOT EXCEED VENOUS RETURN (except momentarily). They must be equal at equilibrium." === SECTION 3: SPECIFIC CLINICAL SCENARIOS WITH GRAPHS (RIGHT TOP, multi-color) === Header: "CLINICAL CO-VR ANALYSIS SCENARIOS" SCENARIO 1 — EXERCISE (orange): Mini graph showing: VR curve shifts UP (↓ peripheral resistance + ↑ Psf) CO curve shifts UP (↑ SNS) New equilibrium: CO 20-25 L/min, RAP near normal Key: Both curves shift simultaneously — CO rises massively; RAP barely changes SCENARIO 2 — ARTERIOVENOUS FISTULA (red): Stage A→B: Immediate — VR curve rotates (↓ resistance) → CO jumps to 13 L/min Stage B→C: 1 min — SNS reflexes → ↑ Psf (venoconstriction) + ↑ CO curve → CO 16 L/min Stage C→D: Weeks — ↑ blood volume (Psf 12 mmHg) + cardiac hypertrophy → CO nearly 20 L/min Timeline graph showing 4 equilibrium points A, B, C, D with arrows SCENARIO 3 — HEMORRHAGE (blue): VR curve shifts LEFT (↓ Psf due to ↓ blood volume) CO curve drops (↓ preload + ↑ SNS partially compensates) New equilibrium: ↓ CO, ↑ RAP (or normal if compensated) Compensation: SNS venoconstriction → partial restoration of Psf === SECTION 4: REGULATION OF VENOUS RETURN — ALL FACTORS (BOTTOM LEFT, green) === Header: "REGULATION OF VENOUS RETURN — COMPLETE" Table with arrows: Factor | Effect on VR | Mechanism ↑ Blood volume | ↑ | ↑ Psf Sympathetic venoconstriction | ↑ | ↑ Psf (↓ venous compliance) ↓ Peripheral resistance | ↑ | More arteriole-to-vein flow (↑ venous filling) Skeletal muscle pump | ↑ | Compresses veins + valves prevent backflow Respiratory pump (inspiration) | ↑ | ↓ Intrathoracic pressure → suction on intrathoracic veins Gravity (standing) | ↓ (legs) | Hydrostatic pressure opposes venous return from legs ↑ RAP (heart failure) | ↓ | Back-pressure reduces Psf-RAP gradient Hemorrhage | ↓ | ↓ Psf Arteriovenous fistula | ↑↑ | Direct bypass of resistance → ↑ effective venous return === SECTION 5: CO DURING EXERCISE (BOTTOM CENTER, red) === Header: "CO REGULATION DURING EXERCISE" Graph showing CO vs Exercise Intensity (METs): X-axis: Exercise intensity (rest to maximum) Y-axis: CO (L/min) from 5 to 35 Two curves: Non-athlete (plateaus at ~20 L/min) vs Trained athlete (plateaus at ~35 L/min) TABLE — Exercise cardiovascular response: Parameter | Rest | Strenuous Exercise CO | 5 L/min | 20-35 L/min HR | 70 bpm | 180-200 bpm SV | 70 mL | 150-200 mL MAP | 93 mmHg | 120-130 mmHg TPR | ~19 PRU | ~4-5 PRU Muscle blood flow | 750 mL/min | 16,000 mL/min === BOTTOM BAR — KEY EQUATIONS === Gold bar: VR = (Psf − RAP) / Rvr CO = VR at equilibrium (must be equal) Psf normal = 7 mmHg Resistance to VR normal = ~1.4 mmHg/L/min Cardiac Index = CO/BSA = 3 L/min/m² Max CO limited by: venous return capability > heart's pumping ability All graphs fully labeled with axes, units, multiple curves with legends, color-coded, professional physiology poster style
📘 CHAPTER 19 — Role of Kidneys in Arterial Pressure Regulation
POSTER 1 — Renal-Body Fluid Mechanism + RAAS + Goldblatt Hypertension
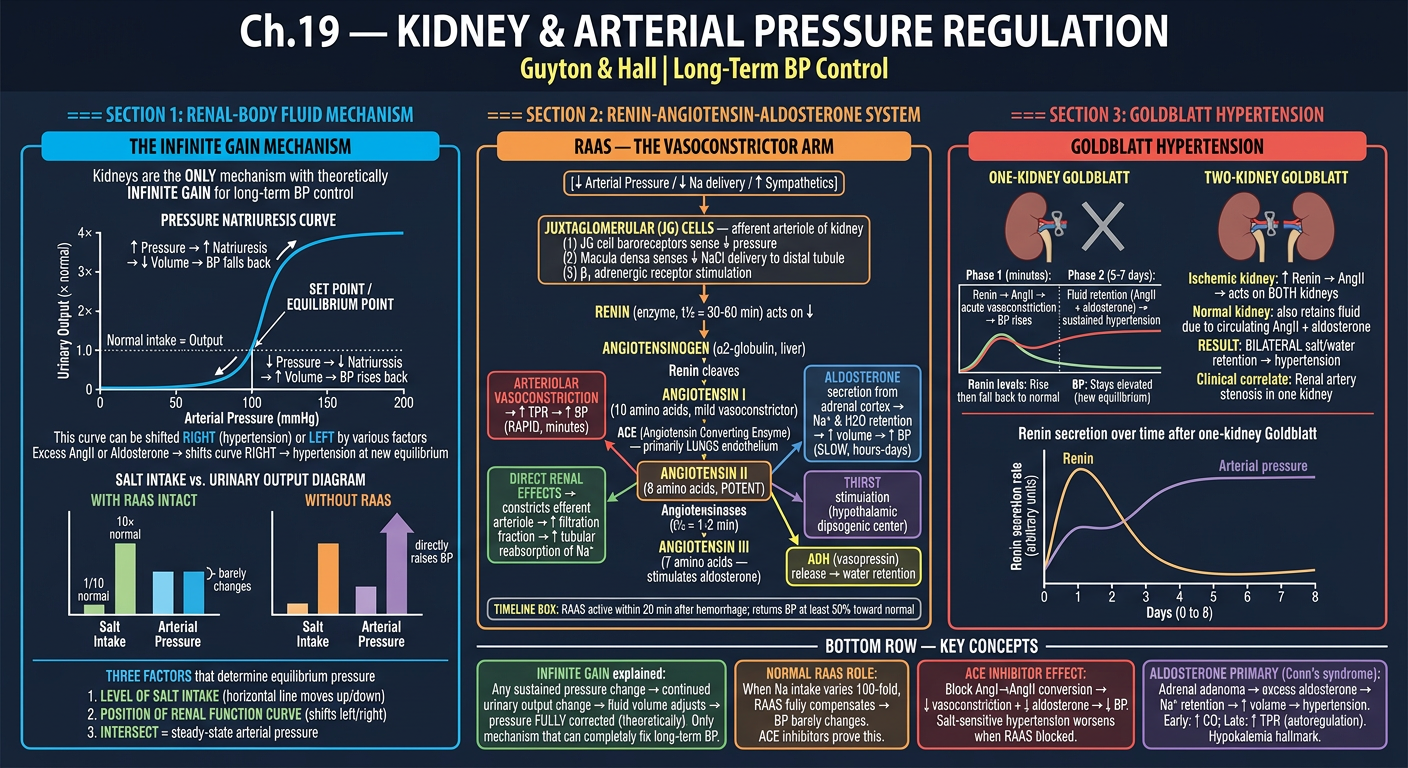
- Pressure natriuresis curve with SET POINT concept
- INFINITE GAIN mechanism explained
- Complete RAAS flowchart: JG cells → Renin → AngI → AngII (ACE in lungs) → 5 actions of AngII
- 3 stimuli for renin release (baroreceptor in JG, macula densa NaCl, β1-SNS)
- AngII timeline: vasoconstriction in minutes, fluid retention over days
- One-kidney vs Two-kidney Goldblatt hypertension with phase graphs
POSTER 2 — Types of Hypertension, Primary HTN, Timeline of BP Control
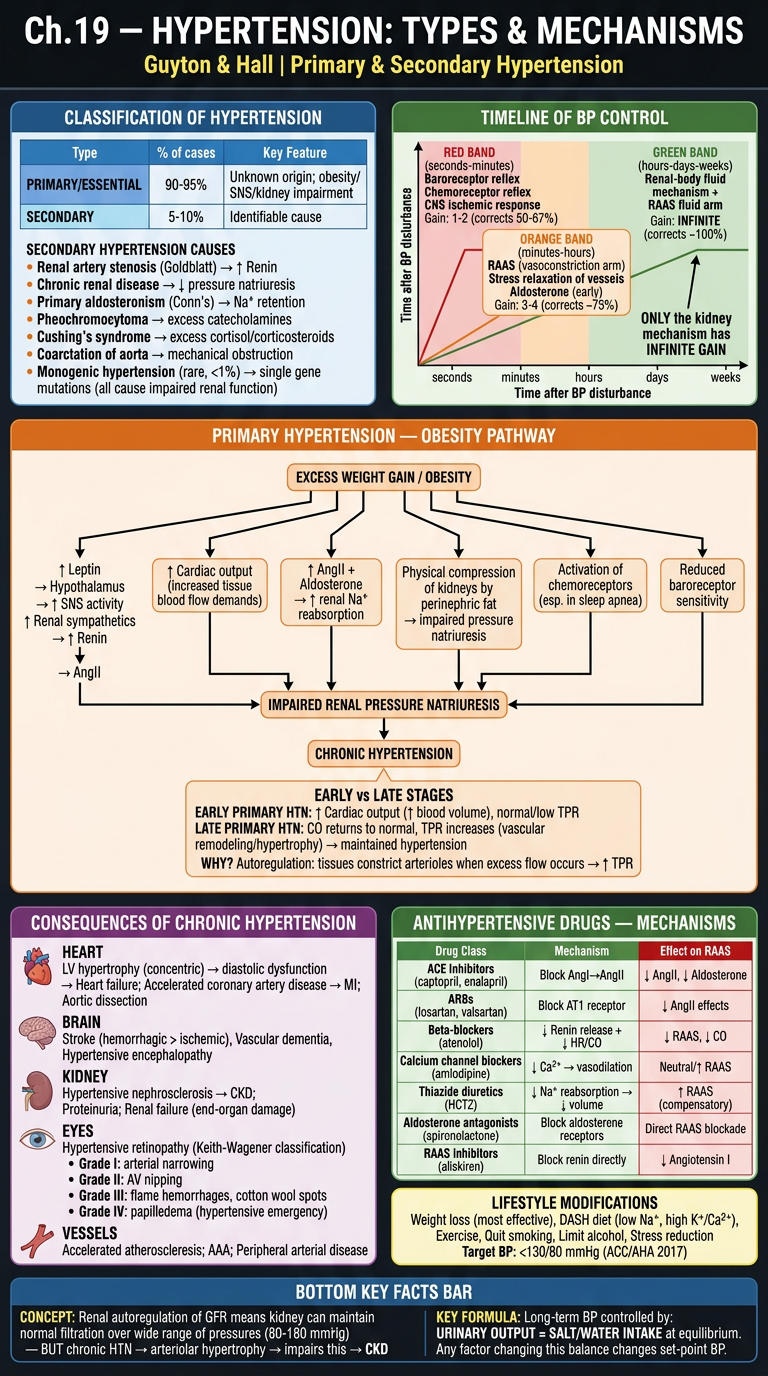
- Classification: Primary 90-95% vs Secondary 5-10%
- Obesity → SNS → Leptin → Renal impairment → HTN pathway
- Early (↑CO) vs Late (↑TPR) primary HTN stages
- Timeline graph: Nervous (seconds) → RAAS (minutes-hours) → Renal (days-weeks) with GAINS
- Hypertensive retinopathy grades I-IV
- End-organ damage: Heart, Brain, Kidney, Eyes, Vessels
- Drug table: ACE-I, ARBs, CCBs, Diuretics, Aldosterone antagonists, mechanisms
📗 CHAPTER 20 — Cardiac Output & Its Regulation
POSTER 3 — CO Basics, Cardiac Output Curves, Frank-Starling
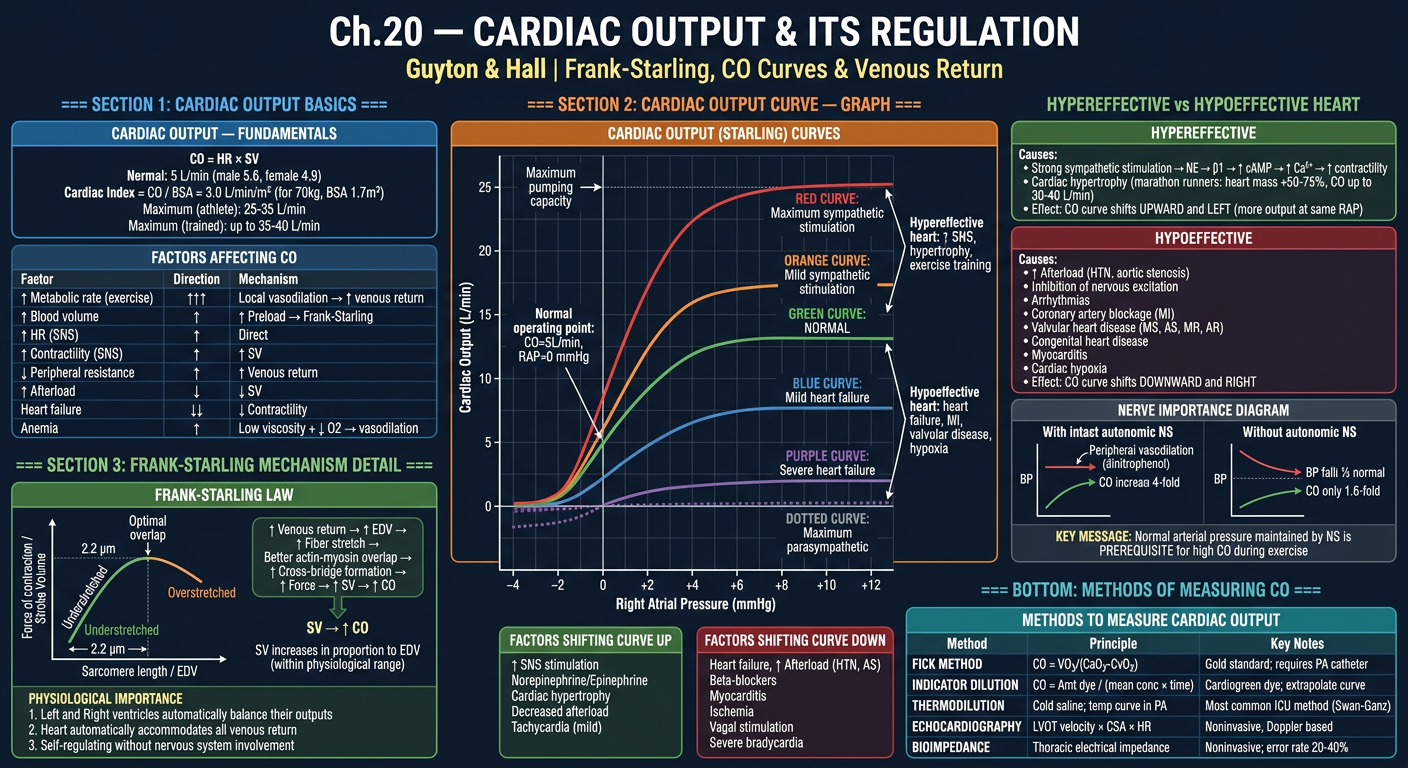
- CO = HR × SV; Cardiac Index; normal values
- Multiple CO curves (Maximum SNS → Normal → Heart failure → Severe HF)
- Factors shifting curve UP (hypereffective) vs DOWN (hypoeffective)
- Frank-Starling sarcomere length vs force graph (optimal 2.2 μm)
- Hypereffective heart: SNS + hypertrophy (marathon runners 30-40 L/min)
- Hypoeffective causes: MI, valvular disease, hypoxia, myocarditis
- Dinitrophenol experiment: Importance of nervous BP maintenance for high CO
- CO measurement methods table: Fick, Thermodilution, Echo, Bioimpedance
POSTER 4 — Venous Return, Psf, Combined CO-VR Curves, Clinical Scenarios
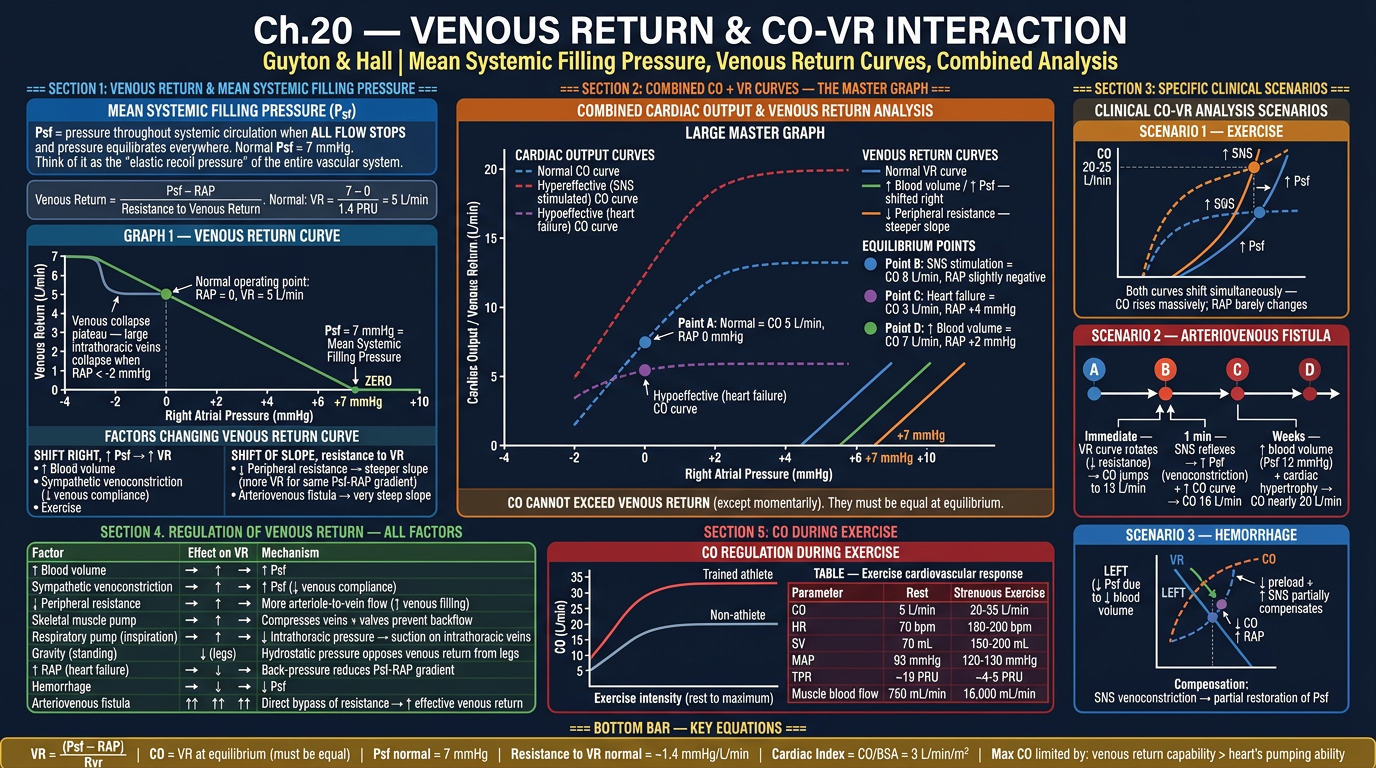
- Psf = 7 mmHg; VR formula: VR = (Psf - RAP)/Resistance
- Venous return curve with plateau (vein collapse at -2 mmHg RAP)
- MASTER COMBINED GRAPH: Multiple CO + VR curves with equilibrium points A, B, C, D
- 3 clinical scenarios with analysis: Exercise, AV Fistula (4-stage), Hemorrhage
- Complete VR regulation table (all factors with mechanisms)
- Exercise CO response: non-athlete vs athlete (5→20 vs 5→35 L/min)
- Complete exercise cardiovascular response table
Generate posters for Guyton Chapter 18 (Nervous Regulation) and Chapter 21 (Exercise Blood Flow)
Comprehensive medical physiology poster: GUYTON Ch.18 PART 1 — "Autonomic Nervous System & Vasomotor Center". Dark navy background (#0d1117). Dense, color-coded, all text legible, professional medical notes poster style. TOP HEADER: "Ch.18 — NERVOUS REGULATION OF CIRCULATION (PART 1)" bold white. Subtitle: "Guyton & Hall | Autonomic NS, Vasomotor Center & Sympathetic Control" in yellow. === SECTION 1: AUTONOMIC NERVOUS SYSTEM ANATOMY (LEFT, blue) === Header: "SYMPATHETIC INNERVATION OF CIRCULATION" in bright blue box SPINAL ORIGIN DIAGRAM (labeled anatomy): Draw a simple spinal cord diagram showing: - Sympathetic fibers exit from ALL THORACIC spinal nerves (T1-T12) and first 1-2 LUMBAR (L1-L2) - Enter SYMPATHETIC CHAIN (paravertebral) bilaterally - Then branch via TWO ROUTES: Route 1: Specific sympathetic nerves → viscera + heart (internal organs) Route 2: Peripheral spinal nerves → peripheral vasculature VESSELS INNERVATED (bullet list): ✓ All arteries (especially small arteries & arterioles — MAJOR EFFECT on resistance) ✓ All veins (regulate capacitance / venous return) ✓ Metarterioles and some precapillary sphincters (mesenteric vessels) ✗ Capillaries — NOT directly innervated NEUROTRANSMITTER BOX: Sympathetic vasoconstrictor → NOREPINEPHRINE → α1-adrenergic receptors → VASOCONSTRICTION Dual system: (1) Direct nerve NE release + (2) Adrenal medulla → systemic NE + Epinephrine Epinephrine special: causes VASODILATION via β2 receptors in skeletal muscle and coronary arteries === SECTION 2: THE VASOMOTOR CENTER (CENTER TOP, orange) === Header: "THE VASOMOTOR CENTER — MEDULLARY CONTROL" in orange BRAIN DIAGRAM (lateral view of brainstem): Show medulla oblongata with labeled areas: AREA 1 — VASOCONSTRICTOR AREA (C1 area, lateral medulla): - Continuously fires → maintains VASOMOTOR TONE (tonic sympathetic discharge) - Keeps arterioles at ~50% maximum constriction - WHY: Allows both vasodilation AND further vasoconstriction - Transmits via sympathetic chain → α1-adrenergic → NE release AREA 2 — VASODILATOR AREA (medial medulla): - Inhibits the vasoconstrictor area → indirect vasodilation - Also sends signals to vagal center → ↓HR AREA 3 — SENSORY AREA (NTS — Nucleus Tractus Solitarius): - Receives signals from baroreceptors + chemoreceptors - Modulates Areas 1 and 2 HIGHER CENTER CONTROL (flowchart to vasomotor center): Hypothalamus (posterolateral) → EXCITATION → vasomotor center Hypothalamus (anterior) → inhibition or excitation Cerebral cortex (motor cortex, orbital frontal, anterior temporal, amygdala, hippocampus) → can EXCITE or INHIBIT Reticular formation (pontine, mesencephalic): lateral/superior = excite; medial/inferior = inhibit VASOMOTOR TONE EXPERIMENT BOX (red): Total spinal anesthesia → removes ALL sympathetic tone → arterial pressure falls from 100 to 50 mmHg Proves tonic sympathetic discharge normally maintains ~50 mmHg of "sympathetic tone" in arterioles === SECTION 3: SYMPATHETIC EFFECTS ON HEART & VESSELS TABLE (RIGHT TOP, purple) === Header: "SYMPATHETIC vs PARASYMPATHETIC CARDIOVASCULAR EFFECTS" TABLE (color-coded rows): Parameter | Sympathetic Effect | Receptor | Parasympathetic Effect | Receptor Heart Rate | ↑ (chronotropy) | β1 | ↓ | M2 Contractility | ↑ (inotropy) | β1 | ↓ (minor) | M2 AV Conduction | ↑ (dromotropy) | β1 | ↓ (AV block) | M2 Arterioles (most) | CONSTRICTION | α1 | Minimal effect | — Coronary arteries | Constriction (α1) OR Dilation (β2) | both | Dilation | M Skeletal muscle vessels | Constriction (α1); Dilation (β2) | both | — | — Veins | CONSTRICTION | α1 | Minimal | — Adrenal medulla | ↑ NE+Epi secretion | Nicotinic | — | — === SECTION 4: RAPID PRESSURE CONTROL MECHANISMS OVERVIEW (LEFT BOTTOM, green) === Header: "3 NERVOUS MECHANISMS FOR RAPID BP CONTROL" 1. BARORECEPTOR REFLEX (green) — response time: SECONDS → Most important; operates 0-180 mmHg; greatest sensitivity at 60-160 mmHg → Reduces BP variation to 1/3 of what would occur without it 2. CHEMORECEPTOR REFLEX (orange) — activated when BP < 80 mmHg Peripheral chemoreceptors: carotid & aortic bodies Detect: ↓O2, ↑CO2, ↑H+ → Stimulate vasomotor center → vasoconstriction + ↑HR Central chemoreceptors: medullary surface → Detect ↑CO2/H+ → further stimulate vasomotor center → Also stimulate respiration 3. CNS ISCHEMIC RESPONSE (red) — "LAST DITCH" mechanism → Activated when BP < 60 mmHg (most powerful below 15-20 mmHg) → CO2+H+ accumulate in vasomotor center → MAXIMUM sympathetic discharge → Raises BP up to 250 mmHg → CUSHING REFLEX: ↑ICP → compresses brain vessels → ischemia → ↑BP + bradycardia + irregular breathing (Cushing Triad) → Kidneys cease urine output completely (max renal arteriolar constriction) GAIN COMPARISON BOX (yellow): Mechanism | Time Course | Gain Baroreceptor reflex | Seconds | 1-2 Chemoreceptor reflex | Seconds | ~2 RAAS (vasoconstrictor) | 20-30 min | 3-4 Stress-relaxation | Minutes-hours | ~0.5 Renal-body fluid | Hours-days | INFINITE All diagrams labeled, color-coded, professional physiology poster style
Comprehensive medical physiology poster: GUYTON Ch.18 PART 2 — "Baroreceptor Reflex, Chemoreceptors, Atrial Reflexes, CNS Ischemic Response & Pressure Waves". Dark navy background. Dense, colorful, professional medical notes style, all text legible. TOP HEADER: "Ch.18 — NERVOUS REGULATION (PART 2)" bold white. Subtitle: "Guyton & Hall | Baroreflexes, Chemoreflexes, Atrial Reflexes & Vasomotor Waves" in yellow. === SECTION 1: BARORECEPTOR REFLEX — COMPLETE (LEFT, blue/green) === Header: "ARTERIAL BARORECEPTOR REFLEX" in blue ANATOMY DIAGRAM (labeled neck/chest): Draw neck and upper chest showing: - CAROTID SINUS: Wall of internal carotid artery, just above bifurcation → Signals via HERING'S NERVE → Glossopharyngeal nerve (CN IX) → NTS medulla - AORTIC ARCH baroreceptors → Signals via VAGUS NERVE (CN X) → NTS medulla - Both → NTS → inhibit vasoconstrictor area + excite vagal center FIRING RATE GRAPH: X-axis: Arterial Pressure (mmHg) 0 to 200 Y-axis: Baroreceptor firing rate (impulses/sec) Carotid curve: S-shaped, starts at 50-60 mmHg, steepest between 80-150 mmHg, max at 180 mmHg Aortic curve: Same shape but shifted RIGHT by 30 mmHg Arrow at 100 mmHg: "Normal operating range — greatest sensitivity here" Note: Responds to RATE OF CHANGE more than steady pressure REFLEX RESPONSE FLOWCHART: ↑ ARTERIAL PRESSURE ↓ (stretch baroreceptors) ↑ Baroreceptor firing → NTS activated ↓ Inhibit vasoconstrictor center + Excite vagal center ↓ ↓ ↓ Sympathetic outflow ↑ Vagal (parasympathetic) ↓ ↓ VASODILATION all systemic ↓ Heart Rate arteries + veins ↓ Contractility ↓ ↓ ARTERIAL PRESSURE → restored toward normal BUFFER FUNCTION BOX (yellow): "Baroreceptors reduce minute-to-minute BP variation to 1/3 of what would occur without them" GRAPH: Show 2-hour BP record — Normal dog (narrow band 85-115 mmHg) vs Denervated dog (wide variation 50-160 mmHg) BARORECEPTOR RESETTING BOX (red alert): If pressure stays elevated for 1-2 days → baroreceptors RESET to new higher pressure → Fire at normal rate even at 160 mmHg → Therefore NOT important for LONG-TERM BP control (kidneys do this) → Important only for MOMENT-TO-MOMENT buffering === SECTION 2: CHEMORECEPTOR REFLEX (CENTER TOP, orange) === Header: "CHEMORECEPTOR REFLEX FOR BP CONTROL" in orange PERIPHERAL CHEMORECEPTORS (labeled diagram): Location: Carotid bodies + Aortic bodies Stimuli: ↓O2 (most potent), ↑CO2, ↑H+ Pathway: Via CN IX (carotid bodies) + CN X (aortic bodies) → NTS → vasomotor center Effect on circulation: VASOCONSTRICTION → ↑ BP Also stimulate respiratory center → hyperventilation Activated when: BP falls below 80 mmHg (ischemia → ↓O2 delivery to chemoreceptors) CENTRAL CHEMORECEPTORS: Location: Ventral medullary surface Stimuli: ↑CO2 / ↑H+ in CSF Primary function: Regulate respiration Secondary: Also stimulate vasomotor center → mild vasoconstriction === SECTION 3: ATRIAL AND PULMONARY ARTERY REFLEXES (RIGHT TOP, purple) === Header: "LOW-PRESSURE VOLUME RECEPTORS" in purple LOCATIONS: Atrial walls (both atria): stretch receptors monitoring FILLING PRESSURE/VOLUME Pulmonary artery: additional low-pressure receptors THREE KEY REFLEXES FROM ATRIAL STRETCH: REFLEX 1 — BAINBRIDGE REFLEX (green box): Atrial stretch → ↑ HR (10-20% increase via SNS to SA node) Purpose: Helps heart match output to venous return Afferent: Vagus nerve Efferent: Sympathetic + vagal to SA node Note: Operates at mild stretch; overrides baroreflex at high volumes REFLEX 2 — GAUER-HENRY REFLEX (blue box): Atrial stretch → Inhibit ADH secretion (posterior pituitary) → ↑ Water excretion → ↓ blood volume → reduced filling Purpose: VOLUME REGULATION — long-term blood volume control Also called "cardiopulmonary volume reflex" REFLEX 3 — ANP RELEASE (yellow box): Atrial stretch → Atrial Natriuretic Peptide (ANP) release → Natriuresis + Vasodilation → ↓ BP + ↓ volume (BNP = Brain/B-type NP from ventricles — marker of HF) DIAGRAM showing: Blood volume increase → Atrial stretch → All 3 reflexes activate → restore normal volume === SECTION 4: VASOMOTOR WAVES (MAYER WAVES) (RIGHT BOTTOM, red) === Header: "VASOMOTOR WAVES (MAYER WAVES)" in red DESCRIPTION: Large cyclical pressure waves 10-40 mmHg amplitude superimposed on arterial pressure Period: 7-10 seconds (unanesthetized human); 26 sec (anesthetized dog) TWO CAUSES: 1. Oscillation of CNS ischemic response: BP falls → CNS ischemia → strong sympathetic → BP overshoots → ischemia relieved → relaxes → BP falls again 2. Oscillation of baroreceptor system: similar feedback oscillation RESPIRATORY WAVES (separate from Mayer waves): BP rises and falls 4-6 mmHg with each respiratory cycle (smaller, faster) Causes: 1. Respiratory center signals spill into vasomotor center 2. Inspiration → negative intrathoracic pressure → chest vessels expand → ↓ left heart filling → ↓ CO → ↓ BP 3. Pressure changes in thorax → stretch receptors === SECTION 5: ABDOMINAL COMPRESSION + EXERCISE REFLEX (BOTTOM, teal) === Header: "ABDOMINAL COMPRESSION & EXERCISE REFLEXES" ABDOMINAL COMPRESSION REFLEX: Baroreceptor/chemoreceptor stimulation → simultaneous signals to abdominal skeletal muscles → Abdominal muscles contract → compress abdominal venous reservoirs → translocate blood to heart → ↑ venous return → ↑ CO + ↑ BP Clinical: Paralyzed patients more prone to hypotension (cannot use this reflex) EXERCISE PRESSOR REFLEX: Anticipation of exercise → motor cortex fires → SIMULTANEOUS signals to: 1. Skeletal muscles (movement) 2. Autonomic centers (vasomotor center) → ↑ SNS → ↑ HR + ↑ CO Skeletal muscle contraction → compresses peripheral vessels → translocates blood to heart Result: 5-7× increase in CO during heavy exercise Arterial pressure rises from 100 mmHg (rest) to 130-160 mmHg (heavy exercise) === BOTTOM KEY FACTS BAR === Yellow bar: Baroreceptors: Most sensitive at 80-160 mmHg | Carotid sinus (CN IX via Hering's nerve) | Aortic arch (CN X) CNS Ischemic Response: BP must fall to <60 mmHg | Most powerful below 20 mmHg | Raises BP to 250 mmHg Vasomotor tone: ~50 mmHg maintained by tonic SNS discharge | Abolished by spinal anesthesia All diagrams labeled, all graphs with axes, color-coded, clean professional style
Comprehensive medical physiology poster: GUYTON Ch.21 PART 1 — "Blood Flow in Skeletal Muscles & Regulation During Exercise". Dark navy background. Dense, color-coded, all text legible, professional medical notes poster. TOP HEADER: "Ch.21 — SKELETAL MUSCLE BLOOD FLOW & EXERCISE" bold white. Subtitle: "Guyton & Hall | Regulation at Rest & During Exercise" in yellow. === SECTION 1: SKELETAL MUSCLE BLOOD FLOW — BASELINE DATA (LEFT, blue) === Header: "SKELETAL MUSCLE BLOOD FLOW VALUES" in blue KEY VALUES TABLE: Condition | Flow (mL/min/100g) | Total Body Muscle Flow AT REST | 3-4 | ~750 mL/min MODERATE EXERCISE | 20-40 | ~4,000 mL/min STRENUOUS EXERCISE | 100-200 | ~10,000-16,000 mL/min EXTREME ATHLETE (thigh) | up to 400 | ~20,000+ mL/min Resting % of body weight: Skeletal muscle = 30-40% of body mass BUT only 15% of resting CO Exercise: muscle can receive 80-85% of total cardiac output FLOW DURING CONTRACTIONS GRAPH (draw clearly): X-axis: Time during rhythmic exercise (seconds) Y-axis: Blood flow (mL/min/100g) Show PARADOX: During each contraction → flow DECREASES (mechanical compression of vessels) Between contractions → flow INCREASES (reactive hyperemia) After exercise ends → post-exercise hyperemia for a few seconds then returns to normal Annotation: "Tetanic contraction → flow nearly STOPS → rapid muscle fatigue" Annotation: "Rhythmic exercise is more efficient (pumping action)" CAPILLARY RECRUITMENT DIAGRAM: Two cross-sections of muscle side by side: LEFT (REST): Show only 20-30% of capillaries open (grey = closed, red = open) RIGHT (EXERCISE): ALL capillaries open (all red) Label: "Capillary surface area increases 2-3 fold during exercise" Label: "Diffusion distance from capillary to mitochondria DECREASES" === SECTION 2: CONTROL OF SKELETAL MUSCLE BLOOD FLOW (CENTER, orange) === Header: "MECHANISMS CONTROLLING SKELETAL MUSCLE BLOOD FLOW" in orange A. LOCAL METABOLIC CONTROL (PRIMARY — 80-85% of control): Flowchart: ↑ Muscle contraction → ↑ Metabolic rate → rapid consumption of: ↓ VASODILATOR SUBSTANCES RELEASED (list in colored boxes): • O₂ DEFICIENCY (most important) → vessel relaxation → vasodilation • ADENOSINE (from ATP → AMP → adenosine) → most studied vasodilator • CO₂ excess → vasodilation • H⁺ ions (lactic acid) → vasodilation • K⁺ ions (leak from active muscle fibers) • NITRIC OXIDE (NO) → released by endothelium under shear stress + hypoxia • Prostacyclin (PGI₂) → from endothelium • Bradykinin ↓ ALL act on arterioles → SMOOTH MUSCLE RELAXATION → VASODILATION ↓ ↑ Blood flow → restores O₂, removes metabolites NOTE BOX: "Adenosine alone cannot account for all muscle vasodilation — multiple factors act synergistically" B. SYMPATHETIC NERVOUS SYSTEM (secondary/initial role): During exercise initiation → ANTICIPATORY signal from motor cortex + hypothalamus → SNS activation → Causes INITIAL arteriolar constriction in muscle (redistributes blood) → QUICKLY OVERCOME by local metabolic vasodilation as exercise continues → Net effect during sustained exercise: VASODILATION in active muscles C. SYMPATHETIC VASODILATION SYSTEM (in some species): Sympathetic fibers to skeletal muscle vasculature that release ACh (cats) or activate β2 (primates) → Used in ANTICIPATORY vasodilation before exercise begins → Activated by emotional/anticipatory states D. TEMPERATURE: ↑ Local muscle temperature → VASODILATION → Increases during exercise → contributes to hyperemia === SECTION 3: INTEGRATED CARDIOVASCULAR RESPONSE TO EXERCISE (RIGHT, multi-color) === Header: "CARDIOVASCULAR RESPONSE TO EXERCISE — COMPLETE" in green LARGE TABLE — All cardiovascular parameters: Parameter | Rest | Moderate Exercise | Strenuous Exercise | Trained Athlete Max CO (L/min) | 5 | 10-12 | 20-25 | 35-40 HR (bpm) | 70 | 100-120 | 160-180 | 190-200 SV (mL) | 70 | 100 | 150 | 200 MAP (mmHg) | 93 | 100-110 | 120-130 | 130-140 TPR (PRU) | ~19 | ~10 | ~5 | ~3-4 Muscle blood flow | 750 mL/min | 4,000 | 16,000 | 20,000+ Skin blood flow | Low | ↑ (thermoregulation) | ↑↑ | ↑↑ Splanchnic/Renal | 1400/1100 mL/min | ↓↓ | ↓↓↓ | ↓↓↓ BLOOD REDISTRIBUTION PIE CHARTS: Two circles side by side: REST: Brain 14%, Kidney 22%, Liver 27%, Muscle 15%, Heart 4%, Other 18% EXERCISE: Muscle 80-85%, Heart 5%, Brain 4%, Skin 5%, Kidney+Liver 5% Show dramatic shift of blood to muscles during exercise === SECTION 4: NERVOUS CONTROL DURING EXERCISE (LEFT BOTTOM, purple) === Header: "NERVOUS SYSTEM ROLE IN EXERCISE" in purple MECHANISM: Cerebral motor cortex fires → Motor signals to muscles SIMULTANEOUSLY with: → Hypothalamus → vasomotor center → ↑ SNS Effect 1: ↑ HR + ↑ contractility (before muscle even starts contracting = anticipatory tachycardia) Effect 2: Vasoconstriction in non-exercising beds (splanchnic, renal, skin initially) Effect 3: Redistribution → more blood available for muscles Effect 4: SNS → venoconstriction → ↑ venous return → ↑ Psf → ↑ CO (Frank-Starling) WHY MAP only rises moderately despite huge ↑ CO: CO increases 4-5× → MASSIVE vasodilation in muscles → ↓↓ TPR → largely offsets ↑CO Net: MAP rises only modestly (93 → 120-130 mmHg) === BOTTOM — OXYGEN DELIVERY COMPARISON === O₂ DELIVERY AT REST: 5 L/min × 200 mL O₂/L = 1000 mL O₂/min; consumption = 250 mL/min O₂ DELIVERY IN EXERCISE: 25 L/min × 200 mL O₂/L = 5000 mL O₂/min; consumption up to 3500-4000 mL/min O₂ EXTRACTION at rest: 25% (arteriovenous O₂ difference = 5 mL/100 mL) O₂ EXTRACTION in exercise: 80-85% (AV diff = 14-15 mL/100 mL) Color-coded, all graphs with axes, professional physiology poster style
Comprehensive medical physiology poster: GUYTON Ch.21 PART 2 — "Coronary Circulation, Coronary Blood Flow Regulation, Myocardial Infarction & Angina Pectoris". Dark navy background. Dense, color-coded, professional medical notes poster, all text legible. TOP HEADER: "Ch.21 — CORONARY CIRCULATION & CARDIAC ISCHEMIA" bold white. Subtitle: "Guyton & Hall | Coronary Flow, MI, Angina & Heart Attack" in yellow. === SECTION 1: CORONARY ANATOMY (LEFT, blue) === Header: "CORONARY ARTERY ANATOMY" in blue HEART DIAGRAM (anterior view showing coronary arteries): Draw a simple heart with labeled coronary arteries: LEFT CORONARY ARTERY (LCA) → divides into: - LEFT ANTERIOR DESCENDING (LAD) — "Widow Maker" Supplies: Anterior LV wall, anterior 2/3 of septum, apex - LEFT CIRCUMFLEX (LCx) Supplies: Lateral + posterior LV, left atrium, SA node (40%) RIGHT CORONARY ARTERY (RCA): Supplies: Right ventricle, inferior/posterior LV, AV node (90%), SA node (60%) → Posterior Descending Artery (PDA) in right-dominant circulation (85% of people) DOMINANCE TABLE: Right dominant: 85% — RCA gives PDA Left dominant: 8% — LCx gives PDA Co-dominant: 7% CORONARY FLOW VALUES: At rest: 225-250 mL/min = 4-5% of CO (for organ = 0.4% body weight) O₂ extraction at rest: 70% (highest of any organ) During maximal exercise: up to 1000-1200 mL/min (4-5× resting) Coronary reserve = max flow / resting flow = ~4-5× === SECTION 2: PHASIC CORONARY BLOOD FLOW (CENTER TOP, orange) === Header: "PHASIC NATURE OF CORONARY FLOW — KEY CONCEPT" in orange GRAPH — Phasic Coronary Flow vs Cardiac Cycle: X-axis: Time (one cardiac cycle: systole + diastole labeled) Y-axis: Coronary Blood Flow (mL/min) TWO CURVES on same graph: LEFT CORONARY (LCA) — shown in RED: - During SYSTOLE: Flow DECREASES sharply (near zero in subendocardium) - During DIASTOLE: Flow HIGH (most LCA flow occurs during diastole) - Reason: LV contraction compresses intramural vessels at 120+ mmHg - Subendocardium most vulnerable: compressed from BOTH sides (cavity + wall pressure) RIGHT CORONARY (RCA) — shown in BLUE: - Flow occurs in BOTH systole and diastole (RV pressure lower, less compression) - More constant throughout cycle LABELS: "LCA predominantly DIASTOLIC flow" "Tachycardia → shorter diastole → ↓ coronary filling time → ISCHEMIA RISK" "Coronary perfusion pressure = Diastolic BP − LVEDP" EPICARDIAL vs SUBENDOCARDIAL DIAGRAM: Cross-section of LV wall showing: - Epicardial arteries: outer surface, large, less compressed during systole → can flow in systole - Intramuscular arteries: penetrate from epicardial inward - Subendocardial plexus: inner surface, MOST compressed during systole - Extra vessels in subendocardium compensate for systolic compression - But in disease: subendocardium most vulnerable to ischemia (subendocardial MI) === SECTION 3: CONTROL OF CORONARY BLOOD FLOW (CENTER MIDDLE, green) === Header: "REGULATION OF CORONARY BLOOD FLOW" in green PRIMARY: LOCAL METABOLIC CONTROL Pathway: ↑ Cardiac work → ↑ O₂ demand → ↑ ATP consumption → ↓ O₂ + ↑ metabolites ↓ ADENOSINE (main mediator): Low O₂ → ATP → ADP → AMP → ADENOSINE → Adenosine → A₂A receptors on coronary smooth muscle → VASODILATION → ↑ flow → After vasodilation: adenosine reabsorbed by cardiac cells → ATP recycled Other vasodilators: CO₂, H⁺, K⁺, NO, prostacyclin, bradykinin AUTONOMIC NERVOUS SYSTEM (secondary): SNS (sympathetic) → α1 → mild coronary constriction BUT: Epinephrine → β2 → coronary DILATION in active heart (functional) AND: Increased HR + contractility → ↑ O₂ demand → LOCAL METABOLIC OVERRIDE of any constriction Vagal (parasympathetic): direct mild dilation + ↓ HR → less O₂ demand CORONARY RESERVE DIAGRAM: Bar chart: Resting flow = 250 mL/min (baseline bar) Maximum flow = 1000 mL/min (full bar) Coronary reserve = space between (4×) In CAD: Resting flow maintained but max reduces → narrowed reserve → exercise triggers ischemia === SECTION 4: MYOCARDIAL INFARCTION (RIGHT, red) === Header: "ACUTE MYOCARDIAL INFARCTION" in red ZONES OF ISCHEMIA DIAGRAM: Draw heart cross-section showing concentric zones: Central: ZONE OF INFARCTION — cells DIE within 20-40 min (no O₂) Middle: ZONE OF INJURY — non-functional, viable if reperfused Outer: ZONE OF ISCHEMIA — viable, may fully recover TIMELINE OF MI: Immediate (0-20 min): Anaerobic metabolism → lactic acid → K⁺ leaks → arrhythmias 20-40 min: IRREVERSIBLE INJURY begins if no reperfusion 1-3 hrs: Central muscle fibers die Days 1-3: Marginal fiber necrosis extends; free wall weakest (RUPTURE RISK: peak days 3-7) Weeks: Fibrous tissue replaces dead cells (scar formation); collateral vessels develop Months-years: Scar contracts; aneurysm may persist COMPLICATIONS OF MI (colored list): ARRHYTHMIAS: K⁺ leak → ↓ resting potential → automaticity → VF (most common cause of early death) HEART FAILURE: Extensive infarction → ↓ contractility → CARDIOGENIC SHOCK CARDIAC TAMPONADE: Rupture → blood in pericardium → external compression → ↓ CO → death VENTRICULAR ANEURYSM: Systolic bulging of thin infarcted wall PAPILLARY MUSCLE RUPTURE: Acute mitral regurgitation CARDIOGENIC SHOCK VICIOUS CYCLE (flowchart): ↓ CO → ↓ Coronary perfusion → More ischemia → ↓ CO (self-perpetuating) === SECTION 5: ANGINA PECTORIS (BOTTOM, purple) === Header: "ANGINA PECTORIS" in purple DEFINITION: Chest pain due to ISCHEMIA — insufficient coronary blood flow relative to myocardial demand MECHANISM: Ischemia → Adenosine, bradykinin, substance P → Stimulate cardiac C-fiber pain endings → T1-T4 sympathetic fibers → Spinal cord → Thalamus → Cortex REFERRED PAIN via T1-T4: Left chest, left arm (inner aspect), jaw, neck, epigastrium THREE TYPES TABLE: Type | Trigger | ECG | Coronary artery STABLE ANGINA | Exertion; relieved by rest/nitrates | ST depression | Fixed atherosclerotic plaque (>70% stenosis) UNSTABLE ANGINA | Rest pain; crescendo pattern | ST depression/elevation | Unstable plaque rupture (partial occlusion) PRINZMETAL/VARIANT | Rest; nocturnal; cyclic | ST ELEVATION | Coronary artery SPASM (on normal or diseased vessel) TREATMENT BOX: NITRATES: Venodilation → ↓ preload → ↓ O₂ demand; also coronary dilation BETA-BLOCKERS: ↓ HR + ↓ contractility → ↓ O₂ demand CALCIUM CHANNEL BLOCKERS: Vasodilation + ↓ contractility PCI (Angioplasty + Stent): Restores flow in culprit lesion CABG (Bypass surgery): For multi-vessel disease BOTTOM KEY FACTS BAR (yellow): Coronary O₂ extraction 70% at rest → CANNOT increase much → blood flow MUST increase to meet ↑ demand Subendocardium most vulnerable to ischemia (compressed from two sides + distal end of coronary supply) 70% stenosis → adequate flow at rest → symptomatic on exercise = STABLE ANGINA 90% stenosis → inadequate flow even at rest = REST PAIN Professional physiology poster, all diagrams labeled, all graphs with axes, color-coded
📘 CHAPTER 18 — Nervous Regulation of Circulation
POSTER 1 — Autonomic NS, Vasomotor Center & Sympathetic Control
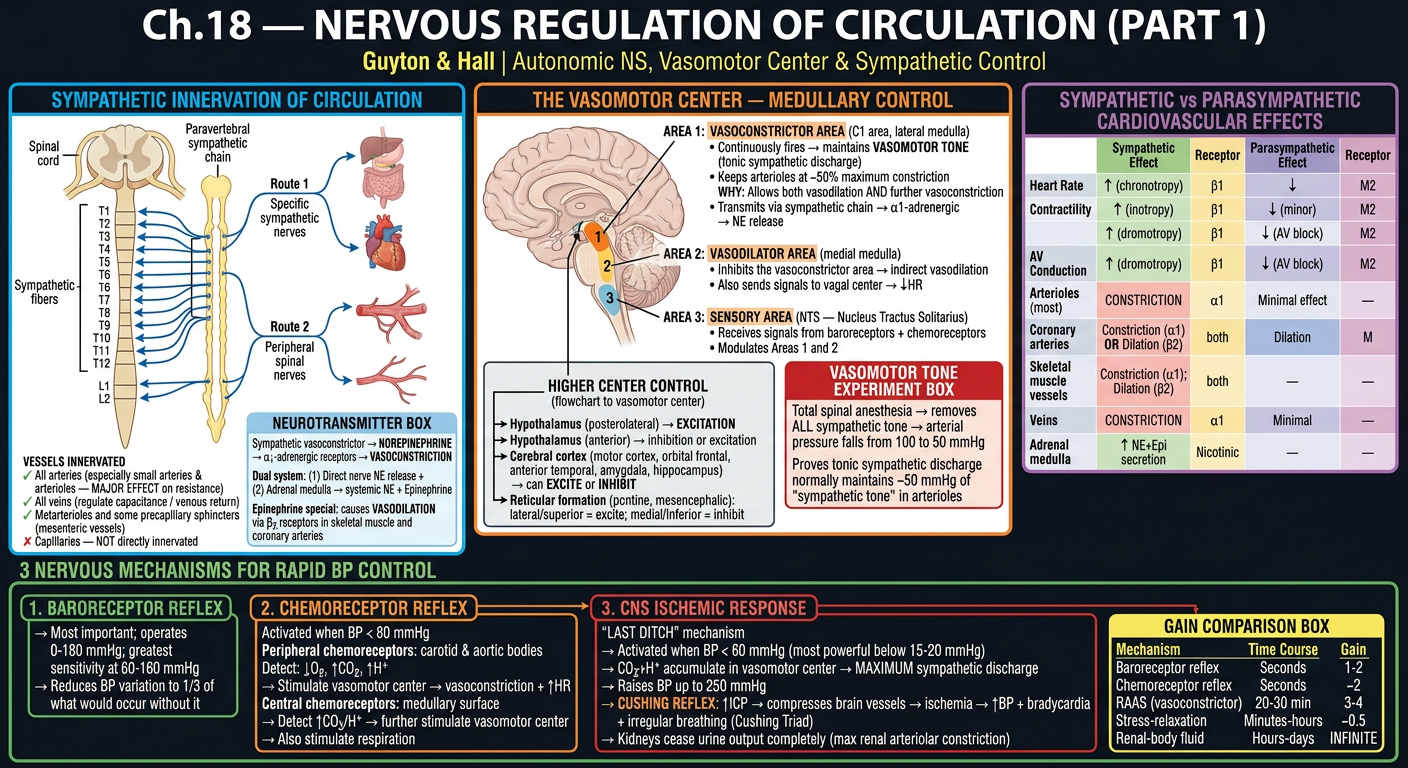
- Sympathetic fiber origin: T1-L2 spinal nerves → sympathetic chain → 2 routes to circulation
- Vessels innervated (all except capillaries) vs NOT innervated (capillaries)
- NE → α1 (vasoconstriction); Epi → β2 (vasodilation in muscle/coronary)
- Vasomotor Center — 3 areas: Vasoconstrictor (C1, lateral), Vasodilator (medial), Sensory (NTS)
- Vasomotor Tone: ~50 mmHg maintained by tonic discharge; abolished by spinal anesthesia
- Higher center control: Hypothalamus, Cortex, Reticular formation
- SNS vs PNS cardiovascular effects full comparison table
- 3 rapid BP control mechanisms with GAIN comparison table
POSTER 2 — Baroreflexes, Chemoreflexes, Atrial Reflexes & Vasomotor Waves
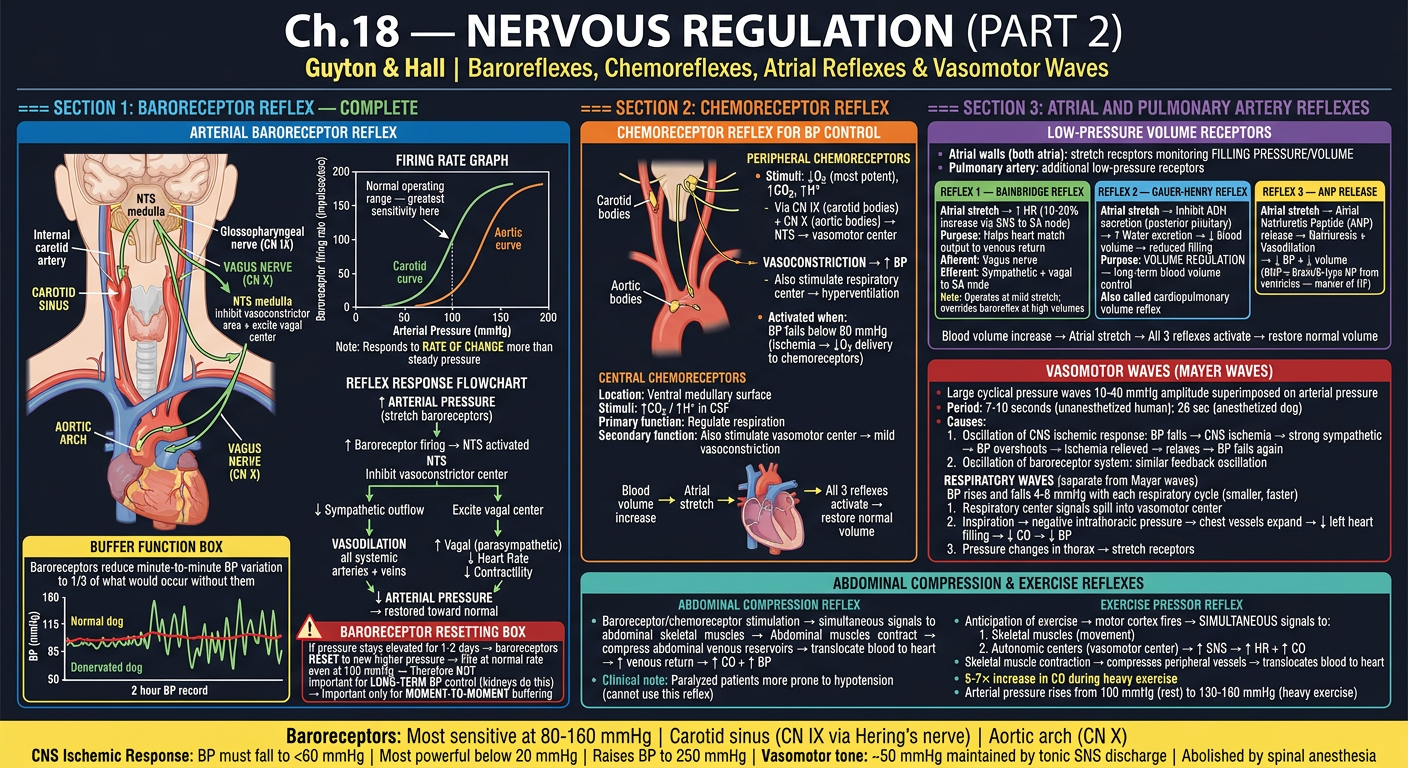
- Carotid sinus (CN IX via Hering's nerve) + Aortic arch (CN X via Vagus) anatomy
- Baroreceptor firing rate graph (50-180 mmHg range, steepest at 80-150 mmHg)
- Full baroreflex pathway: ↑BP → NTS → inhibit vasoconstrictor + excite vagal → normalization
- Baroreceptor resetting in 1-2 days (why it's NOT for long-term control)
- BP variability comparison: Normal vs Denervated dog (1/3 vs 2.5× wider)
- Chemoreceptor reflex: peripheral (carotid/aortic bodies, CN IX/X) + central (medullary)
- Atrial reflexes: Bainbridge reflex (+10-20% HR), Gauer-Henry reflex (ADH inhibition), ANP release
- Vasomotor/Mayer waves (7-10 sec cycle); Respiratory waves (4-6 mmHg, cause 3 mechanisms)
- Abdominal compression reflex + Exercise pressor reflex
📗 CHAPTER 21 — Exercise Blood Flow & Coronary Circulation
POSTER 3 — Skeletal Muscle Blood Flow & Exercise Cardiovascular Response
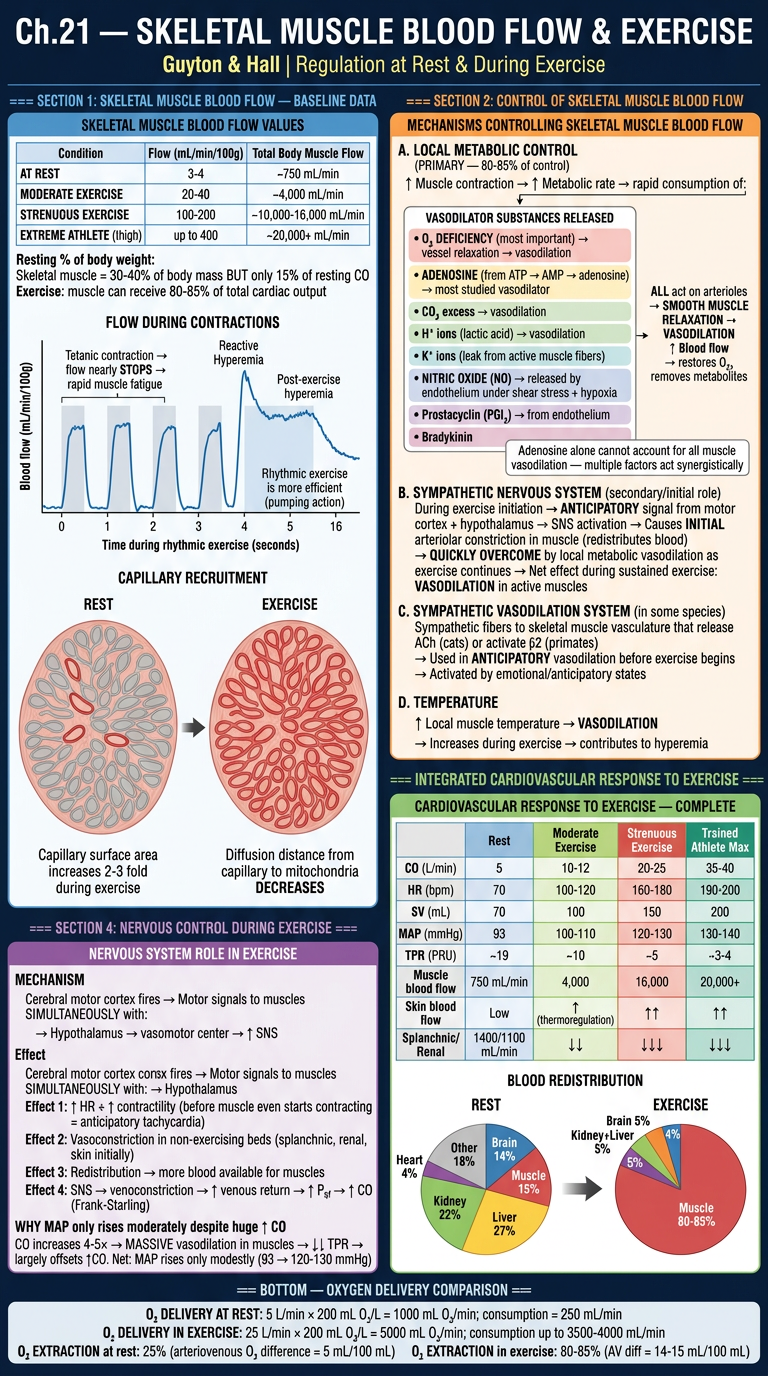
- Flow values table: Rest 3-4 → Moderate → Athlete max 400 mL/min/100g
- Flow paradox during contraction (decrease during contraction, increase between) with graph
- Capillary recruitment: 20-30% open at rest → ALL open during exercise (surface area 2-3×)
- Local metabolic control (primary): O₂ deficiency, adenosine, CO₂, H⁺, K⁺, NO, prostacyclin
- Sympathetic control: anticipatory vasoconstriction → overcome by metabolic vasodilation
- Blood redistribution pie charts: Rest vs Exercise (muscle gets 80-85%)
- Full exercise cardiovascular response table (CO, HR, SV, MAP, TPR at all intensities)
- O₂ extraction comparison: Rest 25% → Exercise 80-85%
POSTER 4 — Coronary Circulation, MI Zones, Complications & Angina Pectoris
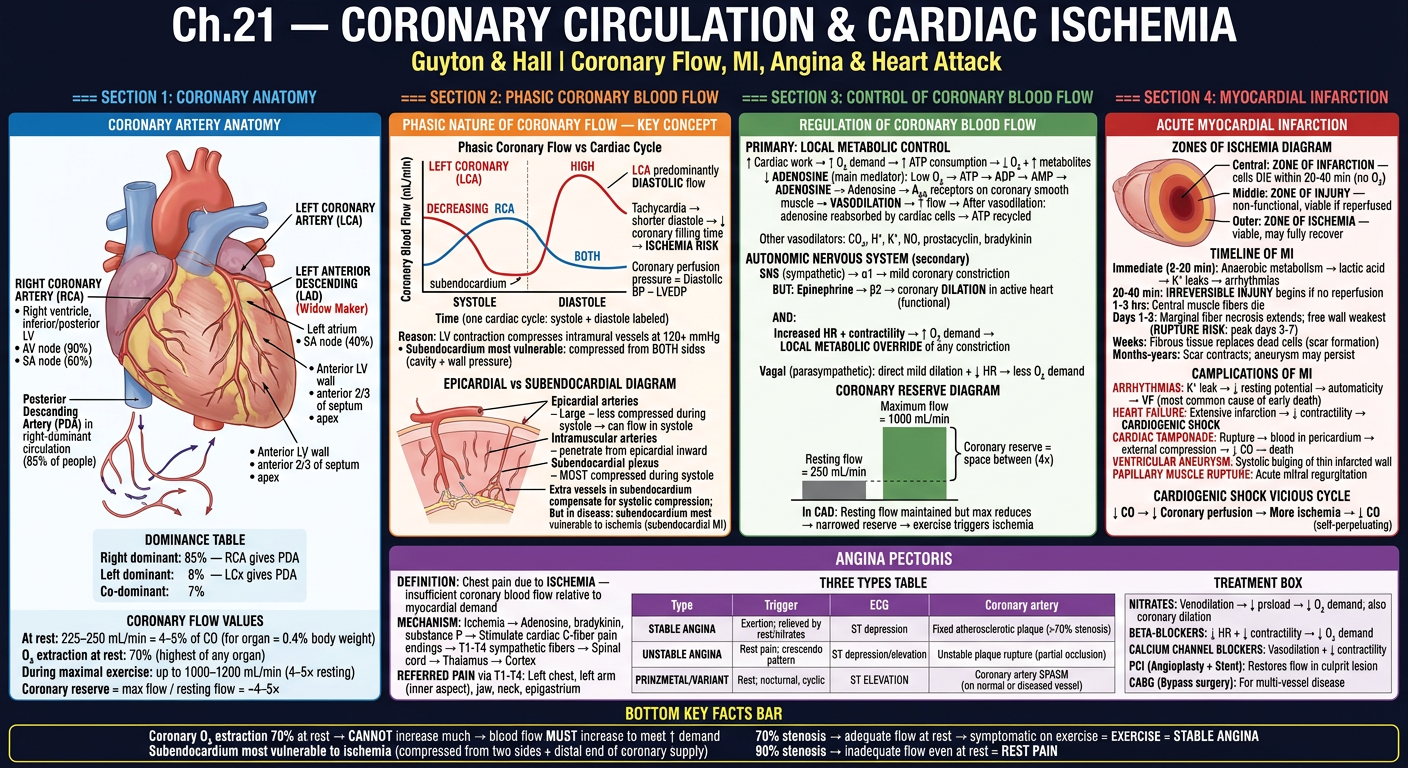
- Full coronary anatomy: LCA (LAD + LCx) + RCA with territories and dominance table
- Phasic coronary flow graph: LCA predominantly diastolic; RCA both phases — WHY explained
- Epicardial vs subendocardial layers + vulnerability to ischemia
- Coronary reserve: ~4-5× (250 → 1000 mL/min); reserve narrows in CAD
- Adenosine pathway: ATP → ADP → AMP → Adenosine → A₂A → vasodilation → recycled
- MI zones (infarction/injury/ischemia), MI timeline (minutes to months)
- All MI complications: arrhythmias, HF, tamponade, aneurysm, papillary rupture, cardiogenic shock vicious cycle
- Angina types: Stable (>70% stenosis), Unstable (plaque rupture), Prinzmetal (coronary spasm)
- Referred pain pathway (T1-T4 → left arm/jaw) + Treatment table