
Hypothyroidism ppt Mokshit roll no 68 Clinical features investigation and management
hypothyroidism clinical features myxedema
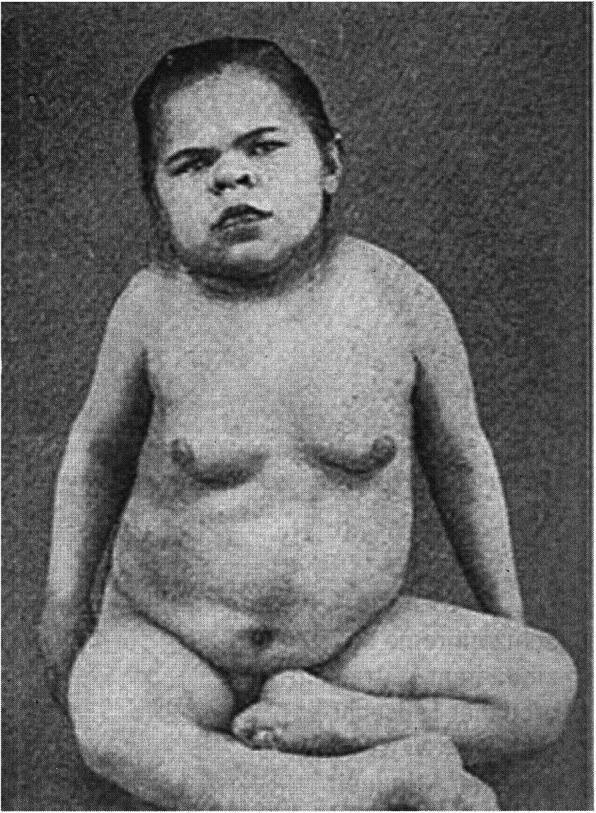
This historical black-and-white clinical photograph depicts a pediatric patient presenting with the classic physical manifestations of severe myxedema due to untreated congenital hypothyroidism. The facial features are characteristic of the condition, including periorbital puffiness (edema), narrowed palpebral fissures, a depressed nasal bridge, and a broad, flattened nose. The lips appear thickened and the tongue may be slightly protruded, typical of macroglossia. The overall body habitus is stocky with a disproportionately short neck and a protuberant abdomen. Significant generalized subcutaneous swelling (myxedema) is evident across the trunk and proximal extremities, giving the skin a thickened, doughy appearance. The patient's posture and seated, cross-legged position reflect the developmental delays and musculoskeletal characteristics associated with prolonged severe thyroid hormone deficiency. This image serves as an educational reference for the systemic and dermatologic signs of primary congenital hypothyroidism and the phenotypic presentation of 'cretinism' as described in historical medical literature.
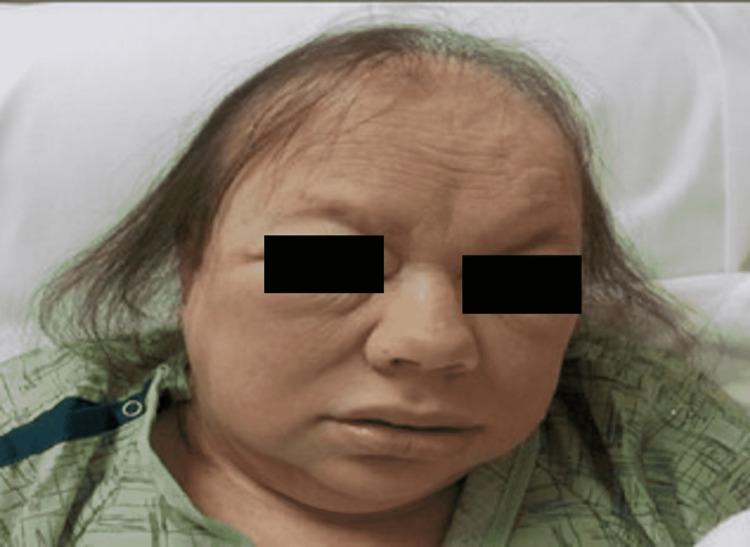
A clinical photograph of a patient's face and head, demonstrating classic features of myxedematous facies associated with severe hypothyroidism or myxedema coma. The patient exhibits generalized facial puffiness and non-pitting edema, particularly prominent in the periorbital and cheek regions. The skin appears pale, thickened, and somewhat waxy with visible forehead wrinkling. Significant dermatological findings include diffuse thinning of the scalp hair (alopecia) and the characteristic loss of the outer third of the eyebrows (Madarosis). The overall facial expression is dull or apathetic, which is typical for this metabolic state. This image serves as an educational reference for identifying the systemic physical manifestations of advanced thyroid hormone deficiency in a clinical setting.
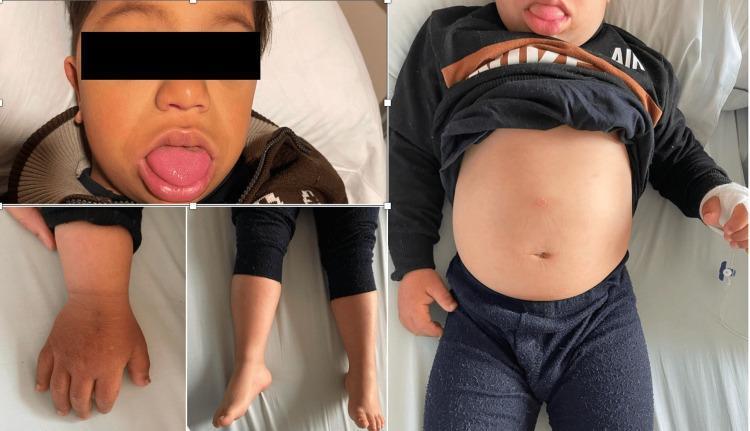
A composite clinical photograph showing physical manifestations of severe hypothyroidism or myxedema in a pediatric patient. The facial view reveals generalized puffiness (myxedematous facies) and a protruding, enlarged tongue (macroglossia). The skin appears dry and slightly thickened. The trunk view demonstrates a markedly distended abdomen, suggestive of ascites or organomegaly related to the metabolic state. Lower extremity images show non-pitting edema and thin legs relative to the central adiposity/distension. A close-up of the hand shows dry, rough skin with mild hyperpigmentation. Collectively, these features illustrate the classic systemic findings of myxedematous infiltration affecting the integumentary and musculoskeletal systems in congenital or early-onset hypothyroidism.
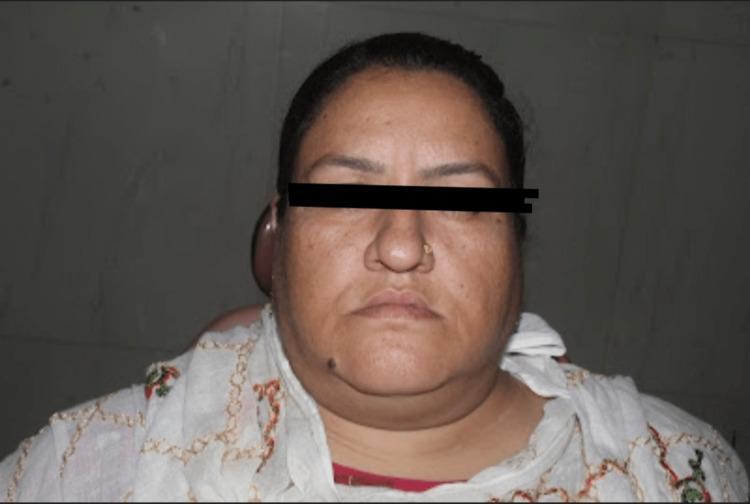
This clinical photograph shows a front-view extraoral assessment of a 38-year-old female patient exhibiting classic signs of facial myxedema and weight gain associated with uncontrolled hypothyroidism. The facial contour is noticeably rounded, presenting a 'moon face' appearance with generalized fullness and obscuration of the underlying bony jawline and malar landmarks. Key visible features include bilateral periorbital puffiness, prominent soft tissue swelling in the cheeks (buccal fat pad region), and increased subcutaneous adipose tissue in the submental and cervical areas, leading to a less defined neck-to-jaw transition. The skin appears somewhat thickened with diffuse hyperpigmentation, particularly across the malar regions. These findings are characteristic clinical manifestations of thyroid dysfunction, reflecting the systemic metabolic effects and mucopolysaccharide deposition in dermal tissues. This visual material serves as an educational reference for identifying secondary systemic symptoms during a dental or general medical examination, specifically in patients with comorbid diabetes mellitus and hypothyroidism.
thyroid function tests TSH T4 investigation hypothyroidism
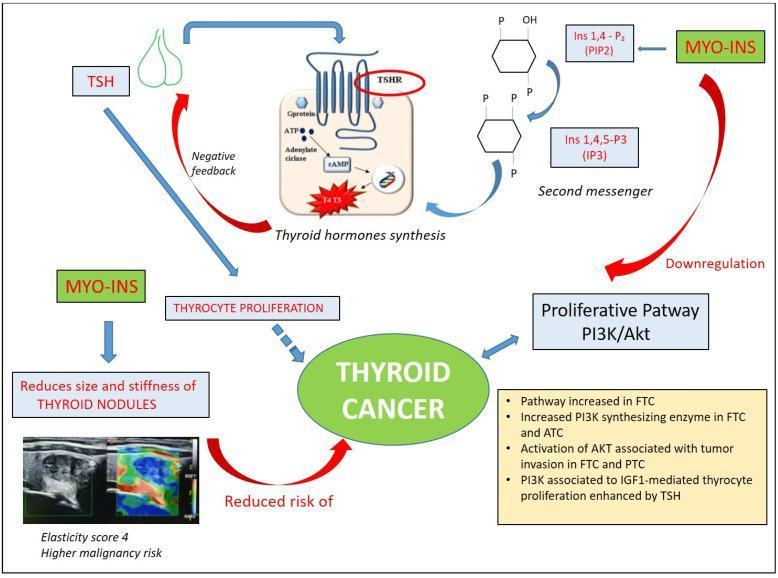
This pathophysiology diagram illustrates the regulatory role of Myo-inositol (MYO-INS) in thyroid function and its protective mechanisms against thyroid cancer. The diagram maps two primary pathways: first, MYO-INS serves as a precursor to phosphoinositide second messengers (PIP2 and IP3), which facilitate thyroid hormone synthesis. Increased T3 and T4 levels then exert negative feedback on TSH secretion, thereby inhibiting TSH-driven thyrocyte proliferation. Second, MYO-INS is shown to downregulate the PI3K/Akt proliferative pathway, which is typically overactive in follicular (FTC), anaplastic (ATC), and papillary thyroid cancer (PTC). A clinical component includes ultrasound elastography images showing a thyroid nodule with high stiffness (Elasticity score 4); the diagram indicates that MYO-INS reduces the size and stiffness of such nodules, ultimately leading to a reduced risk of thyroid cancer. Key molecular elements include TSHR signaling, cAMP, and IGF1-mediated proliferation, highlighting the transition from benign nodules to malignancy.
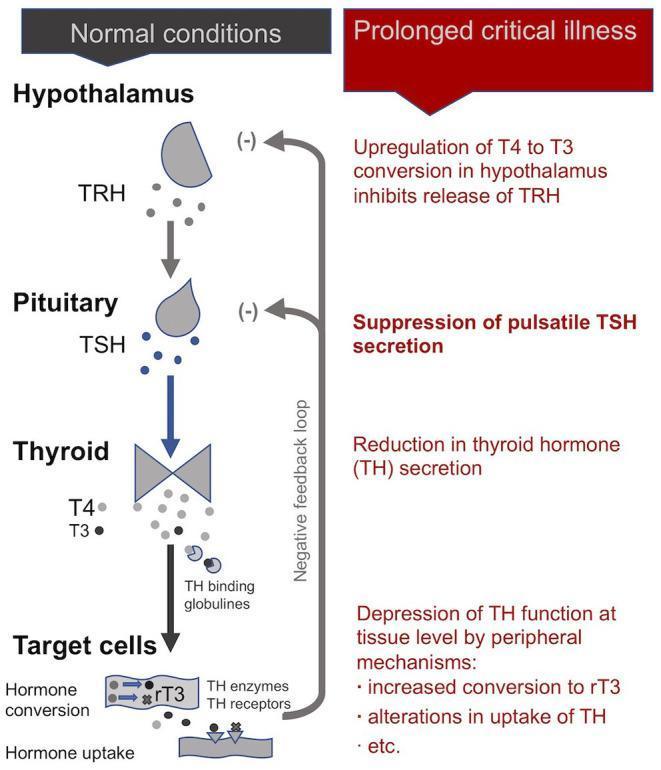
This pathophysiology diagram illustrates the Hypothalamic-Pituitary-Thyroid (HPT) axis, comparing normal physiological conditions with the alterations observed during prolonged critical illness. The 'Normal conditions' section shows the standard cascade: the Hypothalamus secretes TRH, which stimulates the Pituitary to release TSH, leading the Thyroid gland to produce T4 and T3. These hormones reach target cells via TH binding globulins for hormone conversion and uptake, with a negative feedback loop inhibiting TRH and TSH secretion. In contrast, the 'Prolonged critical illness' section details the central and peripheral suppression of the axis. Key pathological features include: upregulation of T4 to T3 conversion in the hypothalamus (inhibiting TRH release), suppression of pulsatile TSH secretion by the pituitary, reduced thyroid hormone secretion, and depression of thyroid function at the tissue level. Peripheral mechanisms shown include increased conversion to inactive rT3 and altered hormone uptake. This comparison illustrates the endocrine maladaptation typical of Non-Thyroidal Illness Syndrome (NTIS) in intensive care settings.

A comparison panel of diagnostic images illustrating molecular and anatomical pituitary imaging in a patient with a TSH-secreting microadenoma (thyrotropinoma). The content displays two rows representing 'Pre-SRL' (somatostatin receptor ligand) and 'Post-SRL' treatment states, featuring coronal T1 spin-echo (SE) MRI, T1 SE with Gadolinium, volumetric fast spoiled gradient recalled echo (FSPGR) MRI, and 11C-methionine PET coregistered with FSPGR MRI (Met-PET/MRCR). While anatomical MRI sequences (T1, +Gad, FSPGR) appear unremarkable and show no structural changes between treatment states, the functional Met-PET/MRCR reveals a distinct, focal radiotracer uptake (intense red/yellow signal) just to the left of the infundibulum insertion. Following SRL therapy, there is a dramatic diminution in radiotracer intensity (shifting to blue), correlating with normalized thyroid function tests (Free T4, Free T3, and TSH values shown in adjacent tables). This comparison highlights the utility of functional PET imaging in localizing occult microadenomas that are not detectable via standard structural MRI.
levothyroxine thyroxine replacement therapy hypothyroidism treatment
![This Comparison Chart consists of two scatter plot panels (a and b) illustrating the variability of laboratory reference ranges for Free Thyroxine (FT4) concentrations in a neonatal and infant cohort following start of levothyroxine (LT4) treatment. The x-axis represents 'Time [day]' and the y-axis represents 'FT4 conc. of reference ranges [pmol/l]'. Panel (a) provides a detailed view of the first 50 days, highlighting significantly elevated and highly variable upper reference limits (grey circles) reaching up to 80 pmol/l in the early postnatal period. Panel (b) shows the total time interval up to 750 days, demonstrating more stable reference distributions over time. In both panels, grey crosses indicate the lower limits of reference ranges, while bold black step-lines represent the age-dependent target reference ranges used for normalization. The visual data emphasizes the heterogeneity of local laboratory standards compared to a unified target range, reflecting center-related and assay-related differences in monitoring thyroid function in congenital hypothyroidism.](https://cdn.orris.care/cdss_images/pmc_clinical_VQA_3c9c648c706d05419727ce9657325eae1aff01127e6da141f64894f4af784f4f.jpg)
This Comparison Chart consists of two scatter plot panels (a and b) illustrating the variability of laboratory reference ranges for Free Thyroxine (FT4) concentrations in a neonatal and infant cohort following start of levothyroxine (LT4) treatment. The x-axis represents 'Time [day]' and the y-axis represents 'FT4 conc. of reference ranges [pmol/l]'. Panel (a) provides a detailed view of the first 50 days, highlighting significantly elevated and highly variable upper reference limits (grey circles) reaching up to 80 pmol/l in the early postnatal period. Panel (b) shows the total time interval up to 750 days, demonstrating more stable reference distributions over time. In both panels, grey crosses indicate the lower limits of reference ranges, while bold black step-lines represent the age-dependent target reference ranges used for normalization. The visual data emphasizes the heterogeneity of local laboratory standards compared to a unified target range, reflecting center-related and assay-related differences in monitoring thyroid function in congenital hypothyroidism.
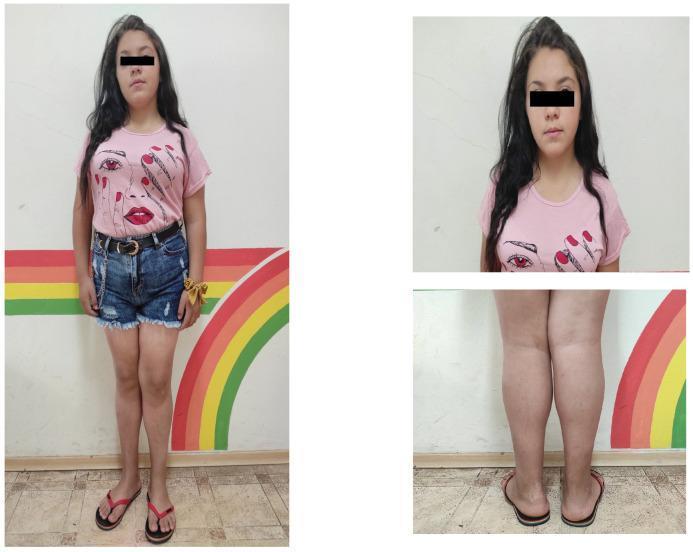
This clinical photograph set shows a pediatric female patient following one year of L-thyroxine replacement therapy for Kocher-Debre-Semelaigne syndrome (KDSS), a rare manifestation of juvenile hypothyroidism. The image consists of a full-body standing view, a close-up of the face, and a detailed posterior-anterior view of the lower legs. Visually, the patient demonstrates a significant reduction in overall body mass and waist circumference compared to baseline. A key clinical feature documented is the resolution of muscular pseudohypertrophy, particularly in the bilateral gastrocnemius muscles (calves), which now appear proportional rather than pathologically enlarged. The facial view shows a softening of previously 'rough' features, with less prominent macroglossia and thick lips. The images illustrate the physical reversibility of the myopathic and metabolic symptoms of severe hypothyroidism through hormonal optimization. These visual findings are essential for medical students studying endocrine myopathies and the physical manifestations of childhood thyroid deficiency.
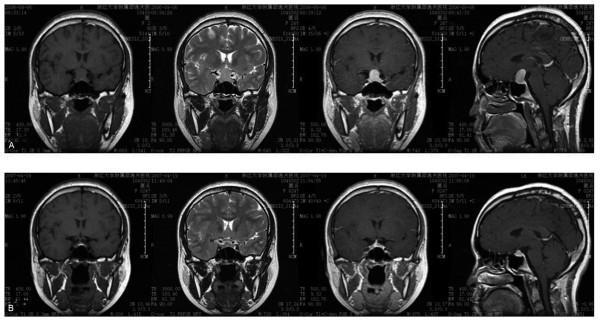
This diagnostic image set consists of brain MRI scans in coronal and sagittal planes, comparing the pituitary region before (A) and after (B) thyroxine treatment for primary hypothyroidism. Row A (Pre-treatment) displays a markedly enlarged, hyperintense pituitary gland (compensatory pituitary hyperplasia) within the sella turcica. The enlarged gland demonstrates upward expansion, resulting in displacement and compression of the optic chiasm and pituitary stalk. Row B (Post-treatment) shows the same anatomical regions after hormone replacement therapy, illustrating a significant reduction in pituitary volume. The gland has returned to a near-normal size and configuration, with restoration of the suprasellar cistern and relief of compression on the optic chiasm. This comparison illustrates the reversible nature of pituitary hypertrophy secondary to untreated primary hypothyroidism, where lack of negative feedback by thyroid hormones leads to TSH-secreting cell hyperplasia. The imaging supports a diagnosis of reactive pituitary enlargement rather than a primary adenoma.
mkdir -p /tmp/workspace/hypothyroidism-ppt && ls /tmp/workspace/hypothyroidism-ppt/
~/hypothyroidism-ppt/create_pptx.py
import json, subprocess, base64
from io import BytesIO
from pptx import Presentation
from pptx.util import Inches, Pt, Emu
from pptx.dml.color import RGBColor
from pptx.enum.text import PP_ALIGN, MSO_ANCHOR
from pptx.oxml.ns import qn
from lxml import etree

# ── Colour palette ──────────────────────────────────────────────────────────
DEEP_BLUE   = RGBColor(0x00, 0x33, 0x66)
MID_BLUE    = RGBColor(0x00, 0x5B, 0x96)
ACCENT_TEAL = RGBColor(0x00, 0x89, 0x9E)
LIGHT_BLUE  = RGBColor(0xCF, 0xE2, 0xF3)
WHITE       = RGBColor(0xFF, 0xFF, 0xFF)
DARK_GRAY   = RGBColor(0x33, 0x33, 0x33)
MEDIUM_GRAY = RGBColor(0x66, 0x66, 0x66)
YELLOW_ACC  = RGBColor(0xFF, 0xD7, 0x00)
GREEN_ACC   = RGBColor(0x27, 0xAE, 0x60)
RED_ACC     = RGBColor(0xC0, 0x39, 0x2B)
ORANGE_ACC  = RGBColor(0xE6, 0x7E, 0x22)

prs = Presentation()
prs.slide_width  = Inches(13.333)
prs.slide_height = Inches(7.5)
blank = prs.slide_layouts[6]

# ── Helper functions ─────────────────────────────────────────────────────────

def add_rect(slide, x, y, w, h, fill_rgb=None, line_rgb=None, line_width_pt=0):
    shape = slide.shapes.add_shape(1, Inches(x), Inches(y), Inches(w), Inches(h))
    if fill_rgb:
        shape.fill.solid()
        shape.fill.fore_color.rgb = fill_rgb
    else:
        shape.fill.background()
    if line_rgb and line_width_pt > 0:
        shape.line.color.rgb = line_rgb
        shape.line.width = Pt(line_width_pt)
    else:
        shape.line.fill.background()
    return shape

def add_text(slide, text, x, y, w, h, font_size=14, bold=False, color=DARK_GRAY,
             align=PP_ALIGN.LEFT, italic=False, v_anchor=MSO_ANCHOR.TOP,
             wrap=True, font_name="Calibri"):
    tb = slide.shapes.add_textbox(Inches(x), Inches(y), Inches(w), Inches(h))
    tf = tb.text_frame
    tf.word_wrap = wrap
    tf.vertical_anchor = v_anchor
    tf.margin_left = Pt(4)
    tf.margin_right = Pt(4)
    tf.margin_top = Pt(2)
    tf.margin_bottom = Pt(2)
    p = tf.paragraphs[0]
    p.alignment = align
    run = p.add_run()
    run.text = text
    run.font.size = Pt(font_size)
    run.font.bold = bold
    run.font.italic = italic
    run.font.color.rgb = color
    run.font.name = font_name
    return tf

def add_bullet_box(slide, title, bullets, x, y, w, h,
                   title_bg=MID_BLUE, title_color=WHITE,
                   body_bg=LIGHT_BLUE, bullet_color=DARK_GRAY,
                   title_size=13, bullet_size=11, icon="•"):
    # title bar
    add_rect(slide, x, y, w, 0.38, fill_rgb=title_bg)
    add_text(slide, title, x+0.08, y+0.02, w-0.16, 0.34,
             font_size=title_size, bold=True, color=title_color,
             align=PP_ALIGN.LEFT, v_anchor=MSO_ANCHOR.MIDDLE)
    # body
    add_rect(slide, x, y+0.38, w, h-0.38, fill_rgb=body_bg)
    tb = slide.shapes.add_textbox(Inches(x+0.1), Inches(y+0.42),
                                   Inches(w-0.2), Inches(h-0.5))
    tf = tb.text_frame
    tf.word_wrap = True
    first = True
    for b in bullets:
        if first:
            p = tf.paragraphs[0]
            first = False
        else:
            p = tf.add_paragraph()
        p.space_before = Pt(3)
        run = p.add_run()
        run.text = f"{icon}  {b}"
        run.font.size = Pt(bullet_size)
        run.font.color.rgb = bullet_color
        run.font.name = "Calibri"

def add_divider(slide, x, y, w, color=ACCENT_TEAL, thickness_pt=2):
    line = slide.shapes.add_shape(1, Inches(x), Inches(y), Inches(w), Pt(thickness_pt))
    line.fill.solid()
    line.fill.fore_color.rgb = color
    line.line.fill.background()

def slide_header(slide, title, subtitle=None):
    # top bar
    add_rect(slide, 0, 0, 13.333, 1.1, fill_rgb=DEEP_BLUE)
    add_text(slide, title, 0.3, 0.08, 12.7, 0.65, font_size=28, bold=True,
             color=WHITE, align=PP_ALIGN.LEFT, v_anchor=MSO_ANCHOR.MIDDLE)
    if subtitle:
        add_text(slide, subtitle, 0.3, 0.68, 12.7, 0.38, font_size=14,
                 color=LIGHT_BLUE, align=PP_ALIGN.LEFT)
    add_rect(slide, 0, 1.1, 13.333, 0.05, fill_rgb=ACCENT_TEAL)

def footer(slide, page_num):
    add_rect(slide, 0, 7.2, 13.333, 0.3, fill_rgb=DEEP_BLUE)
    add_text(slide, "Hypothyroidism | Mokshit | Roll No. 68", 0.2, 7.22, 10, 0.26,
             font_size=9, color=LIGHT_BLUE, align=PP_ALIGN.LEFT)
    add_text(slide, str(page_num), 12.8, 7.22, 0.5, 0.26, font_size=9,
             color=WHITE, align=PP_ALIGN.RIGHT)

# ════════════════════════════════════════════════════════════════════════════
# SLIDE 1  –  TITLE SLIDE
# ════════════════════════════════════════════════════════════════════════════
s1 = prs.slides.add_slide(blank)
# gradient-feel background using two rectangles
add_rect(s1, 0, 0, 13.333, 7.5, fill_rgb=DEEP_BLUE)
add_rect(s1, 0, 4.5, 13.333, 3.0, fill_rgb=MID_BLUE)
add_rect(s1, 0, 4.48, 13.333, 0.06, fill_rgb=ACCENT_TEAL)

# decorative circle accent
circle = s1.shapes.add_shape(9, Inches(9.8), Inches(0.5), Inches(4.5), Inches(4.5))
circle.fill.solid()
circle.fill.fore_color.rgb = RGBColor(0x00, 0x4E, 0x8A)
circle.line.fill.background()

# title text
add_text(s1, "HYPOTHYROIDISM", 0.6, 1.4, 9.0, 1.3, font_size=48, bold=True,
         color=WHITE, align=PP_ALIGN.LEFT)
add_text(s1, "Clinical Features, Investigations & Management",
         0.6, 2.75, 9.5, 0.7, font_size=22, italic=True,
         color=LIGHT_BLUE, align=PP_ALIGN.LEFT)
add_rect(s1, 0.6, 3.55, 5.0, 0.06, fill_rgb=YELLOW_ACC)

add_text(s1, "Presented by:  Mokshit", 0.6, 3.75, 7.0, 0.45,
         font_size=16, bold=True, color=WHITE)
add_text(s1, "Roll No. 68", 0.6, 4.22, 4.0, 0.38, font_size=14, color=LIGHT_BLUE)

# bottom tagline
add_text(s1, "\"A hypometabolic state resulting from insufficient circulating thyroid hormone\"",
         0.6, 5.2, 12.0, 0.7, font_size=14, italic=True, color=WHITE)

# ════════════════════════════════════════════════════════════════════════════
# SLIDE 2  –  OVERVIEW / DEFINITION
# ════════════════════════════════════════════════════════════════════════════
s2 = prs.slides.add_slide(blank)
add_rect(s2, 0, 0, 13.333, 7.5, fill_rgb=RGBColor(0xF5, 0xF8, 0xFD))
slide_header(s2, "What is Hypothyroidism?", "Definition & Epidemiology")
footer(s2, 2)

# Definition card
add_rect(s2, 0.3, 1.25, 8.2, 1.5, fill_rgb=WHITE, line_rgb=MID_BLUE, line_width_pt=1.5)
add_text(s2, "Definition", 0.4, 1.27, 3.0, 0.38, font_size=11, bold=True, color=MID_BLUE)
add_text(s2,
    "A hypometabolic state resulting from levels of circulating thyroid hormone insufficient "
    "to meet body requirements. Serum TSH > 10 mIU/L (can exceed 25 mIU/L in protracted cases).",
    0.4, 1.62, 8.0, 1.0, font_size=12, color=DARK_GRAY)

# Key facts boxes
facts = [
    ("Most Common\nCause (USA)", "Hashimoto\nThyroiditis\n(Autoimmune)", MID_BLUE),
    ("Most Common\nCause (World)", "Iodine\nDeficiency", ACCENT_TEAL),
    ("Sex Ratio", "Female :\nMale\n= 10–14 : 1", ORANGE_ACC),
    ("Peak Age", "5th Decade\nof Life", GREEN_ACC),
]
for i, (title, val, col) in enumerate(facts):
    bx = 0.3 + i * 3.05
    add_rect(s2, bx, 2.95, 2.85, 1.7, fill_rgb=col)
    add_text(s2, title, bx+0.1, 3.0, 2.65, 0.5, font_size=11, bold=True,
             color=WHITE, align=PP_ALIGN.CENTER)
    add_text(s2, val, bx+0.1, 3.52, 2.65, 1.0, font_size=13, bold=True,
             color=WHITE, align=PP_ALIGN.CENTER, v_anchor=MSO_ANCHOR.MIDDLE)

# Classification
add_rect(s2, 0.3, 4.82, 12.7, 0.38, fill_rgb=DEEP_BLUE)
add_text(s2, "Classification of Hypothyroidism", 0.5, 4.84, 12.0, 0.34,
         font_size=12, bold=True, color=WHITE)
class_items = [
    ("Primary", "Thyroid gland failure (most common)\nHashimoto, iodine deficiency, post-surgical, post-radiation"),
    ("Secondary", "Pituitary failure → low TSH + low FT4\nRare; evaluate for pan-hypopituitarism"),
    ("Tertiary", "Hypothalamic failure → low TRH\nVery rare"),
    ("Transient", "Postpartum / subacute thyroiditis\nUsually resolves in 3–6 months"),
]
for i, (label, desc) in enumerate(class_items):
    bx = 0.3 + i * 3.2
    add_rect(s2, bx, 5.22, 3.0, 1.7, fill_rgb=LIGHT_BLUE, line_rgb=MID_BLUE, line_width_pt=0.8)
    add_text(s2, label, bx+0.08, 5.25, 2.84, 0.35, font_size=11, bold=True, color=MID_BLUE)
    add_text(s2, desc, bx+0.08, 5.58, 2.84, 1.3, font_size=9.5, color=DARK_GRAY)

# ════════════════════════════════════════════════════════════════════════════
# SLIDE 3  –  CAUSES / AETIOLOGY
# ════════════════════════════════════════════════════════════════════════════
s3 = prs.slides.add_slide(blank)
add_rect(s3, 0, 0, 13.333, 7.5, fill_rgb=RGBColor(0xF5, 0xF8, 0xFD))
slide_header(s3, "Aetiology of Hypothyroidism", "Causes & Risk Factors")
footer(s3, 3)

causes = {
    "Autoimmune": [
        "Hashimoto thyroiditis (most common in developed world)",
        "Atrophic thyroiditis",
        "Postpartum thyroiditis",
    ],
    "Iatrogenic": [
        "Thyroidectomy (total/subtotal)",
        "Radioiodine (131I) therapy",
        "External neck radiation (head & neck cancer)",
        "Drugs: lithium, amiodarone, interferon-alpha",
    ],
    "Iodine-related": [
        "Dietary iodine deficiency (leading cause worldwide)",
        "Excess iodine — Wolff-Chaikoff effect",
    ],
    "Infiltrative/Other": [
        "Riedel thyroiditis (fibrous replacement)",
        "Sarcoidosis, amyloidosis of thyroid",
        "Haemochromatosis",
        "Congenital (thyroid dysgenesis, dyshormonogenesis)",
    ],
    "Central (rare)": [
        "Pituitary failure → secondary hypothyroidism",
        "Hypothalamic disease → tertiary hypothyroidism",
        "TRH receptor mutations",
    ],
}

cols = list(causes.items())
positions = [
    (0.25, 1.22, 4.0),
    (4.45, 1.22, 4.0),
    (8.65, 1.22, 4.4),
    (0.25, 3.9,  6.1),
    (6.55, 3.9,  6.5),
]
colors_boxes = [MID_BLUE, ACCENT_TEAL, ORANGE_ACC, GREEN_ACC, RED_ACC]
for i, (title, items) in enumerate(cols):
    x, y, w = positions[i]
    h = 2.5
    add_bullet_box(s3, title, items, x, y, w, h,
                   title_bg=colors_boxes[i], body_bg=LIGHT_BLUE,
                   title_size=12, bullet_size=10)

# ════════════════════════════════════════════════════════════════════════════
# SLIDE 4  –  CLINICAL FEATURES (General / Systemic)
# ════════════════════════════════════════════════════════════════════════════
s4 = prs.slides.add_slide(blank)
add_rect(s4, 0, 0, 13.333, 7.5, fill_rgb=RGBColor(0xF5, 0xF8, 0xFD))
slide_header(s4, "Clinical Features", "Symptoms of Hypothyroidism")
footer(s4, 4)

symptom_groups = [
    ("General / Metabolic", MID_BLUE, [
        "Fatigue & lethargy",
        "Weight gain despite poor appetite",
        "Cold intolerance",
        "Hypothermia",
        "Slow speech & movements",
    ]),
    ("Skin & Appendages", ACCENT_TEAL, [
        "Dry, coarse, pale/yellowish skin",
        "Non-pitting myxoedema (periorbital, hands, feet)",
        "Loss of outer 1/3 of eyebrows (Hertoghe sign)",
        "Brittle nails, diffuse hair loss",
        "Puffy face (myxoedematous facies)",
    ]),
    ("Cardiovascular", RED_ACC, [
        "Bradycardia",
        "Pericardial effusion",
        "Hypertension (diastolic)",
        "Cardiomegaly on CXR",
        "Raised cholesterol → atherosclerosis",
    ]),
    ("Neurological / Psychiatric", ORANGE_ACC, [
        "Impaired memory & concentration",
        "Depression, psychosis ('myxoedema madness')",
        "Carpal tunnel syndrome",
        "Delayed relaxation of deep tendon reflexes",
        "Cerebellar ataxia (in severe cases)",
    ]),
    ("Reproductive / GI", GREEN_ACC, [
        "Menorrhagia / anovulation / infertility",
        "Galactorrhoea (elevated prolactin)",
        "Constipation",
        "Macroglossia",
        "Ascites (rare, severe)",
    ]),
    ("Musculoskeletal", RGBColor(0x6C, 0x3A, 0x83), [
        "Myalgia & muscle cramps",
        "Proximal myopathy",
        "Pseudohypertrophy of calf muscles (Kocher-Debre-Semelaigne in children)",
        "Arthralgia / synovial effusions",
    ]),
]

# 2 rows × 3 columns
positions4 = [
    (0.2, 1.22, 4.2, 2.85),
    (4.55, 1.22, 4.2, 2.85),
    (8.9, 1.22, 4.2, 2.85),
    (0.2, 4.22, 4.2, 2.85),
    (4.55, 4.22, 4.2, 2.85),
    (8.9, 4.22, 4.2, 2.85),
]
for (title, col, items), (x, y, w, h) in zip(symptom_groups, positions4):
    add_bullet_box(s4, title, items, x, y, w, h,
                   title_bg=col, body_bg=WHITE,
                   bullet_color=DARK_GRAY, title_size=11, bullet_size=9.5)

# ════════════════════════════════════════════════════════════════════════════
# SLIDE 5  –  MYXOEDEMA COMA (special feature)
# ════════════════════════════════════════════════════════════════════════════
s5 = prs.slides.add_slide(blank)
add_rect(s5, 0, 0, 13.333, 7.5, fill_rgb=RGBColor(0xF5, 0xF8, 0xFD))
slide_header(s5, "Myxoedema Coma", "Severe / Life-Threatening Hypothyroidism")
footer(s5, 5)

add_rect(s5, 0.25, 1.22, 12.8, 0.55, fill_rgb=RED_ACC)
add_text(s5, "⚠  Medical Emergency — High Mortality (up to 30–40% even with treatment)",
         0.4, 1.27, 12.5, 0.45, font_size=13, bold=True, color=WHITE, align=PP_ALIGN.CENTER)

# Precipitants
add_bullet_box(s5, "Precipitating Factors", [
    "Infection (most common) — pneumonia, UTI, sepsis",
    "Cold exposure / hypothermia",
    "Surgery, trauma, major illness",
    "CNS depressants: opiates, sedatives, anaesthetics",
    "Stopping thyroid medication",
    "Stroke, heart failure",
], 0.25, 1.9, 6.0, 2.7, title_bg=DEEP_BLUE, body_bg=LIGHT_BLUE, title_size=12, bullet_size=10)

# Features
add_bullet_box(s5, "Clinical Features", [
    "Depressed consciousness → coma",
    "Hypothermia (<35°C)",
    "Bradycardia & hypotension",
    "Respiratory failure / hypoventilation (CO2 retention)",
    "Hyponatraemia (dilutional)",
    "Hypoglycaemia",
    "Seizures",
    "Myxoedematous facies, dry skin, macroglossia",
], 6.45, 1.9, 6.6, 2.7, title_bg=RED_ACC, body_bg=RGBColor(0xFF, 0xEA, 0xE8), title_size=12, bullet_size=10)

# Management
add_rect(s5, 0.25, 4.75, 12.8, 0.38, fill_rgb=DEEP_BLUE)
add_text(s5, "Emergency Management of Myxoedema Coma", 0.4, 4.77, 12.5, 0.34,
         font_size=12, bold=True, color=WHITE)
mgmt = [
    ("IV T4 (L-thyroxine)", "200–400 µg IV loading → 1.6 µg/kg/day", MID_BLUE),
    ("IV T3 (liothyronine)", "5–20 µg IV q8h (faster acting; use cautiously in elderly/IHD)", ACCENT_TEAL),
    ("IV Hydrocortisone", "100 mg q8h until adrenal insufficiency excluded", ORANGE_ACC),
    ("Supportive Care", "Rewarming, IV fluids, intubation/ventilation, treat precipitant", GREEN_ACC),
]
for i, (label, desc, col) in enumerate(mgmt):
    bx = 0.25 + i * 3.25
    add_rect(s5, bx, 5.22, 3.05, 1.9, fill_rgb=LIGHT_BLUE, line_rgb=col, line_width_pt=2)
    add_text(s5, label, bx+0.08, 5.25, 2.89, 0.38, font_size=11, bold=True, color=col)
    add_text(s5, desc, bx+0.08, 5.62, 2.89, 1.44, font_size=10, color=DARK_GRAY)

# ════════════════════════════════════════════════════════════════════════════
# SLIDE 6  –  INVESTIGATIONS
# ════════════════════════════════════════════════════════════════════════════
s6 = prs.slides.add_slide(blank)
add_rect(s6, 0, 0, 13.333, 7.5, fill_rgb=RGBColor(0xF5, 0xF8, 0xFD))
slide_header(s6, "Investigations", "Confirming & Classifying Hypothyroidism")
footer(s6, 6)

# Step 1 – Thyroid function tests table
add_rect(s6, 0.25, 1.22, 12.8, 0.38, fill_rgb=DEEP_BLUE)
add_text(s6, "Step 1 — Thyroid Function Tests (TFTs)", 0.4, 1.24, 12.5, 0.34,
         font_size=13, bold=True, color=WHITE)

headers = ["Type", "TSH", "Free T4", "Free T3", "Comment"]
col_w   = [2.2, 1.8, 1.8, 1.8, 4.9]
start_x = 0.25
row_y   = 1.67

# header row
add_rect(s6, start_x, row_y, 12.8, 0.38, fill_rgb=MID_BLUE)
cx = start_x
for h, cw in zip(headers, col_w):
    add_text(s6, h, cx+0.05, row_y+0.03, cw-0.1, 0.32, font_size=10.5, bold=True,
             color=WHITE, align=PP_ALIGN.CENTER)
    cx += cw

rows = [
    ("Primary Hypothyroid",   "↑↑",   "↓",  "↓ / N", "Most common; compensatory TSH rise"),
    ("Subclinical Hypothyroid","↑",   "Normal","Normal","Asymptomatic; treat if TSH >10 or symptomatic"),
    ("Secondary (Pituitary)", "↓ / N","↓",  "↓",      "Low/normal TSH with low FT4 — check pituitary"),
    ("Sick Euthyroid (NTI)",  "N / ↓","N",  "↓↓",     "Low T3, normal/low TSH in critical illness"),
]
alt_bg = [WHITE, LIGHT_BLUE]
for ri, row in enumerate(rows):
    ry = row_y + 0.38 + ri * 0.42
    add_rect(s6, start_x, ry, 12.8, 0.42, fill_rgb=alt_bg[ri % 2])
    cx = start_x
    for val, cw in zip(row, col_w):
        add_text(s6, val, cx+0.05, ry+0.04, cw-0.1, 0.34, font_size=10,
                 color=DARK_GRAY, align=PP_ALIGN.CENTER)
        cx += cw

# Step 2 – Further investigations
add_rect(s6, 0.25, 3.98, 12.8, 0.38, fill_rgb=ACCENT_TEAL)
add_text(s6, "Step 2 — Further Investigations", 0.4, 4.0, 12.5, 0.34,
         font_size=13, bold=True, color=WHITE)

inv_boxes = [
    ("Antibodies (Autoimmune)", MID_BLUE, [
        "TPO antibodies (anti-thyroid peroxidase) — primary test for Hashimoto",
        "Anti-thyroglobulin antibodies (Tg Abs)",
        "TSH receptor antibodies (if Graves excluded needed)",
    ]),
    ("Imaging", ACCENT_TEAL, [
        "Thyroid ultrasound — assess size, echo-texture, nodules",
        "Technetium scan / I-131 uptake — if nodule/malignancy suspected",
        "MRI pituitary — if central hypothyroidism suspected",
    ]),
    ("Routine Bloods", ORANGE_ACC, [
        "FBC — normocytic/macrocytic anaemia",
        "Lipid profile — elevated LDL & total cholesterol",
        "CK — elevated in myopathy",
        "Serum Na — hyponatraemia (SIADH-like)",
        "Blood glucose — hypoglycaemia (severe)",
        "Serum prolactin — may be raised",
        "ECG — bradycardia, low voltage, prolonged QT",
        "CXR/Echo — pericardial effusion, cardiomegaly",
    ]),
]
inv_pos = [(0.25, 4.44, 4.1, 2.75), (4.5, 4.44, 4.1, 2.75), (8.75, 4.44, 4.35, 2.75)]
for (title, col, items), (x, y, w, h) in zip(inv_boxes, inv_pos):
    add_bullet_box(s6, title, items, x, y, w, h,
                   title_bg=col, body_bg=WHITE, title_size=11, bullet_size=9.5)

# ════════════════════════════════════════════════════════════════════════════
# SLIDE 7  –  MANAGEMENT OVERVIEW
# ════════════════════════════════════════════════════════════════════════════
s7 = prs.slides.add_slide(blank)
add_rect(s7, 0, 0, 13.333, 7.5, fill_rgb=RGBColor(0xF5, 0xF8, 0xFD))
slide_header(s7, "Management", "Levothyroxine Replacement Therapy")
footer(s7, 7)

# Drug of choice banner
add_rect(s7, 0.25, 1.22, 12.8, 0.5, fill_rgb=GREEN_ACC)
add_text(s7, "Drug of Choice:  L-Thyroxine (Levothyroxine, LT4)  —  Average replacement dose: 1.6 µg/kg/day",
         0.4, 1.25, 12.5, 0.44, font_size=14, bold=True, color=WHITE, align=PP_ALIGN.CENTER)

# Dosing algorithm
add_rect(s7, 0.25, 1.85, 12.8, 0.38, fill_rgb=DEEP_BLUE)
add_text(s7, "Dosing by Patient Profile", 0.4, 1.87, 12.5, 0.34, font_size=12, bold=True, color=WHITE)

patient_profiles = [
    ("Young Healthy\nAdult", "Start at full\nreplacement dose\n1.6 µg/kg/day", GREEN_ACC),
    ("Age >50–60 y,\nNo CAD", "Start 50 µg/day\nIncrease by 25–50 µg\nevery 1–2 weeks", MID_BLUE),
    ("Elderly /\nKnown CAD", "Start 12.5–25 µg/day\nIncrease very slowly\nevery 2–3 weeks", RED_ACC),
    ("Pregnancy", "Increase dose\nby ~30–50%\nMonitor TSH monthly", ORANGE_ACC),
    ("Myxoedema\nComa", "IV LT4 200–400 µg\n+ IV T3\n+ IV hydrocortisone", RGBColor(0x6C, 0x3A, 0x83)),
]
for i, (label, dose, col) in enumerate(patient_profiles):
    bx = 0.25 + i * 2.6
    add_rect(s7, bx, 2.32, 2.45, 1.85, fill_rgb=col)
    add_text(s7, label, bx+0.08, 2.36, 2.29, 0.52, font_size=11, bold=True,
             color=WHITE, align=PP_ALIGN.CENTER)
    add_text(s7, dose, bx+0.08, 2.9, 2.29, 1.22, font_size=11,
             color=WHITE, align=PP_ALIGN.CENTER, v_anchor=MSO_ANCHOR.MIDDLE)

# Monitoring
add_rect(s7, 0.25, 4.3, 6.2, 0.38, fill_rgb=ACCENT_TEAL)
add_text(s7, "Monitoring", 0.4, 4.32, 6.0, 0.34, font_size=12, bold=True, color=WHITE)
monitoring = [
    "Check serum TSH every 4–6 weeks after dose change",
    "Target TSH: 0.5–4.5 mIU/L (mean ~2.5 mIU/L)",
    "Avoid TSH <0.1 mIU/L (iatrogenic hyperthyroidism risk)",
    "Once stable: annual TSH check sufficient",
    "If symptoms persist with normal TSH → consider T3 or combined T4+T3 therapy",
    "Adjust dose in pregnancy, weight changes, malabsorption",
]
tb7 = slide.shapes if False else None
tb7 = s7.shapes.add_textbox(Inches(0.35), Inches(4.75), Inches(6.0), Inches(2.4))
tf7 = tb7.text_frame
tf7.word_wrap = True
for idx, item in enumerate(monitoring):
    p = tf7.paragraphs[0] if idx == 0 else tf7.add_paragraph()
    p.space_before = Pt(3)
    run = p.add_run()
    run.text = f"✓  {item}"
    run.font.size = Pt(10)
    run.font.color.rgb = DARK_GRAY
    run.font.name = "Calibri"

# Drug interactions
add_rect(s7, 6.65, 4.3, 6.4, 0.38, fill_rgb=ORANGE_ACC)
add_text(s7, "Drug Interactions & Absorption Notes", 6.8, 4.32, 6.2, 0.34,
         font_size=12, bold=True, color=WHITE)
drug_int = [
    "Take on empty stomach, 30–60 min before food",
    "Calcium, iron, antacids — reduce absorption",
    "Cholestyramine, sucralfate — impair absorption",
    "Rifampicin, phenytoin — increase T4 clearance → need higher dose",
    "Amiodarone — inhibits T4→T3 conversion",
    "Warfarin sensitivity increases → monitor INR",
]
tb7b = s7.shapes.add_textbox(Inches(6.75), Inches(4.75), Inches(6.2), Inches(2.4))
tf7b = tb7b.text_frame
tf7b.word_wrap = True
for idx, item in enumerate(drug_int):
    p = tf7b.paragraphs[0] if idx == 0 else tf7b.add_paragraph()
    p.space_before = Pt(3)
    run = p.add_run()
    run.text = f"▸  {item}"
    run.font.size = Pt(10)
    run.font.color.rgb = DARK_GRAY
    run.font.name = "Calibri"

# ════════════════════════════════════════════════════════════════════════════
# SLIDE 8  –  SPECIAL POPULATIONS
# ════════════════════════════════════════════════════════════════════════════
s8 = prs.slides.add_slide(blank)
add_rect(s8, 0, 0, 13.333, 7.5, fill_rgb=RGBColor(0xF5, 0xF8, 0xFD))
slide_header(s8, "Special Populations", "Congenital • Subclinical • Pregnancy")
footer(s8, 8)

sp_data = [
    ("Congenital Hypothyroidism\n(Cretinism)", DEEP_BLUE, [
        "Incidence: 1 in 2000–4000 births",
        "Cause: thyroid dysgenesis / dyshormonogenesis / iodine deficiency",
        "Features: large tongue, umbilical hernia, hypotonia, jaundice, coarse features",
        "Intellectual disability if untreated → IRREVERSIBLE",
        "Screening: heel-prick TSH at Day 5 (Guthrie test)",
        "Rx: LT4 10–15 µg/kg/day; start within first 2 weeks of life",
    ]),
    ("Subclinical Hypothyroidism", ACCENT_TEAL, [
        "TSH elevated (usually 4–10 mIU/L), FT4 normal",
        "Often asymptomatic; may have subtle symptoms",
        "Treat if: TSH >10, symptomatic, pregnant, or planning pregnancy",
        "Risk of progression to overt hypothyroidism: ~2–5%/year",
        "Monitor TSH every 6–12 months if not treated",
        "Cardiovascular risk: mildly elevated even in subclinical disease",
    ]),
    ("Hypothyroidism in Pregnancy", ORANGE_ACC, [
        "Maternal hypothyroidism → fetal neurodevelopment risk",
        "TSH target: < 2.5 mIU/L in T1; < 3.0 mIU/L in T2/T3",
        "LT4 dose requirement increases ~30–50% from early pregnancy",
        "Monitor TSH every 4–6 weeks throughout pregnancy",
        "Risks if untreated: miscarriage, pre-eclampsia, preterm birth, low IQ in child",
        "Postpartum thyroiditis: hyper phase → hypo phase → may resolve",
    ]),
    ("Hashimoto Thyroiditis", GREEN_ACC, [
        "Most common autoimmune thyroid disease",
        "F:M ratio 10–14:1; peaks in 5th decade",
        "TPO antibodies +ve (primary diagnostic marker)",
        "Ultrasound: heterogeneous echogenicity, pseudo-nodules",
        "Associated with other autoimmune diseases (T1DM, coeliac, vitiligo)",
        "Management: LT4 when overt hypothyroid; monitor if subclinical",
    ]),
]
pos8 = [
    (0.25, 1.22, 6.2, 3.0),
    (6.65, 1.22, 6.4, 3.0),
    (0.25, 4.38, 6.2, 2.85),
    (6.65, 4.38, 6.4, 2.85),
]
for (title, col, items), (x, y, w, h) in zip(sp_data, pos8):
    add_bullet_box(s8, title, items, x, y, w, h,
                   title_bg=col, body_bg=WHITE,
                   title_size=12, bullet_size=10)

# ════════════════════════════════════════════════════════════════════════════
# SLIDE 9  –  SUMMARY
# ════════════════════════════════════════════════════════════════════════════
s9 = prs.slides.add_slide(blank)
add_rect(s9, 0, 0, 13.333, 7.5, fill_rgb=DEEP_BLUE)
add_rect(s9, 0, 4.8, 13.333, 2.7, fill_rgb=MID_BLUE)
add_rect(s9, 0, 4.78, 13.333, 0.06, fill_rgb=YELLOW_ACC)

add_text(s9, "KEY TAKEAWAYS", 0.5, 0.35, 12.0, 0.7, font_size=30, bold=True,
         color=WHITE, align=PP_ALIGN.CENTER)
add_rect(s9, 3.0, 1.12, 7.333, 0.05, fill_rgb=YELLOW_ACC)

summary_points = [
    ("Diagnosis", "TSH is the best screening test; elevated TSH + low FT4 = primary hypothyroidism"),
    ("Commonest cause", "Hashimoto thyroiditis in developed world; iodine deficiency globally"),
    ("Key symptoms", "Fatigue, weight gain, cold intolerance, bradycardia, myxoedema, delayed DTRs"),
    ("Treatment", "Levothyroxine 1.6 µg/kg/day orally; titrate to TSH 0.5–4.5 mIU/L"),
    ("Emergency", "Myxoedema coma — IV LT4 + IV T3 + IV hydrocortisone + ICU support"),
    ("Monitoring", "TSH every 4–6 weeks until stable; then annually"),
]
for i, (key, val) in enumerate(summary_points):
    row_y = 1.28 + i * 0.56
    add_rect(s9, 0.4, row_y, 2.5, 0.44, fill_rgb=ACCENT_TEAL)
    add_text(s9, key, 0.5, row_y+0.03, 2.3, 0.38, font_size=11, bold=True,
             color=WHITE, align=PP_ALIGN.CENTER)
    add_text(s9, val, 3.1, row_y+0.03, 9.8, 0.38, font_size=11, color=LIGHT_BLUE)

add_text(s9, "Presented by: Mokshit  |  Roll No. 68", 0.5, 5.2, 12.0, 0.5,
         font_size=16, bold=True, color=WHITE, align=PP_ALIGN.CENTER)
add_text(s9, "\"Early detection and adequate replacement therapy restore normal metabolic function\"",
         0.5, 5.8, 12.0, 0.6, font_size=13, italic=True,
         color=LIGHT_BLUE, align=PP_ALIGN.CENTER)

# ─── Save ────────────────────────────────────────────────────────────────────
out_path = "/tmp/workspace/hypothyroidism-ppt/Hypothyroidism_Mokshit_Roll68.pptx"
buf = BytesIO()
prs.save(buf)
with open(out_path, "wb") as f:
    f.write(buf.getvalue())
print(f"Saved: {out_path}")
print(f"Slides: {len(prs.slides)}")
cd /tmp/workspace/hypothyroidism-ppt && python create_pptx.py 2>&1
python3 -c " from pptx import Presentation prs = Presentation('/tmp/workspace/hypothyroidism-ppt/Hypothyroidism_Mokshit_Roll68.pptx') for i, slide in enumerate(prs.slides, 1): texts = [] for shape in slide.shapes: if shape.has_text_frame: t = shape.text_frame.text.strip() if t: texts.append(t[:60]) print(f'Slide {i}: {\" | \".join(texts[:3])}') "
Hypothyroidism Mokshit Roll68
Presentation · PPTX
What's inside - 9 slides, professional blue theme
| Slide | Content |
|---|---|
| 1 | Title Slide - Hypothyroidism, Mokshit, Roll No. 68 |
| 2 | Definition & Overview - Definition (TSH >10 mIU/L), epidemiology, 4 key stat boxes, classification (primary/secondary/tertiary/transient) |
| 3 | Aetiology - 5 colour-coded cause boxes: Autoimmune, Iatrogenic, Iodine-related, Infiltrative, Central |
| 4 | Clinical Features - 6 system boxes: General/Metabolic, Skin, Cardiovascular, Neurological, Reproductive/GI, Musculoskeletal |
| 5 | Myxoedema Coma - Emergency alert banner, precipitants, clinical features, 4-step management (IV LT4, IV T3, hydrocortisone, support) |
| 6 | Investigations - TFT interpretation table (primary/subclinical/secondary/NTI), antibodies, imaging, routine bloods |
| 7 | Management - LT4 dosing by patient profile (young adult, >50y, elderly/CAD, pregnancy, myxoedema coma), monitoring targets, drug interactions |
| 8 | Special Populations - Congenital hypothyroidism (cretinism), subclinical, pregnancy, Hashimoto's |
| 9 | Key Takeaways - Summary of 6 core points + closing quote |