
Artificial intelligence in biochemistry, asssignment on this topic, for ellectives 4th year
Choose the assignment format and approximate length. · Which citation style should I use?
artificial intelligence in biochemistry applications drug discovery protein structure metabolomics review
artificial intelligence AND biochemistry
site:deepmind.google/discover/blog AlphaFold protein structure prediction artificial intelligence biology 2024
"artificial intelligence" AND "protein structure prediction"
"machine learning" AND metabolomics
Artificial Intelligence in Biochemistry
Introduction
Types of AI Used in Biochemistry
-
Machine learning (ML): Algorithms learn patterns from labelled data. For example, an ML model can learn to classify a protein as an enzyme or non-enzyme using known protein sequences.
-
Deep learning (DL): A form of ML based on multi-layered neural networks. It is particularly effective for high-dimensional data such as protein sequences, molecular images, and mass spectra.
-
Natural language processing (NLP): AI methods that analyse text. In biochemistry, NLP can scan large numbers of scientific papers to identify relationships among genes, proteins, diseases, and drugs.
-
Generative AI: Models that can create new outputs, such as predicted protein sequences, molecular structures, or possible drug compounds. These systems are becoming useful in protein engineering and drug design.
AI in Protein Structure Prediction
- Identifying active sites in enzymes
- Predicting possible protein-protein interactions
- Understanding the effect of mutations
- Planning mutagenesis experiments
- Finding targets for drug discovery
- Designing proteins with desired functions
AI in Enzyme Engineering
- Developing thermostable enzymes for industrial processes
- Producing enzymes that degrade plastics or pollutants
- Improving enzymes used in biosensors
- Designing enzymes for synthesis of pharmaceuticals
- Modifying metabolic enzymes to increase production of useful biomolecules
AI in Drug Discovery and Biochemical Pharmacology
1. Target identification
2. Virtual screening
3. De novo molecular design
4. Prediction of toxicity and drug properties
AI in Omics and Metabolomics
Genomics and transcriptomics
Proteomics
Metabolomics
AI in Laboratory Automation
- Higher throughput
- Reduced manual errors
- Better data recording
- Faster optimisation of experimental conditions
- Improved reproducibility
Challenges and Ethical Issues
Data quality and bias
Lack of interpretability
Need for experimental validation
Privacy and security
Unequal access
Future Prospects
Conclusion
References
-
EMBL-EBI. Nobel Prize in Chemistry 2024. Accessed September 17, 2026.
-
Varadi M, et al. AlphaFold Protein Structure Database: massively expanding the structural coverage of protein-sequence space with high-accuracy models. Nucleic Acids Research. 2022;50(D1):D439-D444. The AlphaFold database overview provides publicly accessible predicted protein structures.
-
Abramson J, Adler J, Dunger J, et al. Accurate structure prediction of biomolecular interactions with AlphaFold 3. Nature. 2024;630:493-500. Read the AlphaFold 3 paper.
-
Xu Y, Cao L, Chen Y, et al. Integrating machine learning in metabolomics: a path to enhanced diagnostics and data interpretation. Small Methods. 2024. PMID: 38682615.
-
Peng CX, Liang F, Xia YH. Recent advances and challenges in protein structure prediction. Journal of Chemical Information and Modeling. 2024. PMID: 38109487.
Create a presentation on AI applications in biochemistry
AI applications biochemistry AlphaFold protein structure prediction metabolomics drug discovery authoritative sources
"machine learning" AND biochemistry
~/
AlphaFold predicted protein structure molecular model
mass spectrometry metabolomics spectrum diagram
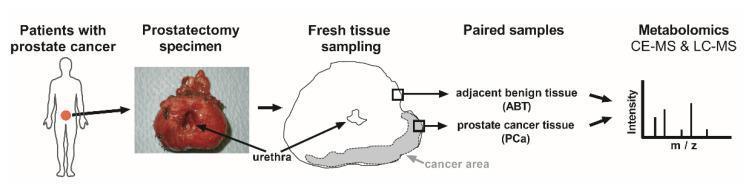
A scientific illustration and clinical photograph summarizing the research workflow for metabolomic analysis of prostate cancer (PCa). The process begins with 'Patients with prostate cancer', represented by a human silhouette. This leads to the 'Prostatectomy specimen', shown via a gross clinical photograph of an excised prostate gland with the central urethra clearly labeled. The next stage, 'Fresh tissue sampling', uses an anatomical diagram of the gland's cross-section to identify a specific shaded 'cancer area'. From this section, 'Paired samples' are extracted: adjacent benign tissue (ABT) and prostate cancer tissue (PCa). The final stage, 'Metabolomics', depicts the analysis of these paired samples using capillary electrophoresis-mass spectrometry (CE-MS) and liquid chromatography-mass spectrometry (LC-MS), represented by a mass spectrum graph showing intensity versus m/z ratio. This workflow illustrates the methodology for comparing metabolite profiles between malignant and benign prostatic tissues to identify biomarkers or metabolic pathways involved in cancer progression.
![Educational medical diagram illustrating metabolomics mass spectrometry (MS) workflows. Section A provides a comparative schematic of two MS2 spectra acquisition methods: All Ion Fragmentation (AIF) and Data-Dependent Acquisition (DDA). The ionization source depicts various molecular species including adducts ([M+Na]+), in-source fragments ([M-H2O+H]+), and dimers ([2M+H]+), where 'M' represents the target metabolite. In AIF, a wide range or no isolation occurs in the quadrupole, leading to multiple ions entering the collision cell and producing a complex, multi-peak raw MS2 spectrum. Conversely, DDA utilizes narrow isolation (few Da) to select specific precursor ions (e.g., [M+H]+), resulting in cleaner MS2 spectra. Section B outlines a professional laboratory workflow for constructing an AMRT+MS2 library. Steps include identifying compounds from biological samples, purchasing chemical standards via InChIKey tracking, preparing stock solutions, and performing LC-MS measurements. The subsequent data processing involves spectral deconvolution (MS2Dec, CorrDec), annotation via MS-FINDER, and library management with MS-LIMA, culminating in data deposition to repositories like MetaboLights or MassBank.](https://cdn.orris.care/cdss_images/pmc_clinical_VQA_54ad1f1880d73fc646aca1a890cdbb29fa7d176b402ac868efcc49f0901b4350.jpg)
Educational medical diagram illustrating metabolomics mass spectrometry (MS) workflows. Section A provides a comparative schematic of two MS2 spectra acquisition methods: All Ion Fragmentation (AIF) and Data-Dependent Acquisition (DDA). The ionization source depicts various molecular species including adducts ([M+Na]+), in-source fragments ([M-H2O+H]+), and dimers ([2M+H]+), where 'M' represents the target metabolite. In AIF, a wide range or no isolation occurs in the quadrupole, leading to multiple ions entering the collision cell and producing a complex, multi-peak raw MS2 spectrum. Conversely, DDA utilizes narrow isolation (few Da) to select specific precursor ions (e.g., [M+H]+), resulting in cleaner MS2 spectra. Section B outlines a professional laboratory workflow for constructing an AMRT+MS2 library. Steps include identifying compounds from biological samples, purchasing chemical standards via InChIKey tracking, preparing stock solutions, and performing LC-MS measurements. The subsequent data processing involves spectral deconvolution (MS2Dec, CorrDec), annotation via MS-FINDER, and library management with MS-LIMA, culminating in data deposition to repositories like MetaboLights or MassBank.
drug discovery molecular docking protein ligand diagram
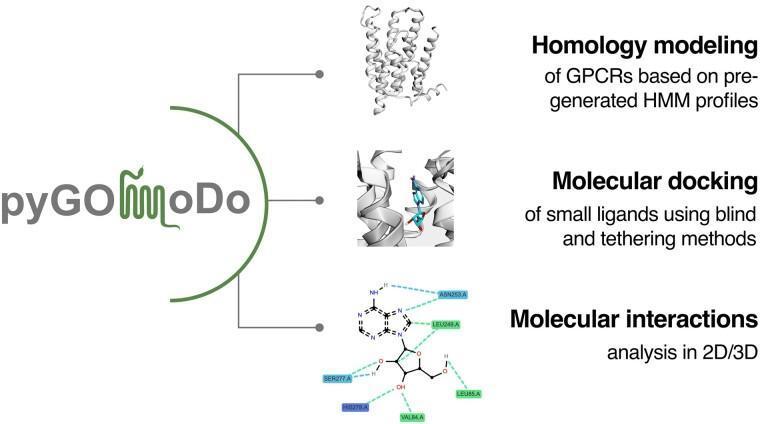
A pathophysiology diagram illustrating the structural bioinformatics pipeline for analyzing G-protein coupled receptors (GPCRs) using the pyGOMoDo software package. The diagram details three primary educational stages of molecular modeling: 1) Homology modeling of GPCRs, shown as a three-dimensional ribbon diagram representing the protein's alpha-helical architecture based on pre-generated HMM profiles; 2) Molecular docking, depicting a small ligand molecule rendered in colored stick representation positioned within the binding pocket of the 3D protein structure using blind and tethering methods; and 3) Molecular interactions analysis, visualized as a two-dimensional chemical schematic. This final stage highlights specific ligand-residue interactions with amino acids such as SER277, ASN253, and VAL84 indicated by dashed lines representing hydrogen bonds or hydrophobic contacts. The image serves as a visual guide for pharmacological research and drug discovery, illustrating the transition from primary sequence alignment to high-resolution mapping of receptor-ligand binding energetics.
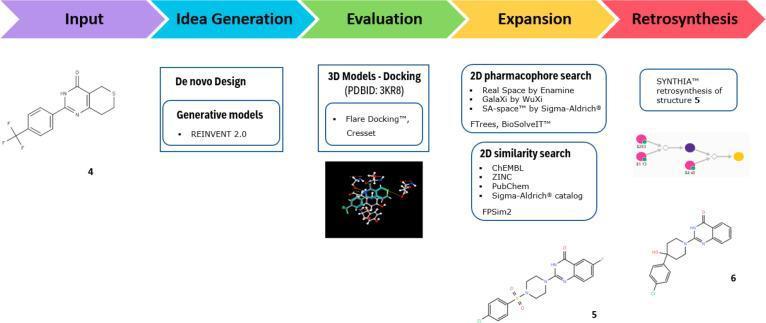
This flowchart depicts the five-stage computational drug discovery and refinement workflow for tankyrase inhibitors. 1) Input: A 2D chemical structure of XAV-939 (structure 4). 2) Idea Generation: Utilizes de novo design and generative models such as REINVENT 2.0. 3) Evaluation: Involves 3D docking models using PDBID 3KR8, Flare Docking, and Cresset; an inset shows a molecular docking visualization of a ligand within a protein binding pocket. 4) Expansion: Employs 2D pharmacophore and similarity searches across databases like Real Space, GalaXi, ChEMBL, and ZINC to identify related scaffolds (structure 5). 5) Retrosynthesis: Uses SYNTHIA software to determine synthetic pathways, illustrated by a node-and-arrow pathway diagram leading to structure 6. This diagram highlights the integration of artificial intelligence and computer-aided drug design (CADD) in pharmacology and medicinal chemistry to accelerate hit identification and lead optimization.
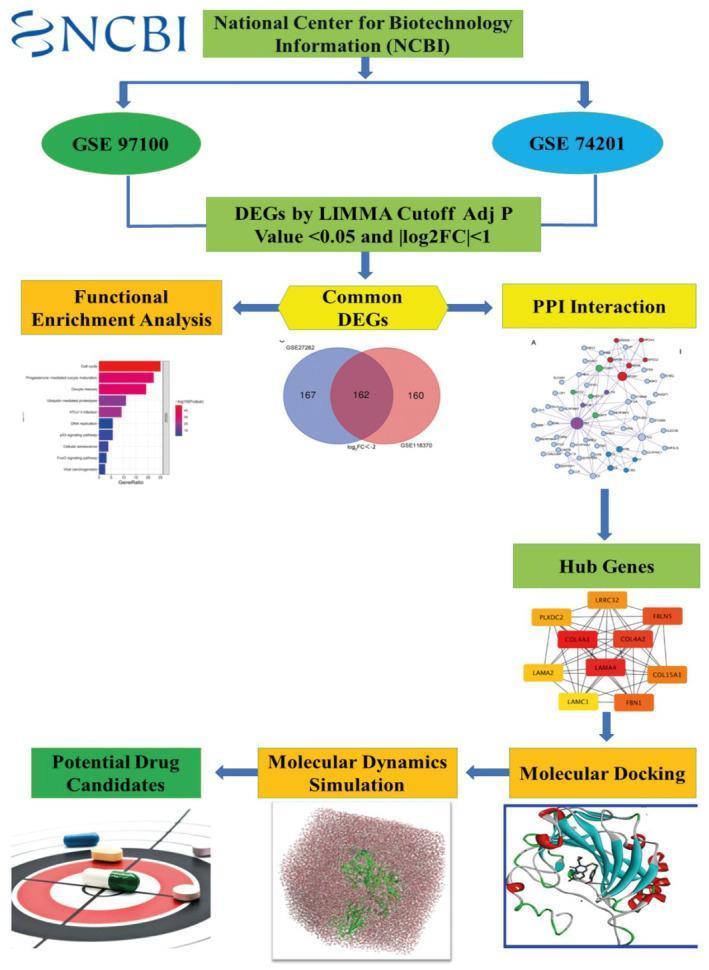
This infographic presents a bioinformatic and computational drug discovery workflow for Huntington's Disease (HD). The flowchart begins with data extraction from the NCBI database, specifically datasets GSE97100 and GSE74201. Differentially Expressed Genes (DEGs) are identified using the LIMMA method with statistical thresholds of an adjusted p-value < 0.05 and |log2FC| < 1. The workflow branches from 'Common DEGs' into two main analytical pathways: Functional Enrichment Analysis (visualized with a gene ratio bar chart for KEGG/Reactome pathways) and Protein-Protein Interaction (PPI) analysis (shown as a complex network diagram). The PPI analysis leads to the identification of 'Hub Genes', specifically emphasizing core nodes like CCN2, LAMA4, and COL4A1. These targets proceed to in-silico validation involving Molecular Docking (depicted with a protein-ligand 3D model) and Molecular Dynamics Simulation (visualized with a solvation box model). The final stage concludes with the identification of 'Potential Drug Candidates' for therapeutic intervention in HD. The diagram effectively illustrates the transition from transcriptomic data to molecular pharmacology.
mkdir -p "/tmp/workspace/ai-biochemistry-presentation/src" "/tmp/workspace/ai-biochemistry-presentation/assets" "/tmp/workspace/ai-biochemistry-presentation/output" && python /tmp/skills/shared/scripts/fetch_images.py "https://cdn.orris.care/cdss_images/pmc_clinical_VQA_54ad1f1880d73fc646aca1a890cdbb29fa7d176b402ac868efcc49f0901b4350.jpg" "https://cdn.orris.care/cdss_images/pmc_clinical_VQA_38ded7dd669d0ff7bb562be488442e6ab61067ec70b6851746385b8e679ed451.jpg" > "/tmp/workspace/ai-biochemistry-presentation/assets/images.json"