
I'm about to appear in neurology DM exam, give me best way to localized spinal cord lesion with proper anatomy from standard textbook
spinal cord cross section anatomy tracts diagram
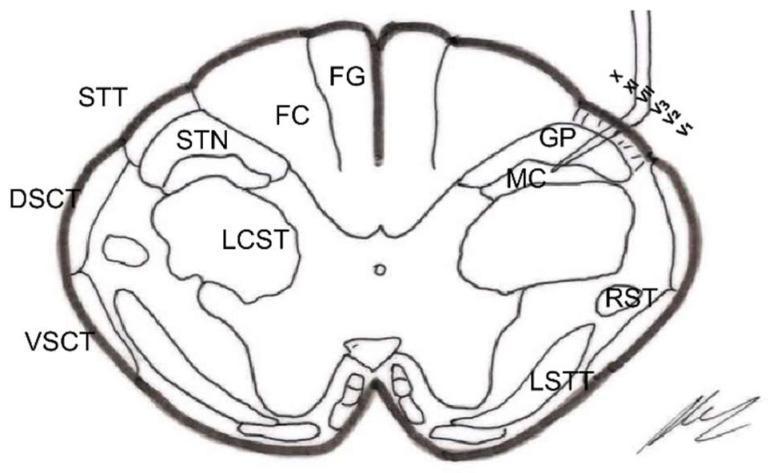
This medical anatomical diagram illustrates a cross-section of the spinal cord (medulla oblongata level, approximately 18 mm below the obex), specifically focusing on the neuroanatomical structures targeted during a trigeminal nucleotomy. The diagram highlights both white matter tracts and gray matter nuclei. In the posterior column, the Fasciculus Gracilis (FG) is medially positioned, while the Fasciculus Cuneatus (FC) is lateral to it. The lateral white matter contains the Lateral Corticospinal Tract (LCST), Dorsal Spinocerebellar Tract (DSCT), and Ventral Spinocerebellar Tract (VSCT). On the right side of the diagram, a surgical probe is shown penetrating the Spinal Trigeminal Tract (STT/STrigT) to target the Spinal Trigeminal Nucleus (STN), specifically indicating the Gelatinosa Portion (GP) and the Magnocellular Portion (MC). Other notable structures include the Rubrospinal Tract (RST) and the Lateral Spinothalamic Tract (LSTT). This illustration is designed for neurosurgical education, demonstrating the spatial relationships necessary for selective destruction of pain-transmitting nuclei in the brainstem and upper cervical spinal cord.
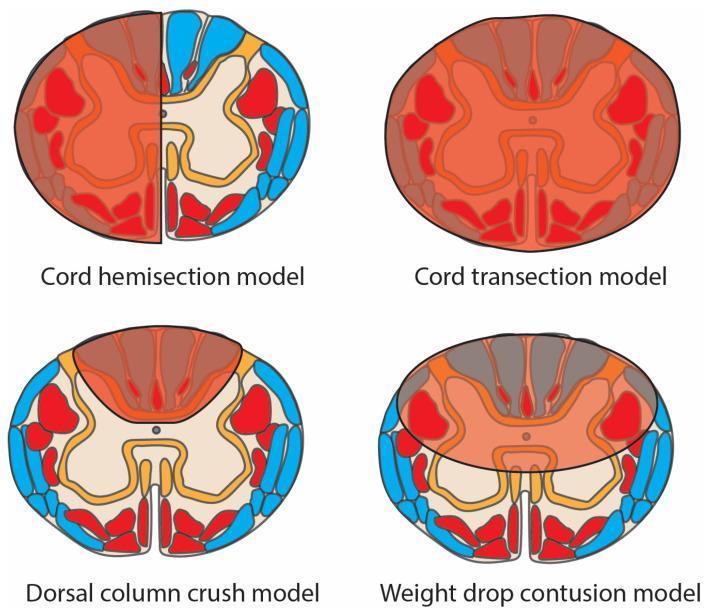
This medical schematic diagram illustrates four pre-clinical spinal cord injury (SCI) models in axial cross-section, highlighting damaged regions (translucent red overlay), motor tracts (opaque red), and sensory tracts (blue). 1. Cord Hemisection Model: Shows damage isolated to one lateral half of the spinal cord, characteristic of Brown-Séquard syndrome, affecting both motor and sensory tracts on the ipsilateral side. 2. Cord Transection Model: Depicts complete injury across the entire cord diameter, resulting in total disruption of all motor and sensory pathways. 3. Dorsal Column Crush Model: Features localized damage concentrated in the posterior (dorsal) funiculus, primarily affecting ascending sensory tracts. 4. Weight Drop Contusion Model: Displays a diffuse, central injury zone impacting the grey matter and surrounding white matter tracts, simulating clinical traumatic contusion. The diagram serves as an educational tool for comparing injury patterns across experimental models used in neurotrauma research and their resulting impact on anatomical tracts.
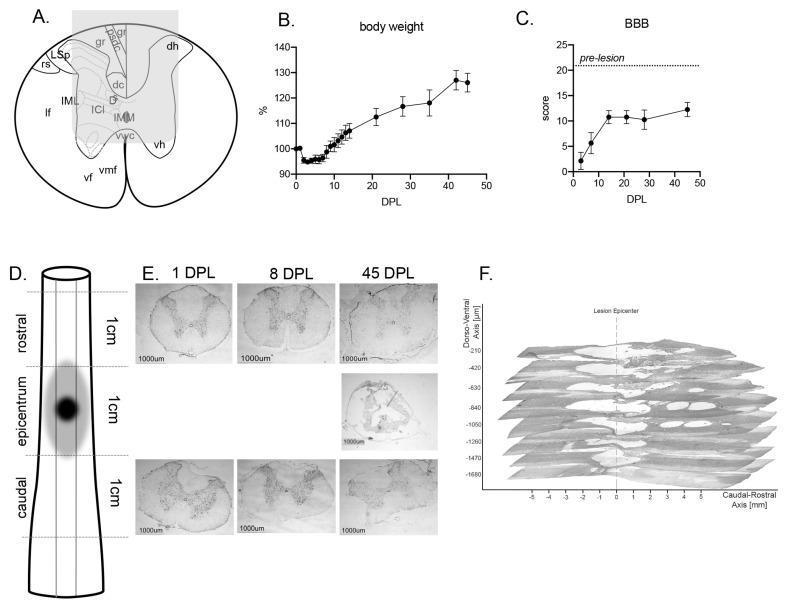
This composite educational image illustrates the functional and anatomical progression of traumatic spinal cord injury (SCI). Panel A is an anatomical diagram of a spinal cord cross-section labeling key tracts like the dorsal corticospinal tract and ventral horn. Panels B and C show line graphs tracking clinical recovery via body weight and the Basso, Beattie, Bresnahan (BBB) locomotor score. Panel D provides a schematic of the sampling strategy relative to the lesion epicentrum. Panel E displays low-magnification micrographs of Nissl-stained coronal sections at the lesion center, rostral, and caudal levels across three time points: 1, 8, and 45 days post-lesion (DPL). The micrographs show acute tissue disruption at 1 and 8 DPL, progressing to significant cavitation and tissue loss at 45 DPL (scale bars 1000 µm). Panel F shows a 3D reconstruction of longitudinal sections at 45 DPL, demonstrating the spatial extent of the cavitation, which spans approximately 6 mm rostro-caudally and reaches a dorso-ventral depth of 2 mm toward the ventral horn.
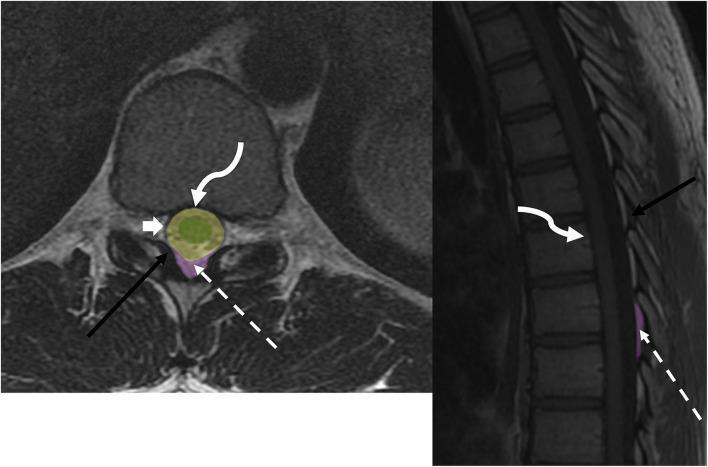
This educational anatomical diagram utilizes MRI sequences to illustrate the compartmental anatomy of the spinal canal. On the left, an axial T2-weighted image shows a cross-section of a lumbar vertebra, highlighting the high-signal (bright) cerebrospinal fluid within the thecal sac (broad white arrow). On the right, a sagittal T1-weighted sequence displays the vertical alignment of vertebral bodies and the spinal cord. Color-coded overlays define three key anatomical spaces: the intramedullary space (green) containing the spinal cord, the intradural space (yellow), and the dorsal epidural space (purple). Key ligamentous landmarks are annotated with arrows: the posterior longitudinal ligament (curved white arrow) bordering the anterior aspect of the canal, and the ligamentum flavum (black arrow) forming the posterior border. The dotted white arrow points to the epidural fat within the epidural space, characterized by intermediate signal on T1 and T2 sequences. This visualization is designed for teaching clinicians and medical students the spatial relationships necessary for localizing spinal pathologies such as disc herniations, epidural abscesses, or intramedullary tumors.
Brown-Sequard syndrome spinal cord hemisection diagram
This medical schematic diagram illustrates four pre-clinical spinal cord injury (SCI) models in axial cross-section, highlighting damaged regions (translucent red overlay), motor tracts (opaque red), and sensory tracts (blue). 1. Cord Hemisection Model: Shows damage isolated to one lateral half of the spinal cord, characteristic of Brown-Séquard syndrome, affecting both motor and sensory tracts on the ipsilateral side. 2. Cord Transection Model: Depicts complete injury across the entire cord diameter, resulting in total disruption of all motor and sensory pathways. 3. Dorsal Column Crush Model: Features localized damage concentrated in the posterior (dorsal) funiculus, primarily affecting ascending sensory tracts. 4. Weight Drop Contusion Model: Displays a diffuse, central injury zone impacting the grey matter and surrounding white matter tracts, simulating clinical traumatic contusion. The diagram serves as an educational tool for comparing injury patterns across experimental models used in neurotrauma research and their resulting impact on anatomical tracts.
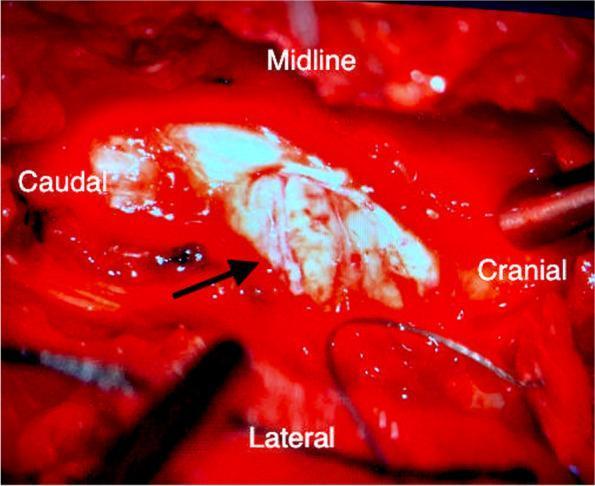
This clinical intraoperative photograph shows an exposed thoracic spinal cord under surgical magnification following a T2-T3 laminectomy. The image illustrates a traumatic spinal cord hemisection resulting from penetrating trauma. A black arrow points to the primary site of injury where the right lateral aspect of the spinal cord is visibly severed and disrupted. The exposed cord tissue appears pale-white against the background of bright red, hyperemic surgical margins and contused dura mater. Labels indicate the anatomical orientation: 'Cranial' (right), 'Caudal' (left), 'Midline' (top), and 'Lateral' (bottom). The dura mater at both the cranial and caudal poles of the surgical field shows significant contusion and hemorrhagic discoloration. This visual serves as a critical educational example of acute mechanical spinal cord disruption and is relevant for neurosurgical training regarding the assessment of Brown-Séquard syndrome-related injuries and subsequent micro-surgical repair techniques.
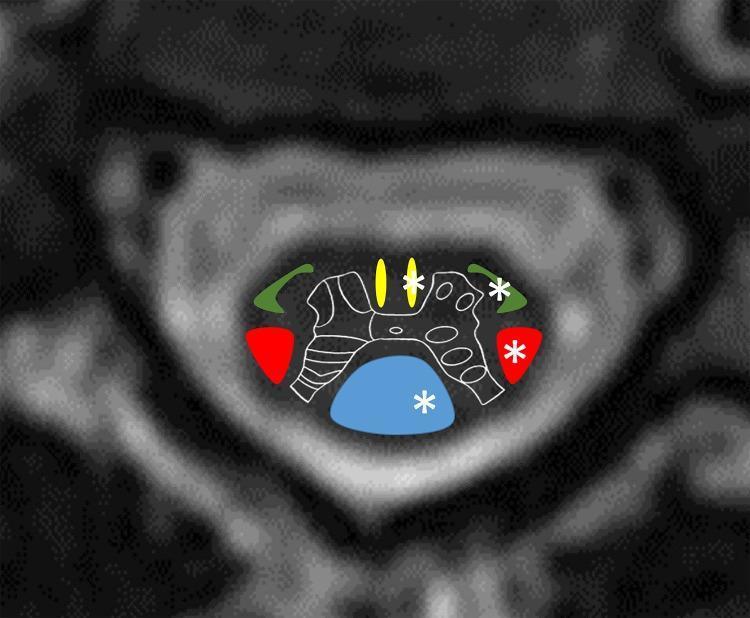
This composite diagnostic image features an axial cross-sectional graphic of the cervical spinal cord anatomy superimposed on a radiological background. The illustration uses color-coded regions to delineate primary white matter tracts: the dorsal column-medial lemniscus system is shown in blue (posteriorly), the lateral corticospinal tracts in red (laterally), the anterior corticospinal tracts in yellow (medial-anteriorly), and the anterolateral system (spinothalamic tract) in green (anterolaterally). A white outline represents the central grey matter of the spinal cord. White asterisks are strategically placed on the left hemicord tracts (blue, red, yellow, and green regions) to indicate the site of anatomical damage associated with a left-sided spinal cord lesion. This visual aid is designed to explain the pathophysiology of Brown-Séquard syndrome, illustrating how a hemicord injury affects specific ascending and descending pathways, leading to ipsilateral motor/proprioceptive loss and contralateral pain/temperature loss.
anterior cord syndrome central cord syndrome posterior cord syndrome spinal
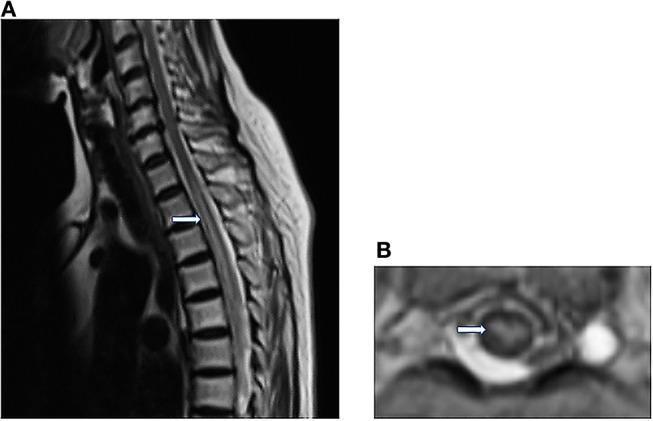
Magnetic resonance imaging (MRI) of the thoracic spine demonstrating features of anterior spinal cord syndrome. Panel A shows a sagittal T2-weighted image (T2WI) with a prominent, longitudinally extensive linear hyperintensity within the spinal cord, extending from approximately T2 to T10. Panel B displays an axial T2WI at the T8 vertebral level, highlighting bilateral, symmetrical hyperintense spots localized to the anterior horns of the gray matter. This classic radiological finding is known as the 'owl’s eye appearance' or 'snake-eye appearance,' which is highly characteristic of spinal cord infarction, particularly in the distribution of the anterior spinal artery. The imaging captures the typical central gray matter vulnerability to ischemia or embolic events, such as air embolism, in the context of vascular compromise.
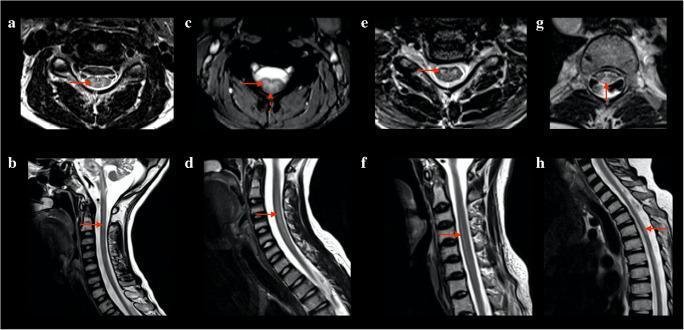
This diagnostic imaging composite displays eight T2-weighted magnetic resonance imaging (MRI) scans of the spinal cord in patients with Kearns-Sayre syndrome (KSS). The images consist of paired axial (a, c, e, g) and sagittal (b, d, f, h) views demonstrating four distinct patterns of intramedullary T2-hyperintense lesions. Panels (a) and (b) illustrate the 'H' pattern, where hyperintensity is localized to the central gray matter. Panels (c) and (d) show the 'H plus' pattern, involving both the gray matter and the posterior white matter columns. Panels (e) and (f) demonstrate an anterior pattern, with hyperintensity isolated to the anterior columns. Panels (g) and (h) show a posterior pattern, confined to the dorsal columns. The sagittal views indicate the longitudinal extent of these lesions, ranging from focal cervical involvement to multisegmental cervicothoracic extension. These radiological patterns provide evidence of both gray and white matter vacuolization, serving as a key diagnostic indicator for spinal involvement in mitochondrial cytopathies like KSS.
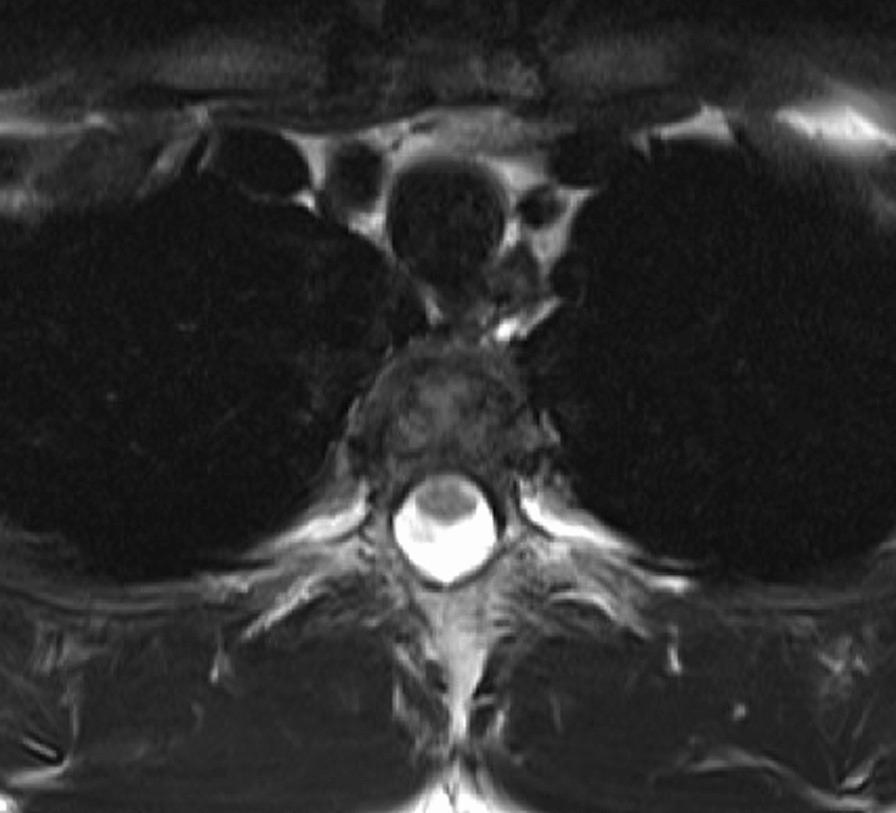
This diagnostic image is a transverse T2-weighted MRI of the thoracic spine at the Th4-5 vertebral level, specifically showing post-surgical follow-up. The central feature is the spinal canal, where the cerebrospinal fluid (CSF) exhibits a high signal intensity (bright white), clearly delineating the spinal cord, which appears as a lower-intensity (gray), rounded structure. The image demonstrates the restoration of the anterior subarachnoid space, with a visible layer of CSF separating the anterior surface of the spinal cord from the posterior aspect of the vertebral body. Anatomically, the vertebral body is positioned anteriorly, the spinal canal is central, and the posterior elements are visible behind the cord. This imaging modality and view are used in neurosurgery and orthopedics to assess spinal cord decompression, CSF flow, and positional changes of the cord within the thecal sac following procedures for conditions such as tethered cord syndrome or disc herniation.
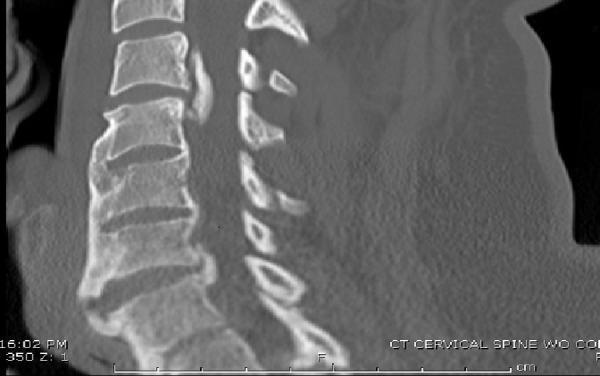
This sagittal CT scan of the cervical spine demonstrates findings consistent with diffuse idiopathic skeletal hyperostosis (DISH) and ossification of the posterior longitudinal ligament (OPLL). Extensive anterior autofusion is visible from C4 to T1, characterized by flowing ossification along the anterior aspect of the vertebral bodies. A prominent focal region of OPLL is identified at the C3-4 level, protruding into the spinal canal and narrowing the space for the spinal cord. Additionally, a distinct transverse lucency is observed through an anterior syndesmophyte at the C6-7 level, which may indicate a fracture or pseudoarthrosis. The vertebral bodies show preserved height, but the intervertebral disc spaces are obscured by the surrounding bony bridging. This image is medically significant for illustrating multi-level spinal stiffness and focal compressive pathologies that increase the risk of central cord syndrome following minor trauma. Target educational concepts include the radiographic identification of DISH, OPLL morphology, and the evaluation of spinal fractures in ankylosed spines.
Localization of Spinal Cord Lesions - A Complete Guide for DM Neurology
STEP 1: UNDERSTAND THE SPINAL CORD ANATOMY FIRST
Key White Matter Tracts (Cross-Section)
| Tract | Location | Fibers | Decussation |
|---|---|---|---|
| Dorsal columns (Gracile + Cuneate fasciculi) | Posterior funiculus | Ipsilateral proprioception, vibration, 2-point discrimination, light touch | Decussates in medulla (medial lemniscus) |
| Lateral corticospinal tract | Lateral funiculus (posterior part) | Motor (UMN), ipsilateral | Already crossed at pyramidal decussation |
| Lateral spinothalamic tract | Lateral funiculus (anterior part) | Contralateral pain + temperature | Crosses within 1-2 segments of entry |
| Anterior spinothalamic tract | Anterior funiculus | Contralateral crude touch | Crosses within 1-2 segments |
| Spinocerebellar tracts | Lateral funiculus | Proprioception to cerebellum | Dorsal = ipsilateral; Ventral = crosses twice |
| Descending autonomic fibers | Lateral funiculus | Sympathetic (ciliospinal of Budge: C8-T2) | - |
- Dorsal columns: Sacral fibers most medial, cervical most lateral
- Lateral spinothalamic tract: Sacral fibers most lateral, cervical most medial (opposite!)
- This explains sacral sparing in central/intramedullary lesions vs. sacral predominance in extrinsic/extramedullary lesions
STEP 2: THE CLASSIC SPINAL CORD SYNDROMES
1. Brown-Séquard Syndrome (Cord Hemisection)
- Ipsilateral LMN weakness (segmental)
- Ipsilateral loss of all sensation (a narrow band)
- Ipsilateral: Spastic weakness (corticospinal), loss of proprioception + vibration (dorsal column)
- Contralateral: Loss of pain + temperature (spinothalamic) - 1 to 2 segments BELOW the actual level due to the ascent of fibers before crossing
2. Central Cord Syndrome
- Motor deficit - arms > legs (cervical fibers are central; sacral most lateral - spared)
- Bladder dysfunction (urinary retention)
- Dissociated sensory loss (pain + temperature lost in cape/shawl distribution over shoulders + arms; proprioception preserved)
3. Anterior Cord Syndrome (Anterior Spinal Artery Syndrome)
- Bilateral motor paralysis (corticospinal)
- Bilateral loss of pain + temperature (spinothalamic)
- Bladder + bowel dysfunction (autonomic)
- Preserved: Vibration, proprioception, 2-point discrimination (posterior columns spared!)
4. Posterior Cord Syndrome
- Loss of proprioception + vibration bilaterally
- Sensory ataxia, positive Romberg
- Motor strength intact
- Lhermitte sign (electric shock down spine with neck flexion - indicates posterior column dysfunction)
5. Complete Transverse Cord Syndrome
- Complete bilateral flaccid paralysis (acute) → spasticity
- Complete sensory loss to all modalities
- Bladder/bowel/sexual dysfunction
- Autonomic dysreflexia (lesions above T6)
STEP 3: LEVEL-BY-LEVEL LOCALIZATION
Foramen Magnum / Upper Cervical (C1-C4)
- Suboccipital pain (C2 - greater occipital nerve)
- Lhermitte sign (posterior column)
- "Clockwise" UMN weakness pattern: ipsilateral arm → ipsilateral leg → contralateral leg → contralateral arm
- Can cause hemiparesis, triparesis, or quadriparesis
- Cranial nerves IX-XII palsies (glossopharyngeal, vagal, accessory, hypoglossal)
- Downbeat nystagmus, cerebellar ataxia
- Cruciate paralysis (cervicomedullary junction): contralateral arm paresis + ipsilateral leg paresis
- Diaphragm paralysis at C3-C5 (phrenic nerve)
- False localizing: Fingertip numbness, thoracic sensory level (even with C3-C4 lesion!)
- Horner syndrome (ciliospinal center at C8-T1 but descending sympathetics at C1-C4)
C5-C6 Segments
| Feature | C5 | C6 |
|---|---|---|
| Weakness | Deltoid, biceps, brachioradialis, spinati, pectorals | + Wrist extensors (ECRL) |
| Reflex | Biceps ↓/absent, brachioradialis ↓ → inverted brachioradialis reflex (tap radius → finger flexion without forearm flexion/supination); triceps exaggerated | Biceps + brachioradialis ↓, finger flexors exaggerated |
| Sensory loss | Below neck, anterior shoulder | Same + sparing of lateral arm |
| Below lesion | Spastic paraparesis | Spastic paraparesis |
C7 Segment
- Diaphragm normal
- Paresis of wrist + finger flexors AND extensors
- Biceps and brachioradialis reflexes preserved
- Inverted triceps reflex (tap olecranon → forearm flexion without extension)
- Finger flexor reflex exaggerated
- Sensory loss at/below 3rd and 4th digits, medial arm/forearm
C8-T1 Segments
- Intrinsic hand muscle weakness (small muscles)
- C8: Triceps and finger flexor reflexes ↓
- T1: Triceps normal, finger flexor ↓
- Horner syndrome (C8-T1 = ciliospinal center of Budge)
- Spastic paraparesis below
- "Syndrome of numb, clumsy hands" with glove sensory loss (cervical spondylosis)
Thoracic Segments
- Radicular pain mimicking intercostal neuralgia
- Paraplegia + sensory level below lesion
- Beevor sign (T10): On neck flexion against resistance, umbilicus moves UPWARD (upper abdominals at T8-T9 intact, lower at T10-T12 weak)
- Superficial abdominal reflexes:
- Lost above T6
- T10 lesion: lower absent, upper present
- T12: All present
- Autonomic dysreflexia above T6 (sympathetic outflow)
- Vasomotor instability, syncope above T5
Lumbar Segments (Intramedullary)
| Level | Hip flexion | Knee | Ankle | Key reflexes |
|---|---|---|---|---|
| L1 | All LE weak | Spastic | Spastic | Patellar ↑, ankle ↑ |
| L2 | Hip flexors weak | Spastic | Normal | Patellar ↓, ankle ↑; cremasteric absent |
| L3 | Hip flexion + adduction partly preserved | Patellar ↓/absent | Ankle ↑ | |
| L4 | Better hip + adduction; knee stabilized | Patellar absent | Ankle ↑ | Inverted patellar reflex |
| L5 | Normal hip flexion + adduction, knee extension | Normal | Ankle ↓/absent | |
| S1-S2 | Normal everything except gastrocnemius/soleus (S2) | Normal | Ankle absent |
Conus Medullaris vs. Cauda Equina - The Exam Discriminator
| Feature | Conus Medullaris (S3-S5 segments) | Cauda Equina (Nerve roots below L2) |
|---|---|---|
| Pain | Late, bilateral, perineal/thighs/buttocks | Early, unilateral/asymmetric, radicular |
| Sphincter dysfunction | Early | Late |
| Sensory loss | Symmetric saddle anesthesia | Asymmetric, radicular distribution |
| Motor deficit | Mixed UMN + LMN | Pure LMN: flaccid, hypotonic, areflexic |
| Reflexes | Bulbocavernosus absent; knee may be ↑ | Ankle absent, knee variable |
| Sexual dysfunction | Present early | Present |
| CSF | Low protein | High protein (due to concentration by multiple nerve roots) |
| Prognosis | Worse | Better (peripheral nerve regeneration possible) |
STEP 4: INTRAMEDULLARY vs. EXTRAMEDULLARY DISTINCTION
| Feature | Intramedullary | Extramedullary |
|---|---|---|
| Radicular pain | Unusual | Common, early |
| Vertebral pain | Unusual | Common |
| Sensory dissociation | Common (spinothalamic > dorsal column early) | Less common |
| Sacral sensation | Spared early (sacral sparing) | Involved early |
| Motor deficit | Descending (arm → leg) | Ascending (leg → arm) |
| UMN signs | Late, mild | Early, prominent |
| Fasciculations/atrophy | May be present | Unusual |
| Horner syndrome | Can occur | Can occur |
| CSF block | Unusual | Common |
| CSF protein | Slightly elevated | Often markedly elevated |
| Progression | Slow | Variable |
STEP 5: QUICK CLINICAL MNEMONICS FOR EXAM
- Inverted brachioradialis = C5
- Inverted triceps = C7
- Inverted patellar = L3-L4 (knee jerk absent, ankle jerk brisk)
STEP 6: KEY VASCULAR SYNDROMES
| Syndrome | Artery | Spared | Lost |
|---|---|---|---|
| Anterior spinal artery | ASA | Posterior columns | Motor + pain/temp |
| Posterior spinal artery | PSA (paired) | Motor, pain/temp | Proprioception + vibration |
| Central cord ischemia | Sulcal arteries | Peripheral white matter | Central gray + crossing STT fibers |
High-Yield Summary Table for DM Exam
| Syndrome | Motor | Proprioception/Vibration | Pain/Temp | Autonomic |
|---|---|---|---|---|
| Complete transverse | Bilateral ↓↓ | ↓↓ | ↓↓ | ↓↓ |
| Brown-Séquard | Ipsilateral ↓ | Ipsilateral ↓ | Contralateral ↓ (1-2 levels below) | ± Ipsilateral Horner |
| Anterior cord | Bilateral ↓ | Preserved | Bilateral ↓ | ↓ |
| Central cord | Arms > Legs | Preserved | Cape distribution | Bladder retention |
| Posterior cord | Preserved | Bilateral ↓ | Preserved | Preserved |
| Conus | Mixed UMN+LMN | Saddle ↓ | Saddle ↓ | Early, severe |
| Cauda equina | LMN only (asymm) | Asymm ↓ | Asymm ↓ | Late |