
Laboratory diagnosis of hiv infection
HIV laboratory diagnosis ELISA western blot diagram
This diagnostic image shows a Western blot analysis used to verify the expression and immunoreactivity of a recombinant chimeric antigen (SsIR-Ss1a) related to Strongyloidiasis. The blot consists of four lanes. Lane 'PL' contains the Protein Ladder with molecular weight markers ranging from 14 kDa to 170 kDa. Lanes 1 and 2 display the purified recombinant chimeric antigen (elute), showing distinct bands at approximately 35 kDa. Lane 'C' serves as a control containing the recombinant nucleocapsid (N) protein of SARS-CoV-2, which appears as a band at a slightly higher molecular weight of approximately 41 kDa. A horizontal grey bar is positioned across lanes 1 and 2 to highlight the target protein's molecular weight at 35 kDa. This visual demonstrates successful protein expression and purification in a laboratory diagnostic context, confirming the molecular size and specificity of the chimeric protein intended for use in immunological assays such as ELISA for detecting human parasitic infections.
A Western blot diagnostic image used to confirm the expression of a recombinant protein derived from the Echinococcus granulosus (hydatid cyst) Iranian G1 strain. The blot consists of three vertical lanes set against a light, uniform background. Lane 1 (negative control) contains bacterial lysate without a plasmid, showing no visible bands. Lane 2 contains bacterial lysate with a plasmid lacking the recombinant insert, exhibiting only a very faint, indistinct signal. Lane 3 (positive sample) demonstrates a distinct, high-intensity horizontal dark band, indicating successful expression of the targeted recombinant protein. This molecular biology technique is utilized in clinical research to validate antigen production for diagnostic assays, such as ELISA, for human hydatid disease. The clear visibility in Lane 3 compared to the controls confirms the presence and specificity of the recombinant antigen.
This diagnostic image is a Western blot analysis of virion lysates from various HIV-1 and human-simian immunodeficiency virus (HSIV) clones, including NL4-3 ΔVpr, NL4-3, HSIV-vifNL4-3, Vpr+ HSIV-vifNL4-3, HSIV-vifAD8, and Vpr+ HSIV-vifAD8. The blot is divided into two main panels to demonstrate the presence or absence of specific viral accessory proteins. The upper panel, labeled 'Vpr', shows protein bands at approximately 14 kDa. Visible bands are present for NL4-3 and the engineered Vpr+ HSIV clones (Vpr+ HSIV-vifNL4-3 and Vpr+ HSIV-vifAD8), while Vpr expression is absent in the ΔVpr mutant and the original HSIV-vif clones. The lower panel, labeled 'Nef', displays consistent protein bands across all six lanes. This consistent detection of Nef serves as a loading control, confirming that equal amounts of virion lysate were analyzed and that viral protein incorporation occurred across all clones regardless of Vpr status. This material is used in virology research to validate the successful expression and virion incorporation of HIV-1 accessory proteins in chimeric viral constructs designed for pathogenesis studies.
This diagnostic laboratory image displays a Western blot assay used to detect the expression of the NAHSP70 protein. The blot contains five lanes: Lanes 1 and 2 show no detectable bands, representing non-transfected cells and a negative control. Lane 3, containing culture supernatant, and Lane 4, containing infected Sf9 cell lysate, both exhibit target protein bands located between the 50 kDa and 75 kDa markers. Lane 4 shows higher band intensity compared to Lane 3, and a secondary faint band near 37 kDa. Lane L contains a prestained protein ladder with prominent molecular weight markers at 75 kDa, 50 kDa, and 37 kDa. This image serves as a molecular biology illustration of protein expression and purification verification using baculovirus expression systems, relevant for medical research in heat shock proteins and recombinant vaccine production.
"HIV diagnosis" AND laboratory
HIV infection diagnosis algorithm fourth generation testing flowchart
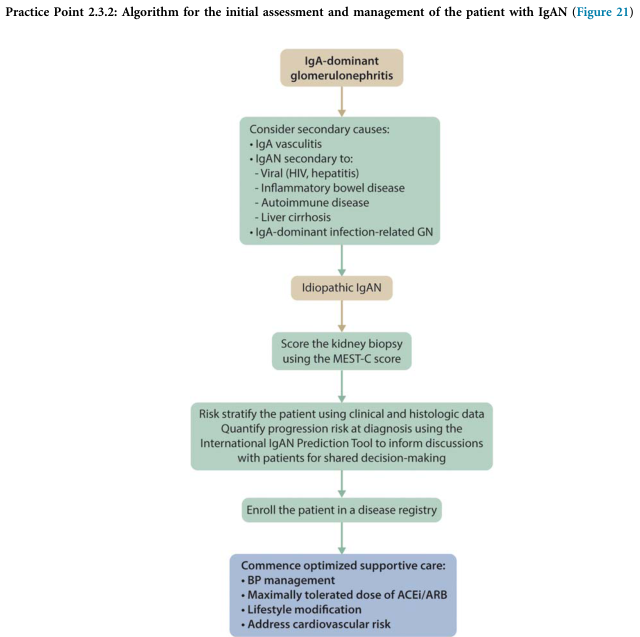
Summary : This flowchart presents the initial assessment and management algorithm for patients with IgA nephropathy (IgAN), guiding clinicians through differential diagnosis, risk stratification, and supportive care steps. flowchart: # Nodes : • Start: "IgA-dominant glomerulonephritis" (rounded rectangle) • "Consider secondary causes: • IgA vasculitis • IgAN secondary to: - Viral (HIV, hepatitis) - Inflammatory bowel disease - Autoimmune disease - Liver cirrhosis • IgA-dominant infection-related GN" (rectangle) • "Idiopathic IgAN" (rounded rectangle) • "Score the kidney biopsy using the MEST-C score" (rectangle) • "Risk stratify the patient using clinical and histologic data Quantify progression risk at diagnosis using the International IgAN Prediction Tool to inform discussions with patients for shared decision-making" (rectangle) • "Enroll the patient in a disease registry" (rectangle) • "Commence optimized supportive care: • BP management • Maximally tolerated dose of ACEi/ARB • Lifestyle modification • Address cardiovascular risk" (rectangle, blue background) # Connectors : • All nodes are connected by downward-pointing arrows in a single linear sequence. • No branches, loops, or merges are present. # Layout : • Vertically stacked, single-column flowchart. • Each step follows sequentially from top to bottom. # Analysis : • The flowchart provides a systematic approach for clinicians to evaluate patients with IgA-dominant glomerulonephritis, beginning with exclusion of secondary causes, confirming idiopathic IgAN, scoring biopsy findings, risk stratification, registry enrollment, and initiation of evidence-based supportive care. The process is strictly linear, emphasizing stepwise decision-making and comprehensive management.
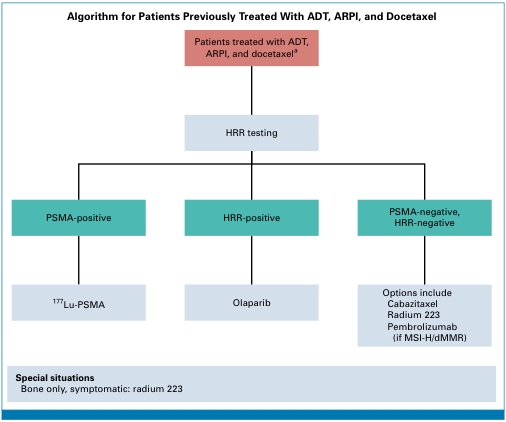
Summary : This flowchart presents an algorithm for managing patients with prostate cancer who have previously been treated with ADT (androgen deprivation therapy), ARPI (androgen receptor pathway inhibitor), and docetaxel. It guides subsequent treatment decisions based on HRR (homologous recombination repair) testing and PSMA (prostate-specific membrane antigen) status. flowchart: # Nodes : • Patients treated with ADT, ARPI, and docetaxel (rectangle, top node) • HRR testing (rectangle, second row) • PSMA-positive (rectangle, third row, left branch) • HRR-positive (rectangle, third row, middle branch) • PSMA-negative, HRR-negative (rectangle, third row, right branch) • ¹⁷⁷Lu-PSMA (rectangle, fourth row, under PSMA-positive) • Olaparib (rectangle, fourth row, under HRR-positive) • Options include Cabazitaxel, Radium 223, Pembrolizumab (if MSI-H/dMMR) (rectangle, fourth row, under PSMA-negative, HRR-negative) • Special situations: Bone only, symptomatic: radium 223 (rectangle, bottom, separate section) # Connectors : • Downward arrows from "Patients treated with ADT, ARPI, and docetaxel" to "HRR testing" • Three branches from "HRR testing" to "PSMA-positive", "HRR-positive", and "PSMA-negative, HRR-negative" • Downward arrows from each third-row node to their respective treatment options in the fourth row # Layout : • Vertical flow from top to bottom • Three-way split after HRR testing, with parallel branches for PSMA-positive, HRR-positive, and PSMA-negative/HRR-negative • Special situations box is horizontally separated at the bottom # Analysis : • The algorithm uses HRR testing as a key decision point after initial treatments. • Patients are stratified into three groups: PSMA-positive, HRR-positive, and PSMA-negative/HRR-negative. • Each group is directed to a specific subsequent therapy: ¹⁷⁷Lu-PSMA for PSMA-positive, Olaparib for HRR-positive, and a choice of Cabazitaxel, Radium 223, or Pembrolizumab (if MSI-H/dMMR) for PSMA-negative, HRR-negative. • Special consideration is given for bone-only, symptomatic cases, recommending radium 223. • The flowchart provides a clear, stepwise approach to personalized treatment selection based on molecular and imaging markers.
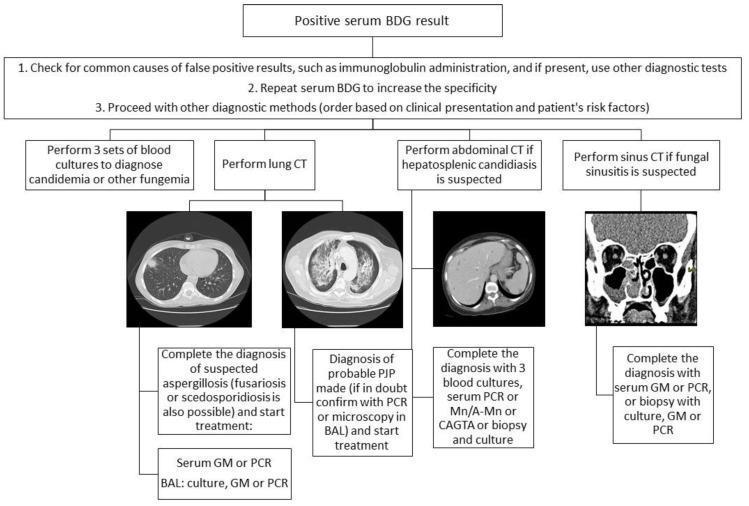
This educational clinical flowchart illustrates the diagnostic approach to a positive serum (1,3)-beta-D-glucan (BDG) result in patients with hematological malignancies. The algorithm begins by recommending a check for false positives, such as immunoglobulin administration, followed by repeated BDG testing and clinical risk assessment. The flowchart branches into four diagnostic pathways based on clinical suspicion, each integrated with representative CT imaging examples. The first branch focuses on blood cultures for candidemia. The second branch focuses on pulmonary involvement, showcasing lung CT scans illustrating a localized opacity (suggesting aspergillosis, fusariosis, or scedosporidiosis) and bilateral ground-glass opacities (suggesting Pneumocystis jirovecii pneumonia, PJP). The third branch addresses hepatosplenic candidiasis with an abdominal CT scan. The fourth branch focuses on fungal sinusitis, displaying a coronal sinus CT with mucosal thickening and opacification. Each imaging branch concludes with specific confirmatory tests, including galactomannan (GM), PCR, bronchoalveolar lavage (BAL), or tissue biopsy. This resource serves as a clinical guideline for managing invasive fungal infections in immunocompromised populations.
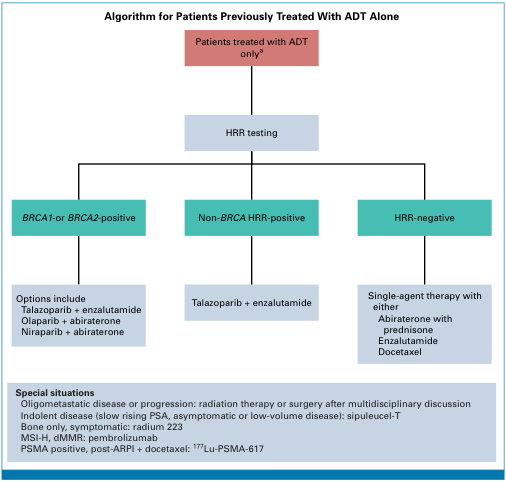
Summary : This flowchart presents an algorithm for managing patients previously treated with androgen deprivation therapy (ADT) alone, based on homologous recombination repair (HRR) testing results and subsequent treatment options. flowchart: # Nodes : • Patients treated with ADT only (rectangle, top node) • HRR testing (rectangle, second level) • BRCA1- or BRCA2-positive (rectangle, third level, left branch) • Non-BRCA HRR-positive (rectangle, third level, middle branch) • HRR-negative (rectangle, third level, right branch) • Options include Talazoparib + enzalutamide, Olaparib + abiraterone, Niraparib + abiraterone (rectangle, fourth level, left branch) • Talazoparib + enzalutamide (rectangle, fourth level, middle branch) • Single-agent therapy with either Abiraterone with prednisone, Enzalutamide, Docetaxel (rectangle, fourth level, right branch) • Special situations (gray box at bottom): Oligometastatic disease or progression, indolent disease, bone only symptomatic, MSI-H/dMMR, PSMA positive, with specific therapies listed # Connectors : • Downward arrows connect each node in sequence. • HRR testing branches into three parallel paths: BRCA1/2-positive, Non-BRCA HRR-positive, and HRR-negative. • Each branch leads to specific treatment options. # Layout : • Vertical flow from top to bottom. • Three parallel branches at the third level, each with its own treatment options. • Special situations box is horizontally placed at the bottom, spanning all branches. # Analysis : • The algorithm stratifies patients based on HRR testing into three main groups: BRCA1/2-positive, non-BRCA HRR-positive, and HRR-negative. • Each group receives tailored treatment options, with combination therapies for HRR-positive patients and single-agent therapies for HRR-negative patients. • Special situations are addressed with additional therapies, indicating a nuanced approach for specific clinical scenarios. • The flowchart emphasizes the importance of genetic testing in guiding therapy selection for patients previously treated with ADT alone.
Laboratory Diagnosis of HIV Infection
Overview
- Serologic (antibody/antigen-based) screening
- Confirmatory immunoassays
- Direct viral detection (nucleic acid tests, p24 antigen)
1. Screening Tests
Fourth-Generation EIA (Enzyme Immunoassay / ELISA)
- IgM antibodies to HIV-1 and HIV-2
- IgG antibodies to HIV-1 and HIV-2
- p24 capsid antigen (HIV-1 core protein)
| Generation | Detects | Window Period |
|---|---|---|
| 3rd generation EIA | IgM + IgG | ~22-24 days (26-32 for rapid) |
| 4th generation EIA | IgM + IgG + p24 antigen | ~16-18 days (19-20 for rapid) |
- Antibodies to class II HLA antigens (post-pregnancy, transfusion, transplant)
- Autoantibodies
- Hepatic disease
- Recent influenza vaccination
- Acute viral infections
- Receipt of an HIV vaccine
2. CDC Diagnostic Algorithm (2014, Updated)
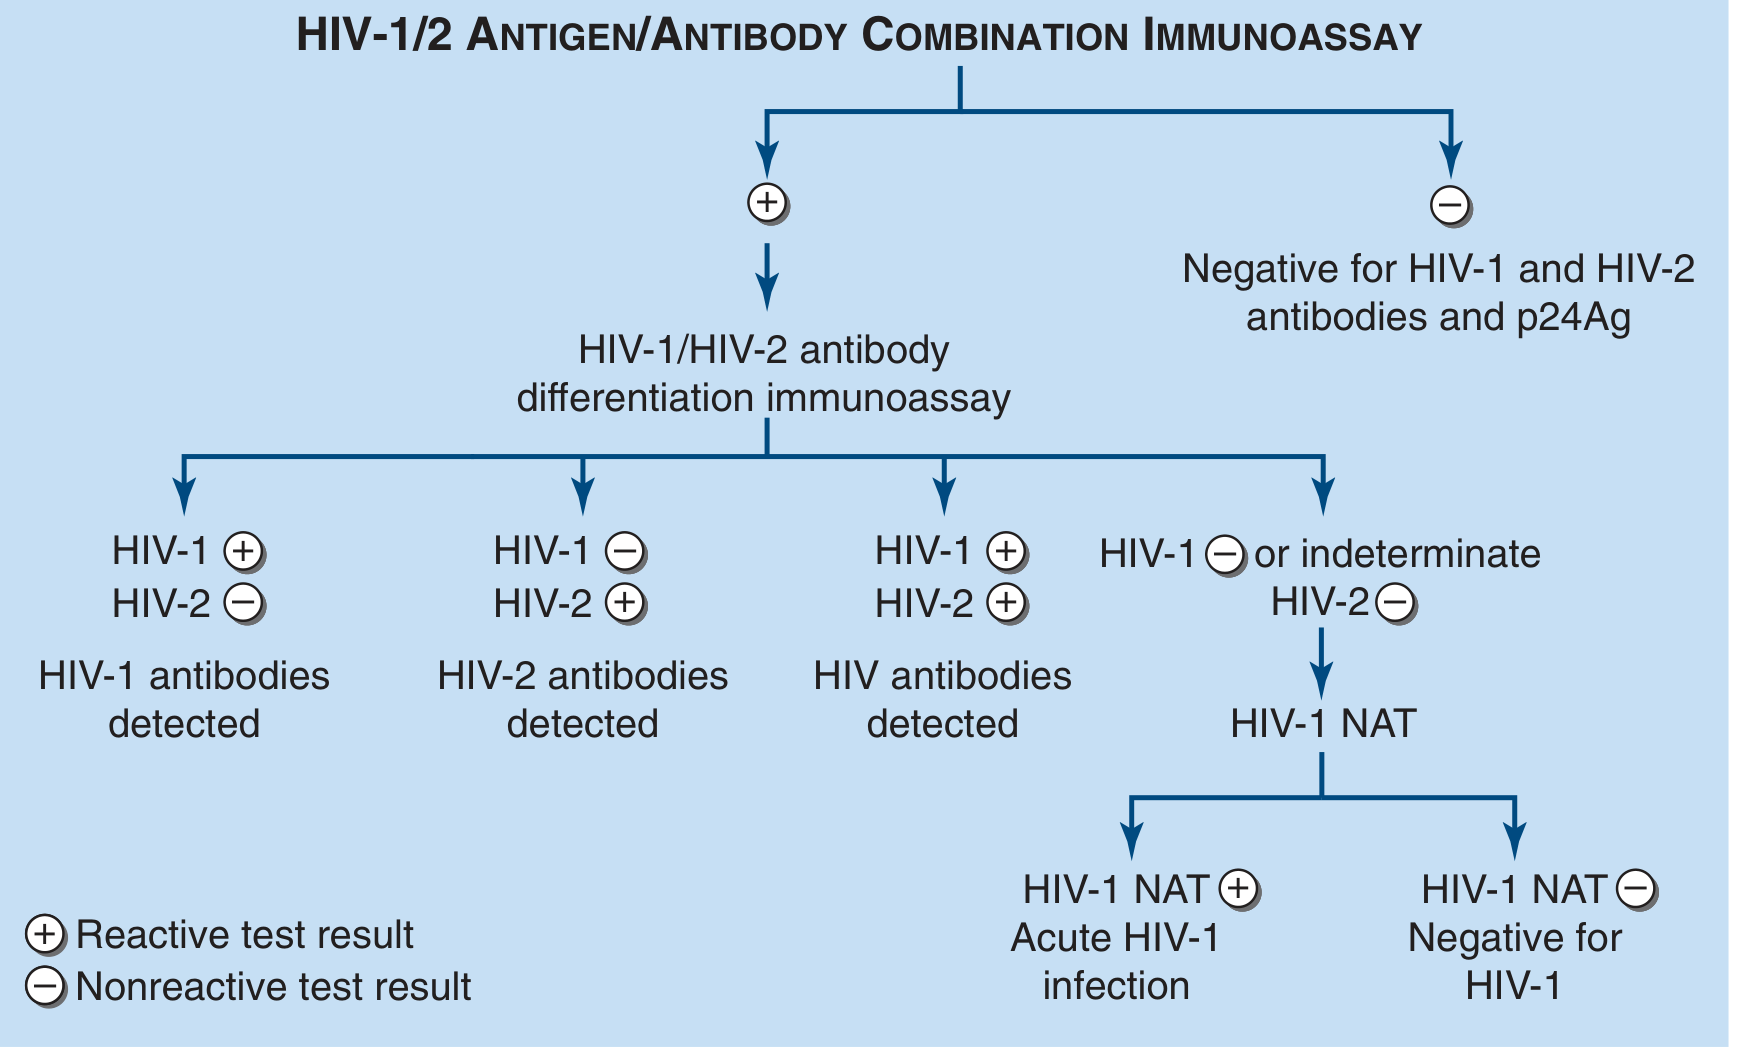
- If negative → HIV-1 and HIV-2 infection ruled out (retest only if recent exposure within 3 months suspected)
- If positive/indeterminate → proceed to Step 2
- HIV-1 (+), HIV-2 (-) → HIV-1 infection confirmed
- HIV-1 (-), HIV-2 (+) → HIV-2 infection confirmed
- Both positive → HIV antibodies detected (undifferentiated)
- Negative or indeterminate → proceed to Step 3
- NAT positive → Acute HIV-1 infection (antibodies not yet developed)
- NAT negative → HIV-1 negative (negative for HIV-1)
Key point: A positive initial screening test with a negative antibody differentiation immunoassay, combined with a positive NAT, indicates acute/early HIV infection - the patient is in the seronegative window period but viremic.
3. Confirmatory Tests
HIV-1/HIV-2 Antibody Differentiation Immunoassay
- Replaces the Western blot for confirmation
- Window period: ~32-36 days
- Differentiates HIV-1 from HIV-2 infection
Western Blot (Historical)
- Previously used as the confirmatory test; no longer recommended for this purpose per current CDC guidelines
- Detects IgG against specific HIV proteins (gp120, gp41, p24, p17, gp160)
- Criteria for positive: at least two of three bands - p24, gp41, gp120/160
- Window period: ~35 days
- Drawbacks: cannot detect recent infections; technically demanding
4. Direct Detection Tests
p24 Antigen Capture Assay
- Detects the HIV-1 core protein (p24) using an EIA-format
- Sensitivity: detects ~30% of untreated patients; rises to ~50% after acid dissociation of antigen-antibody complexes
- Detects down to 15 pg/mL of p24
- Now integrated into the 4th-generation EIA
- During early infection: p24 rises before antibodies appear, then declines as anti-p24 antibodies develop; rises again in late-stage disease
Nucleic Acid Tests (NATs) - HIV RNA
| Test | Method | Sensitivity | Window Period |
|---|---|---|---|
| Qualitative HIV-1 RNA (diagnostic) | RT-PCR | ≥100 copies/mL | ~10-12 days |
| Quantitative HIV-1 RNA (viral load) | RT-PCR, bDNA, or TMA | 20-50 copies/mL | ~6-10 days |
| HIV RNA by bDNA | Signal amplification | ≥50 copies/mL | - |
| HIV RNA by TMA | T7 RNA polymerase amplification | ≥6 copies/mL | - |
- Diagnose acute HIV infection (before antibodies develop)
- Resolve indeterminate serologic results
- Monitor viral load (response to ART)
- Blood donor screening (routine since 2002)
- Patients with hypogammaglobulinemia or advanced disease where serology is unreliable
Proviral DNA PCR
- Detects HIV DNA in peripheral blood mononuclear cells
- Useful when RNA testing is inconclusive
- Important for diagnosing HIV in neonates (maternal antibodies interfere with serology)
5. Laboratory Monitoring of HIV-Positive Patients
CD4+ T Cell Count
- Best indicator of current immunologic status
- Measured at diagnosis, then every 3-6 months for the first 2 years
- Clinical thresholds:
| CD4 Count | Clinical Implication |
|---|---|
| <500/µL | Monitoring optional if on stable ART with undetectable viral load |
| 300-500/µL | Yearly monitoring if on ART >2 years with HIV RNA <50 copies/mL |
| <200/µL | High risk for P. jirovecii pneumonia; start prophylaxis |
| <50/µL | High risk for CMV, MAC, T. gondii; start MAC prophylaxis |
- CD4% of 15% ≈ CD4 count of 200/µL (useful when splenectomy or hypersplenism distorts the count)
- Caution: HTLV-1/HIV co-infection may give falsely elevated CD4 counts
HIV RNA Viral Load
- Measures plasma HIV-1 RNA (copies/mL)
- Primary tool for monitoring ART response
- Goal with effective ART: <20-50 copies/mL ("undetectable")
- Should be measured at baseline, 2-4 weeks after starting/changing ART, and every 3-6 months thereafter
- A rising viral load on ART suggests treatment failure or poor adherence
6. Point-of-Care and Rapid Tests
- Several rapid HIV tests can provide results in 1-60 minutes
- One FDA-approved home test is available in the US (OraQuick), with results in ~20 minutes
- Home-collection kits can be mailed to labs for testing
- Any positive rapid/home test must be confirmed by standard laboratory testing
7. Special Situations
| Situation | Recommended Test |
|---|---|
| Suspected acute infection (window period) | HIV-1 RNA NAT |
| Neonates/infants born to HIV+ mothers | HIV DNA PCR (maternal IgG crosses placenta, making serology unreliable for ~18 months) |
| Hypogammaglobulinemia | HIV RNA or DNA PCR |
| Early seroconversion treated aggressively | May revert to negative EIA - use RNA testing |
| HIV-2 suspected (West African exposure) | HIV-1/HIV-2 differentiation assay |
Summary Table: Window Periods
| Test | Window Period |
|---|---|
| HIV RNA NAT (qualitative) | 10-12 days |
| HIV RNA NAT (quantitative, viral load) | 6-10 days |
| 4th-generation Ag/Ab EIA | 16-18 days |
| 3rd-generation Ab EIA | 22-24 days |
| HIV-1/2 differentiation immunoassay | 32-36 days |
| Western blot | ~35 days |