
Mechanical ventilation modes and graphs , settings everything like a story easy to understand and with short story like
mechanical ventilation modes pressure volume waveform graphs
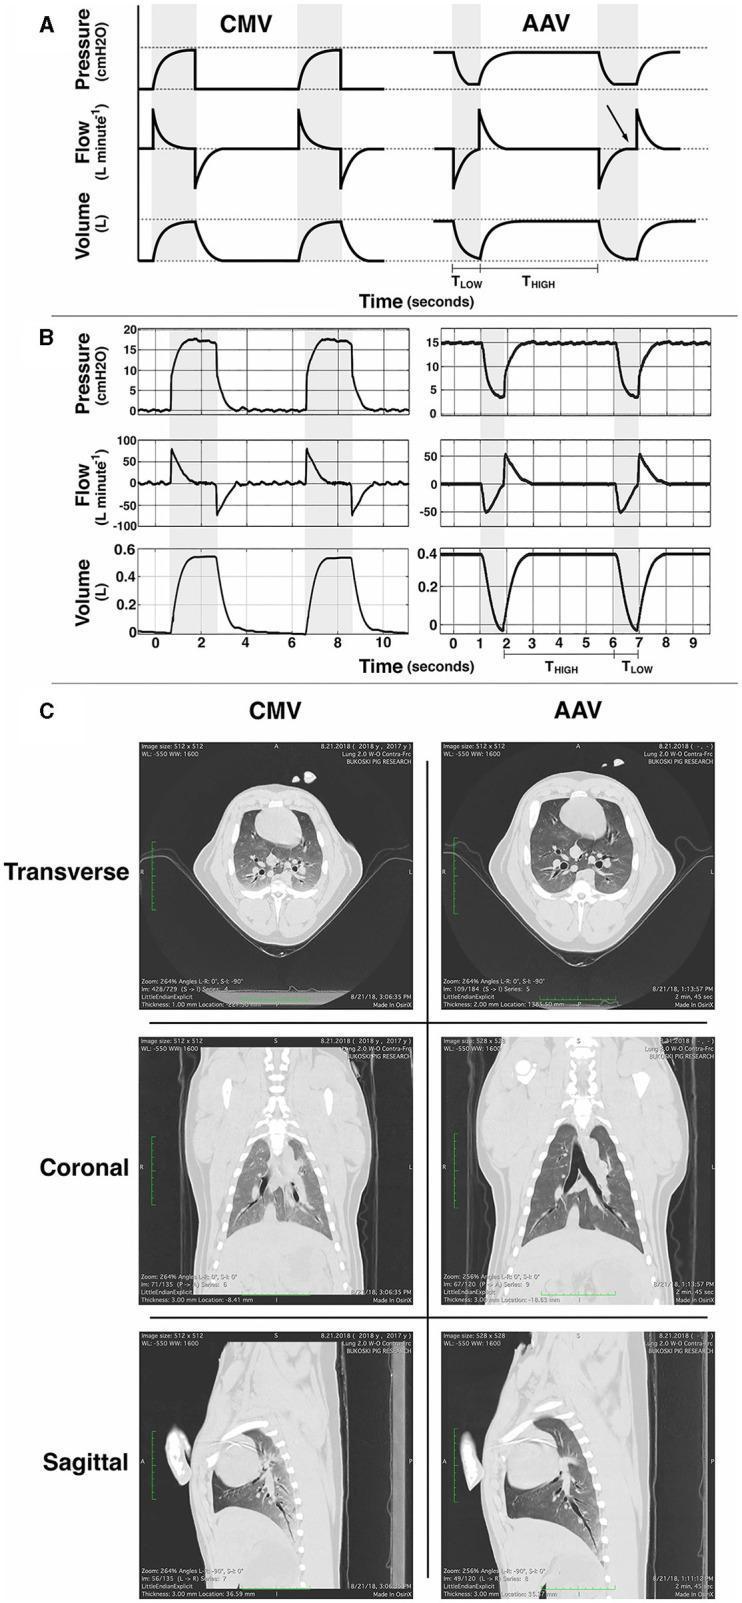
This multi-panel figure illustrates a comparative analysis of two mechanical ventilation modes: Conventional Mechanical Ventilation (CMV) and Apneustic Anesthesia Ventilation (AAV). Section A provides idealized schematic waveforms for pressure, flow, and volume over time. CMV is characterized by intermittent pressure increases from baseline, while AAV (similar to Airway Pressure Release Ventilation or APRV) maintains an elevated baseline pressure (PHIGH) for a prolonged duration (THIGH) with brief, rapid releases to a lower pressure (PLOW) during a shorter interval (TLOW). Section B displays corresponding real-time example waveforms, highlighting that AAV maintains higher lung volumes throughout the respiratory cycle. Section C presents thoracic computed tomography (CT) scans in transverse, coronal, and sagittal planes, comparing lung recruitment and aeration between modes. The AAV images demonstrate improved lung inflation and more uniform density across the parenchyma compared to CMV, where areas of increased dependent opacification suggest potential atelectasis. This resource is designed for critical care and anesthesia education, focusing on respiratory physiology, ventilator waveform analysis, and the impact of ventilation strategies on pulmonary recruitment.
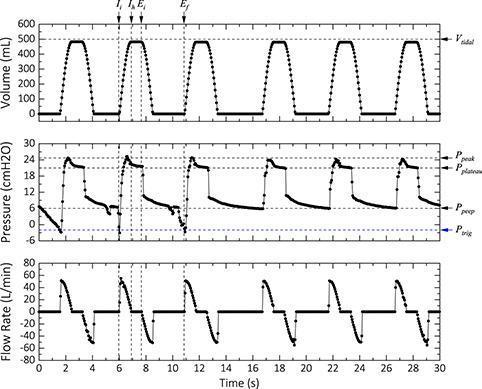
This diagnostic graphic displays three stacked ventilator waveforms (Volume, Pressure, and Flow Rate) over a 30-second interval, demonstrating mechanical ventilation in assisted mode. The top graph shows Tidal Volume (Vt) pulsing consistently to approximately 500 mL with a distinct plateau indicating an end-inspiratory hold. The middle Pressure-time waveform illustrates critical respiratory parameters: a negative deflection reaching the trigger pressure (Ptrig) of -2 cmH2O initiates each breath, followed by a rapid rise to a peak inspiratory pressure (Ppeak) of ~25 cmH2O. An inspiratory hold reveals a plateau pressure (Pplateau) of ~22 cmH2O, with the cycle concluding at a positive end-expiratory pressure (PEEP) of ~5 cmH2O. The bottom Flow Rate graph displays corresponding inspiratory and expiratory flow pulses. Annotations mark key temporal points: initial inspiration (Ii), inspiratory hold (Ih), end-inspiration (Ei), and end-expiration (Ef). This visualization is essential for understanding ventilator-patient synchrony, mechanical lung properties (compliance and resistance), and the functioning of pressure-triggered assisted ventilation modes.
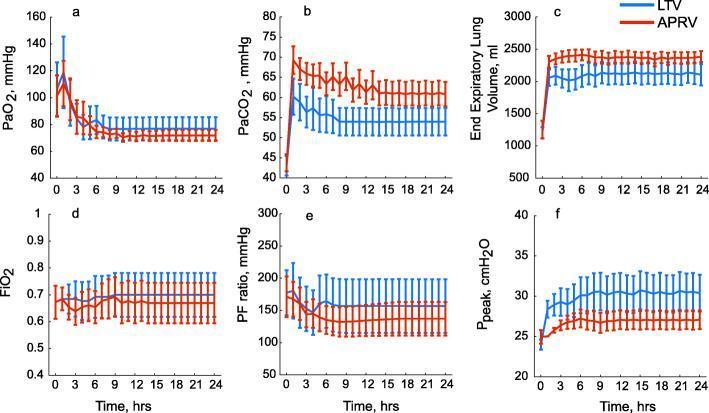
A series of six line graphs (labeled a–f) comparing two mechanical ventilation modes, Low Tidal Volume (LTV, blue) and Airway Pressure Release Ventilation (APRV, red), over a 24-hour timeline in a simulation of pulmonary blast lung injury. The graphs track key respiratory parameters: (a) PaO2, showing an initial decline before stabilizing around hour 9; (b) PaCO2, demonstrating higher levels in the APRV group; (c) End-Expiratory Lung Volume (EELV), which shows APRV maintains significantly higher functional residual capacity; (d) Fraction of inspired oxygen (FiO2), illustrating relatively high oxygen requirements for both modes; (e) P/F ratio, indicating stabilization of gas exchange; and (f) Peak Ventilatory Pressures (Ppeak), showing LTV requires higher pressures to maintain target volumes. Each data point includes error bars representing variance. The figure serves to compare the physiological impacts of different ventilatory strategies on oxygenation, ventilation efficiency, and lung recruitment in acute respiratory distress scenarios.
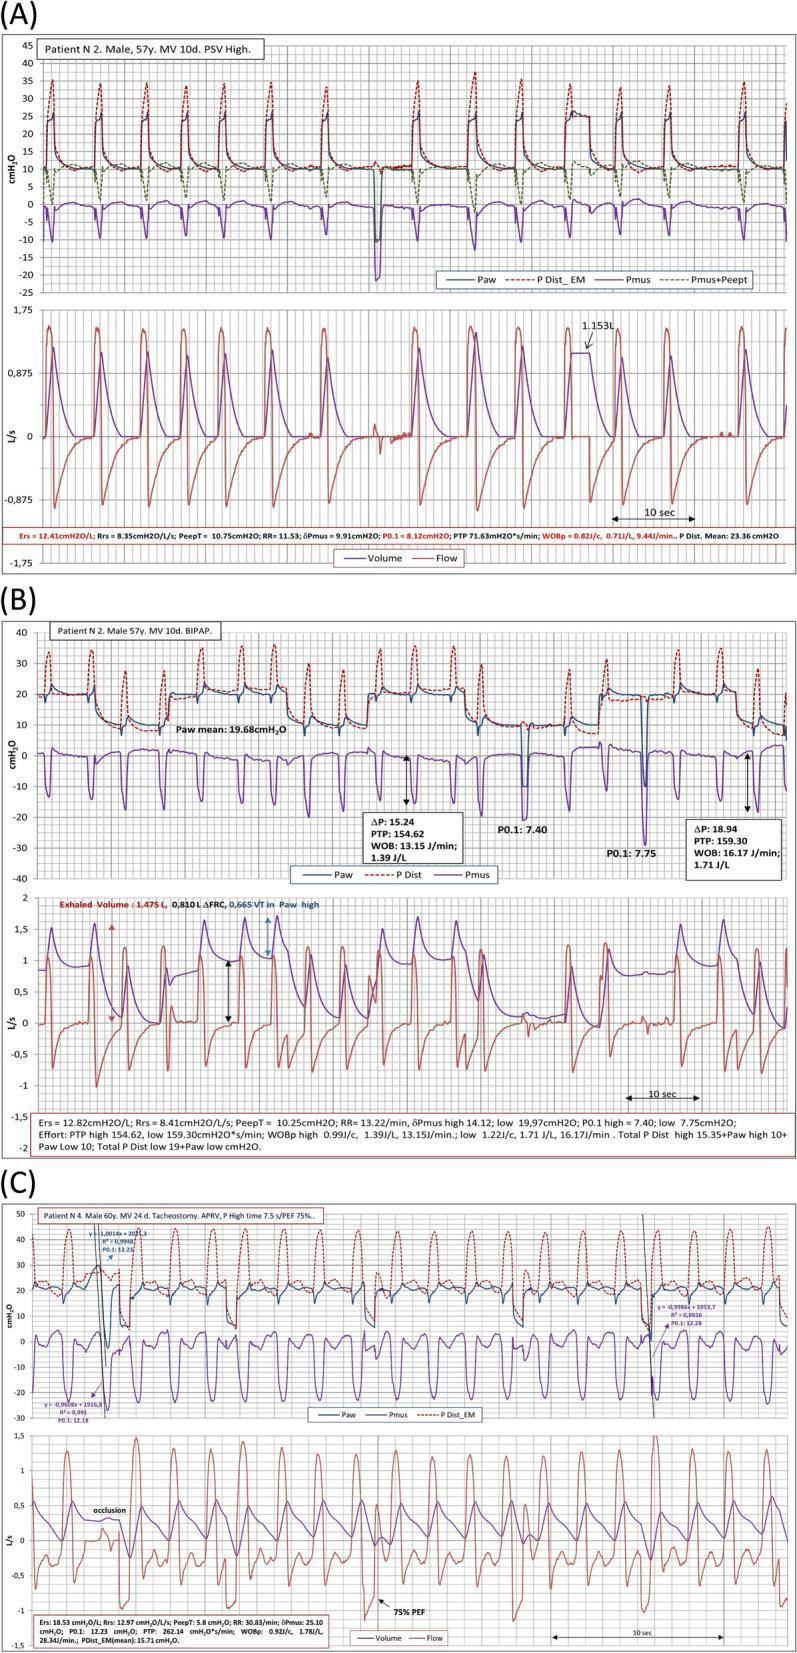
This physiological monitoring graphic displays mechanical ventilation waveforms across three distinct modes: Pressure Support Ventilation (PSV) in panel A, Biphasic Positive Airway Pressure (BIPAP) in panel B, and Airway Pressure Release Ventilation (APRV) in panel C. Each panel illustrates time-synced tracings of airway pressure (Paw), muscle pressure (Pmus), distending pressure (PDist_EM), flow (L/s), and tidal volume (L). In PSV (A), the waveforms show regular, patient-triggered breaths with stable tidal volumes and consistent Pmus deflections. BIPAP (B) reveals two levels of baseline pressure with significant spontaneous effort (negative Pmus) during the lower pressure phase, resulting in more variable flow and volume patterns. APRV (C) demonstrates prolonged high-pressure phases with brief releases, characterized by high respiratory drive and frequent, irregular spontaneous breathing efforts superimposed on the ventilator cycle. Key metrics provided below the graphs include respiratory system elastance (Ers), airway occlusion pressure (P0.1), and patient work of breathing (WOBp), used to analyze patient-ventilator synchrony and inspiratory effort in critically ill patients, such as those with COVID-19 ARDS.
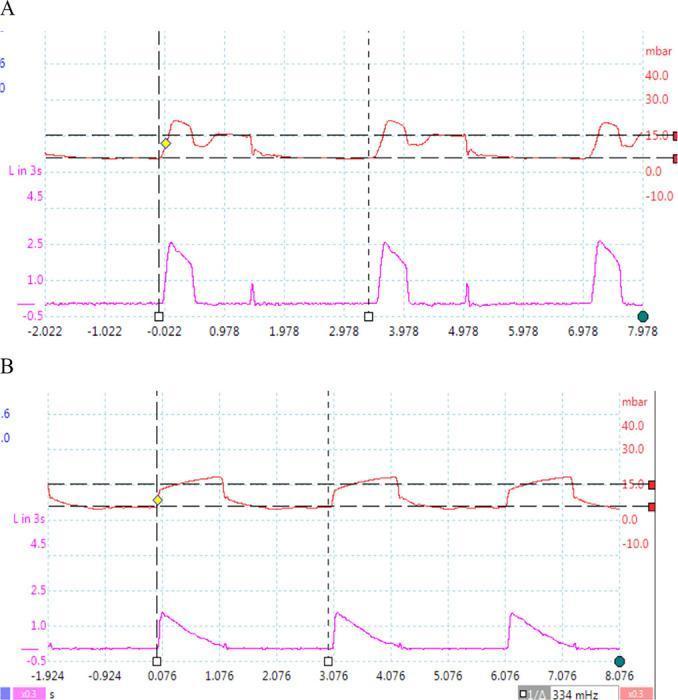
A comparison chart consisting of two sets of mechanical ventilation waveforms (pressure-time and flow-time curves) demonstrating different control variables. The upper panel (Ventilator 1) shows characteristics of volume-controlled ventilation, where the pressure curve (red) reaches a peak and then maintains a plateau, while the flow curve (purple) rises instantaneously and remains constant before falling, indicating a square flow waveform. The lower panel (Ventilator 2) illustrates pressure-controlled ventilation. In this mode, the pressure curve (red) rapidly rises to a set level (approximately 15 mbar) and maintains a plateau, while the flow curve (purple) shows a peak followed by a decelerating ramp pattern. Both panels show three respiratory cycles over an approximately 8-second window, with vertical dashed lines marking the start of inspiration. These waveforms are critical for respiratory therapy education to distinguish between volume-preset and pressure-preset mechanical ventilation strategies.
![This Comparison Chart displays synchronized respiratory waveforms over 40 seconds during volume-controlled mechanical ventilation. From top to bottom, the four graphs include: 1) Flow [l/min], showing inspiratory and expiratory phases with zero-flow plateaus during maneuvers. 2) Airway pressure (Paw [cmH2O]), highlighting 'Set PEEP', 'PEEPtot' during an expiratory pause, and 'Airway plateau pressure' and 'Airway driving pressure' during an inspiratory hold. 3) Esophageal pressure (Pes [cmH2O]), used as a surrogate for pleural pressure, showing end-expiratory/end-inspiratory values and minor cardiac artifacts. 4) Transpulmonary pressure (Plung [cmH2O]), calculated as Paw minus Pes, illustrating 'Transpulmonary driving pressure' and 'End-inspiratory transpulmonary pressure'. The visual illustrates critical bedside monitoring for Acute Respiratory Distress Syndrome (ARDS), focusing on lung mechanics, intrinsic PEEP, and the prevention of ventilator-induced lung injury (VILI) by quantifying driving pressures and plateau pressures through hold maneuvers.](https://cdn.orris.care/cdss_images/pmc_clinical_VQA_1099345286f128aad8b7d3b682adc5a15737e3b737170091be774aed96d94975.jpg)
This Comparison Chart displays synchronized respiratory waveforms over 40 seconds during volume-controlled mechanical ventilation. From top to bottom, the four graphs include: 1) Flow [l/min], showing inspiratory and expiratory phases with zero-flow plateaus during maneuvers. 2) Airway pressure (Paw [cmH2O]), highlighting 'Set PEEP', 'PEEPtot' during an expiratory pause, and 'Airway plateau pressure' and 'Airway driving pressure' during an inspiratory hold. 3) Esophageal pressure (Pes [cmH2O]), used as a surrogate for pleural pressure, showing end-expiratory/end-inspiratory values and minor cardiac artifacts. 4) Transpulmonary pressure (Plung [cmH2O]), calculated as Paw minus Pes, illustrating 'Transpulmonary driving pressure' and 'End-inspiratory transpulmonary pressure'. The visual illustrates critical bedside monitoring for Acute Respiratory Distress Syndrome (ARDS), focusing on lung mechanics, intrinsic PEEP, and the prevention of ventilator-induced lung injury (VILI) by quantifying driving pressures and plateau pressures through hold maneuvers.
🏥 Mechanical Ventilation: A Story You Won't Forget
The Story Begins: "The Rescue Team"
Imagine your lungs are tired workers at a factory. They've been working too hard and collapsed. The ICU is the emergency headquarters. The ventilator? That's the rescue team that steps in to do the breathing FOR them - or at least help them along.
🔑 Chapter 1: The Basic Settings - "The Knobs on the Control Panel"
| Setting | Plain English | Normal Value |
|---|---|---|
| Tidal Volume (Vt) | How big each breath is | 6-8 mL/kg ideal body weight |
| Respiratory Rate (RR) | How many breaths per minute | 12-20/min |
| PEEP | The pressure left in lungs after exhale (keeps alveoli open) | 5 cmH2O (baseline) |
| FiO2 | How much oxygen in each breath (21% = room air, 100% = pure O2) | Start at 100%, wean down |
Story: Think of PEEP as keeping the door to a room slightly open so it never slams completely shut. Without PEEP, the alveoli collapse like a deflated balloon every breath. PEEP = the doorstop.
📈 Chapter 2: The Graphs - "Reading the Ventilator Screen"
The Three Curves:
- Goes UP during inspiration, back DOWN during expiration
- Flat top = breath held (inspiratory hold maneuver)
- Normal: rises to ~500 mL, then falls back to zero
- Ptrig (trigger pressure): The small DIP below baseline - the patient "calls" for a breath here (-2 cmH2O)
- Ppeak (peak pressure): The highest point reached (~25 cmH2O) - includes airway resistance
- Pplateau (plateau pressure): The flat part after a breath hold (~22 cmH2O) - reflects TRUE lung pressure. KEEP THIS < 30 cmH2O to avoid lung injury
- PEEP: The baseline at the bottom (~5 cmH2O) - never goes to zero
- Positive = breathing IN (gas flowing toward patient)
- Negative = breathing OUT (gas flowing away from patient)
- Shape tells you the mode (square = volume control; decelerating = pressure control)
Story: The pressure-time graph is like a highway speed camera. Ppeak is the fastest you went. Pplateau is your cruising speed. PEEP is the minimum speed you never go below. If your cruising speed (plateau) goes above 30 - you're speeding into barotrauma territory.
🎮 Chapter 3: The Modes - "Different Rescue Strategies"
The Big Picture First:
- Who controls the breath SIZE? → Volume-controlled (you set Vt) OR Pressure-controlled (you set pressure, Vt varies)
- Who controls WHEN to breathe? → Fully machine (controlled) OR patient triggers + machine backs up
Mode 1: AC-VC (Assist Control - Volume Control)
Story: The factory is completely shut down. The rescue team does ALL the breathing. Every breath = same size, same rate. If the patient tries to breathe on their own, the machine STILL delivers the full set volume (just triggered earlier). Nobody gets a smaller-than-set breath.
- Tidal volume (e.g., 450 mL)
- Respiratory rate (e.g., 14/min)
- PEEP (e.g., 5 cmH2O)
- FiO2 (e.g., 60%)
- Inspiratory flow rate
- Peak pressure (Ppeak)
- Plateau pressure (Pplateau) - must stay < 30
Mode 2: AC-PC (Assist Control - Pressure Control)
Story: The rescue team still does all the breathing, but instead of delivering a fixed bucket of air (fixed volume), they just push the door open to a fixed pressure. Whatever air fits at that pressure - that's the breath. If the lung is stiff today, less air fits. If it's more compliant tomorrow, more air fits.
- Inspiratory PRESSURE (e.g., 15 cmH2O above PEEP)
- Respiratory rate
- PEEP
- FiO2
- Tidal volume (it CHANGES with lung compliance - watch it!)
- Minute ventilation
Mode 3: PRVC (Pressure-Regulated Volume Control)
Story: This is the rescue team using a smart robot. You tell it "deliver 450 mL each breath" - but instead of using a fixed flow, it automatically adjusts the pressure breath by breath to deliver exactly that volume. If the lung gets stiffer, the robot pushes harder. If the lung loosens up, it eases off.
Mode 4: PSV (Pressure Support Ventilation)
Story: The workers (lungs) are getting better and trying to do some work again. The rescue team doesn't take over - they just give a "boost" to every breath the patient initiates. Patient breathes in, machine adds a pressure boost (e.g., +10 cmH2O). Patient controls the rate, the depth, the timing.
- Pressure support level (e.g., 10-20 cmH2O)
- PEEP
- FiO2
The golden weaning path: AC-VC → PSV → extubation
Mode 5: SIMV (Synchronized Intermittent Mandatory Ventilation)
Story: The rescue team gives 10 mandatory breaths per minute on a schedule. In between those scheduled breaths, the patient can breathe on their own (usually with pressure support). The machine "synchronizes" mandatory breaths with patient effort to avoid double-stacking.
Mode 6: APRV (Airway Pressure Release Ventilation)
Story: Instead of giving breaths in and out like normal, APRV keeps the lungs INFLATED at a high pressure for a long time (like taking a deep breath and holding it), then briefly RELEASES to a low pressure to let CO2 out, then immediately goes back up. It's like: HOLD... HOLD... HOLD... quick puff out... HOLD... HOLD...
- P-High: The high CPAP level (e.g., 25-28 cmH2O) - ensures oxygenation
- T-High: How long it stays at high pressure (e.g., 4-6 seconds)
- P-Low: The release pressure (usually set to 0)
- T-Low: Brief release time (e.g., 0.4-0.8 seconds) - allows CO2 removal but NOT full derecruitment
🎯 Chapter 4: The Critical Numbers to Memorize
"The ICU Commandments"
| Parameter | Target | Why |
|---|---|---|
| Plateau pressure | < 30 cmH2O | Prevents barotrauma + volutrauma |
| Driving pressure (Pplateau - PEEP) | < 15 cmH2O | Key ARDS survival predictor |
| Tidal volume | 6 mL/kg IBW (ARDS) | Lung protective ventilation |
| SpO2 | 92-96% | Avoid both hypoxia and hyperoxia |
| pH | 7.35-7.45 | Adjust RR to control CO2 |
| PEEP | Titrate to oxygenation | ARDSnet tables guide this |
🔍 Chapter 5: Peak vs. Plateau Pressure - "The Detective Test"
Story: Your pressure alarm goes off. Peak pressure = 45 cmH2O. Is this dangerous? Do the DETECTIVE TEST - an inspiratory hold (pause at end of breath, zero flow).
High PEAK Pressure → Do Inspiratory Hold

Plateau < 30 cmH2O?     Plateau ≥ 30 cmH2O?
        ↓                        ↓
 HIGH RESISTANCE          HIGH COMPLIANCE PROBLEM
 (kinked tube,            (stiff lungs, pneumothorax,
  bronchospasm,            ARDS, pulmonary edema)
  secretions,
  biting tube)
📖 Chapter 6: Weaning - "The Exit Strategy"
- Reduce sedation
- Put patient on PSV 5/5 (PS = 5, PEEP = 5) or T-piece
- Watch for 30-120 minutes
- Pass criteria: RR < 35, SpO2 > 90%, no distress, HR/BP stable
- Calculate RSBI (Rapid Shallow Breathing Index) = RR ÷ Vt (in liters)
- RSBI < 105 = likely to succeed extubation
- RSBI > 105 = patient not ready yet
🧠 Quick Mode Summary - "The Cheat Sheet"
| Mode | Who controls rate? | Who controls size? | Use case |
|---|---|---|---|
| AC-VC | Machine (+ patient triggers) | Machine (fixed Vt) | Acute failure, sedated, ARDS |
| AC-PC | Machine (+ patient triggers) | Machine (fixed P, variable Vt) | High pressure concern |
| PRVC | Machine (+ patient triggers) | Smart machine (auto-adjusts P to guarantee Vt) | Best synchrony + volume guarantee |
| PSV | PATIENT | PATIENT | Weaning, awake, cooperative |
| SIMV | Split | Split | Mostly outdated |
| APRV | Machine | Via pressure release | Severe ARDS |
Sources: Harrison's Principles of Internal Medicine 22E (2025), Sabiston Textbook of Surgery, Current Surgical Therapy 14e. All waveform images from the medical image library.