I now have all the images and information needed. Let me compile the complete guide.
Complete Guide to Reading an ECG and CT Scan
PART 1: HOW TO READ AN ECG (ELECTROCARDIOGRAM)
What is an ECG?
An ECG records the electrical activity of the heart across multiple leads simultaneously. A standard 12-lead ECG uses 10 electrodes to generate 12 different "views" of the heart. Paper speed is 25 mm/second. Each small square = 0.04 seconds (40 ms), and each large square = 0.2 seconds (200 ms).
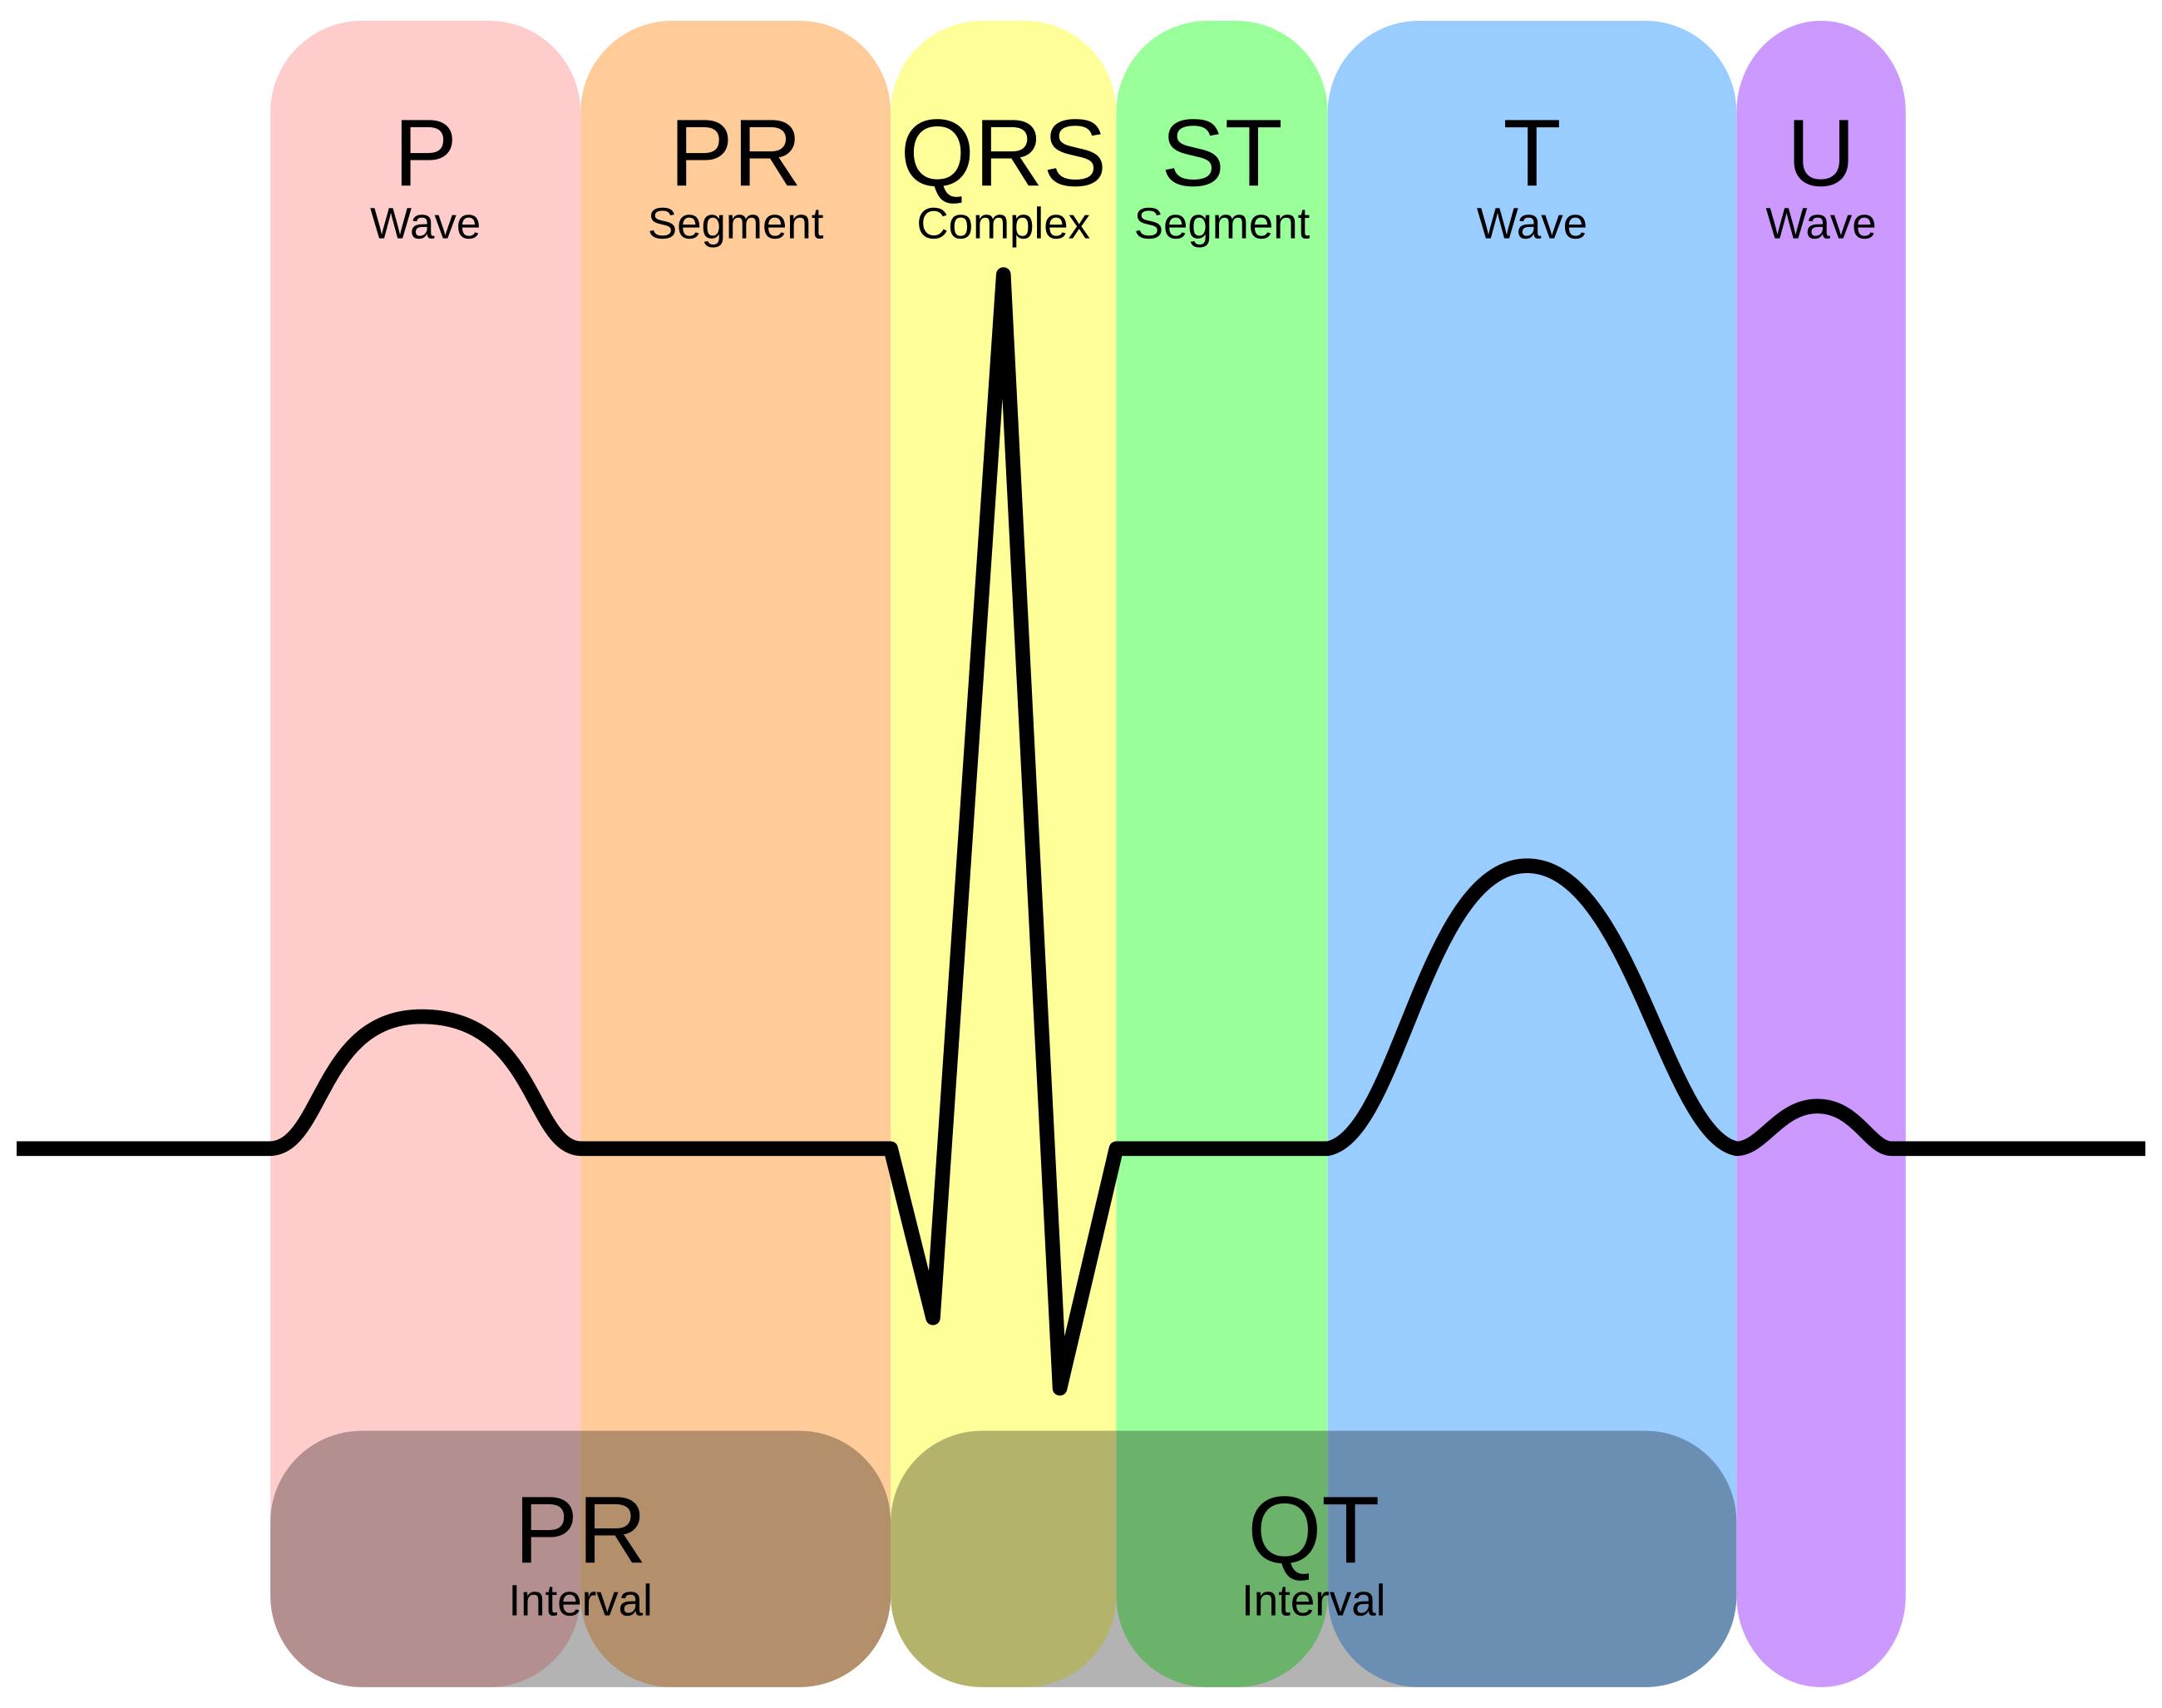
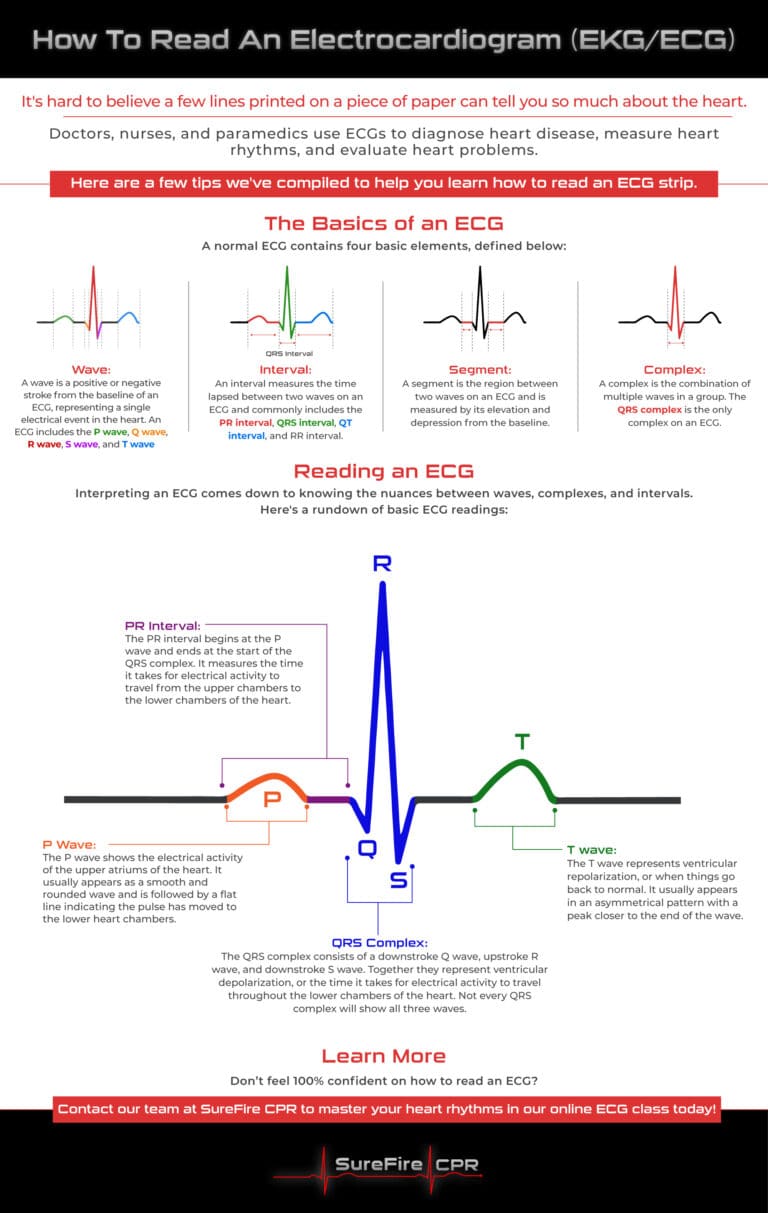
The Basics: ECG Waveforms and Components
Every heartbeat produces a characteristic pattern:
| Component | Represents | Normal Duration |
|---|
| P wave | Atrial depolarization (SA node fires, atria contract) | 0.06 - 0.12 sec |
| PR segment | Electrical pause at AV node | - |
| PR interval | Start of P to start of QRS | 0.12 - 0.20 sec |
| QRS complex | Ventricular depolarization (ventricles contract) | < 0.12 sec (< 3 small boxes) |
| ST segment | Early ventricular repolarization (isoelectric normally) | Should be flat at baseline |
| T wave | Ventricular repolarization | 0.10 - 0.25 sec |
| QT interval | Total ventricular depolarization + repolarization | < 0.44 sec (corrected QTc) |
| U wave | Repolarization of Purkinje fibers (often absent) | Small, follows T wave |
Step-by-Step ECG Interpretation System
Use the mnemonic RRAPST - Rate, Rhythm, Axis, PR, ST/T, Summary.
STEP 1 - RATE
Method 1 (Regular rhythms): Count large squares between two R waves and divide 300 by that number.
- 1 large box = 300 bpm
- 2 large boxes = 150 bpm
- 3 large boxes = 100 bpm
- 4 large boxes = 75 bpm
- 5 large boxes = 60 bpm
- 6 large boxes = 50 bpm
Method 2 (Irregular rhythms): Count the number of QRS complexes in a 10-second strip (30 large boxes) and multiply by 6.
| Rate Category | BPM |
|---|
| Normal (sinus) | 60-100 |
| Bradycardia | < 60 |
| Tachycardia | > 100 |
STEP 2 - RHYTHM
Ask yourself 3 questions:
- Are there P waves before every QRS?
- Are the R-R intervals regular?
- Is the QRS narrow (< 0.12 sec = supraventricular) or wide (>= 0.12 sec = ventricular origin or aberrant conduction)?
Normal sinus rhythm: P wave before every QRS, rate 60-100, regular R-R intervals.
Common rhythm abnormalities:
- Sinus bradycardia: Normal P-QRS-T, rate < 60
- Sinus tachycardia: Normal P-QRS-T, rate > 100
- Atrial fibrillation (AF): No visible P waves, irregularly irregular R-R intervals, "fibrillatory baseline"
- Atrial flutter: Sawtooth P waves (flutter waves) at ~300/min, typically 2:1 or 4:1 block giving ventricular rate of 150 or 75
- Ventricular tachycardia (VT): Wide, bizarre QRS > 0.12 sec, no P waves, rate > 100 - life threatening
- Ventricular fibrillation (VF): Chaotic, no recognizable complexes - cardiac arrest
STEP 3 - AXIS
Look at leads I and aVF:
| Lead I | Lead aVF | Axis |
|---|
| Positive (up) | Positive (up) | Normal (-30° to +90°) |
| Positive (up) | Negative (down) | Left axis deviation (LAD) |
| Negative (down) | Positive (up) | Right axis deviation (RAD) |
| Negative (down) | Negative (down) | Extreme axis deviation ("northwest") |
LAD causes: Left bundle branch block (LBBB), left anterior fascicular block, inferior MI, left ventricular hypertrophy.
RAD causes: Right ventricular hypertrophy, pulmonary embolism, RBBB, left posterior fascicular block.
STEP 4 - ELECTRODE PLACEMENT AND TERRITORIES
Limb leads (frontal plane):
- Lead I: Right arm (-) to Left arm (+)
- Lead II: Right arm (-) to Left leg (+)
- Lead III: Left arm (-) to Left leg (+)
- aVR: Augmented - looks at the heart from the right shoulder
- aVL: Augmented - looks from the left shoulder
- aVF: Augmented - looks from the feet (inferior)
Precordial leads (horizontal plane) - V1 to V6:
- V1: Right side of sternum, 4th intercostal space
- V2: Left side of sternum, 4th intercostal space
- V3: Between V2 and V4
- V4: Midclavicular line, 5th intercostal space
- V5: Anterior axillary line (same level as V4)
- V6: Midaxillary line (same level as V4-V5)
Coronary territory mapping (critical for ischemia):
| Territory | Leads | Coronary Artery |
|---|
| Inferior | II, III, aVF | Right coronary artery (RCA) |
| Lateral | I, aVL, V5, V6 | Left circumflex (LCx) |
| Anterior | V1-V4 | Left anterior descending (LAD) |
| Septal | V1-V2 | LAD septal branches |
| Posterior | Tall R in V1-V2 with ST depression | RCA or LCx |
| Right ventricular | V1, V4R | RCA proximal |
STEP 5 - P WAVES AND PR INTERVAL (AV Conduction)
P wave abnormalities:
- Right atrial enlargement (RAE): Tall peaked P wave > 2.5 mm in lead II ("P pulmonale")
- Left atrial enlargement (LAE): Broad notched P wave > 0.12 sec in lead II ("P mitrale"), biphasic P in V1
PR interval abnormalities (AV blocks):
| Finding | Duration | Diagnosis |
|---|
| Short PR + delta wave | < 0.12 sec | Wolff-Parkinson-White (WPW) - pre-excitation |
| Prolonged PR (constant) | > 0.20 sec | 1st degree AV block |
| Progressively lengthening PR until drop | Varies | 2nd degree AV block, Mobitz type I (Wenckebach) |
| Constant PR then random dropped QRS | > 0.20 sec | 2nd degree AV block, Mobitz type II |
| No relationship between P and QRS | - | 3rd degree (complete) AV block - emergency |
STEP 6 - QRS COMPLEX (Bundle Branches)
Bundle branch blocks (QRS > 0.12 sec = 3+ small boxes):
Use the WiLLiaM MaRRoW rule with V1 and V6:
- LBBB (Left BBB): W-shape in V1, M-shape in V6 - "WiLLiaM"
- RBBB (Right BBB): M-shape in V1 (RSR' pattern = "rabbit ears"), W-shape in V6 - "MaRRoW"
Ventricular hypertrophy:
- LVH (Left Ventricular Hypertrophy): S in V1 + R in V5 or V6 > 35 mm (Sokolow-Lyon criteria); or R in aVL > 11 mm
- RVH (Right Ventricular Hypertrophy): Dominant R in V1 (R > S), RAD, right "strain" pattern (T inversion V1-V3)
Pathological Q waves:
- Width > 1 small box (0.04 sec) OR depth > 1/3 of QRS height
- Represent prior myocardial infarction (transmural necrosis)
- Location tells you which territory was affected
STEP 7 - ST SEGMENT AND T WAVES (Ischemia)
This is the most time-critical step.
ST elevation (STEMI criteria):
- New ST elevation ≥ 1 mm (0.1 mV) in 2 or more contiguous limb leads
- New ST elevation ≥ 2 mm (0.2 mV) in 2 or more contiguous precordial leads
- In men < 40: ≥ 2.5 mm in V2-V3
- ST elevation is convex upward ("tombstone" or "domed")
Reciprocal changes: ST depression in leads anatomically opposite the infarct territory (confirms STEMI, not pericarditis).
ST depression (subendocardial ischemia / NSTEMI):
- Horizontal or downsloping ST depression ≥ 0.5-1 mm in 2+ contiguous leads
- Upsloping depression is less specific
T wave changes:
- Peaked/hyperacute T waves: Very early ischemia (before ST elevation develops)
- T wave inversion: Ischemia, ventricular strain, CNS events, PE (lead III + V1)
- Biphasic T waves: Wellens syndrome (critical LAD stenosis - T waves go positive-negative or negative-positive in V2-V3)
Pericarditis (vs. STEMI):
- Diffuse ST elevation in ALL leads (no territory)
- PR depression (pathognomonic)
- Saddle-shaped ST elevation
- No reciprocal changes
Other important patterns:
- Hyperkalemia: Peaked T waves → widened QRS → sine wave pattern
- Hypokalemia: Flattened T waves, prominent U waves, prolonged QT
- Hypercalcemia: Short QT interval
- Hypocalcemia: Long QT interval
- Pulmonary embolism: S1Q3T3 pattern (S wave in I, Q wave and T inversion in III) + sinus tachycardia + RBBB
STEP 8 - QT INTERVAL
- Measure from start of QRS to end of T wave
- Must correct for heart rate: use Bazett's formula: QTc = QT / √(RR interval in seconds)
- Normal QTc: < 440 ms (men), < 460 ms (women)
- Prolonged QTc risk: Torsades de pointes → VF → sudden death
- Causes: Drugs (quinidine, amiodarone, haloperidol, methadone, some antibiotics), electrolyte disorders, congenital long QT syndromes
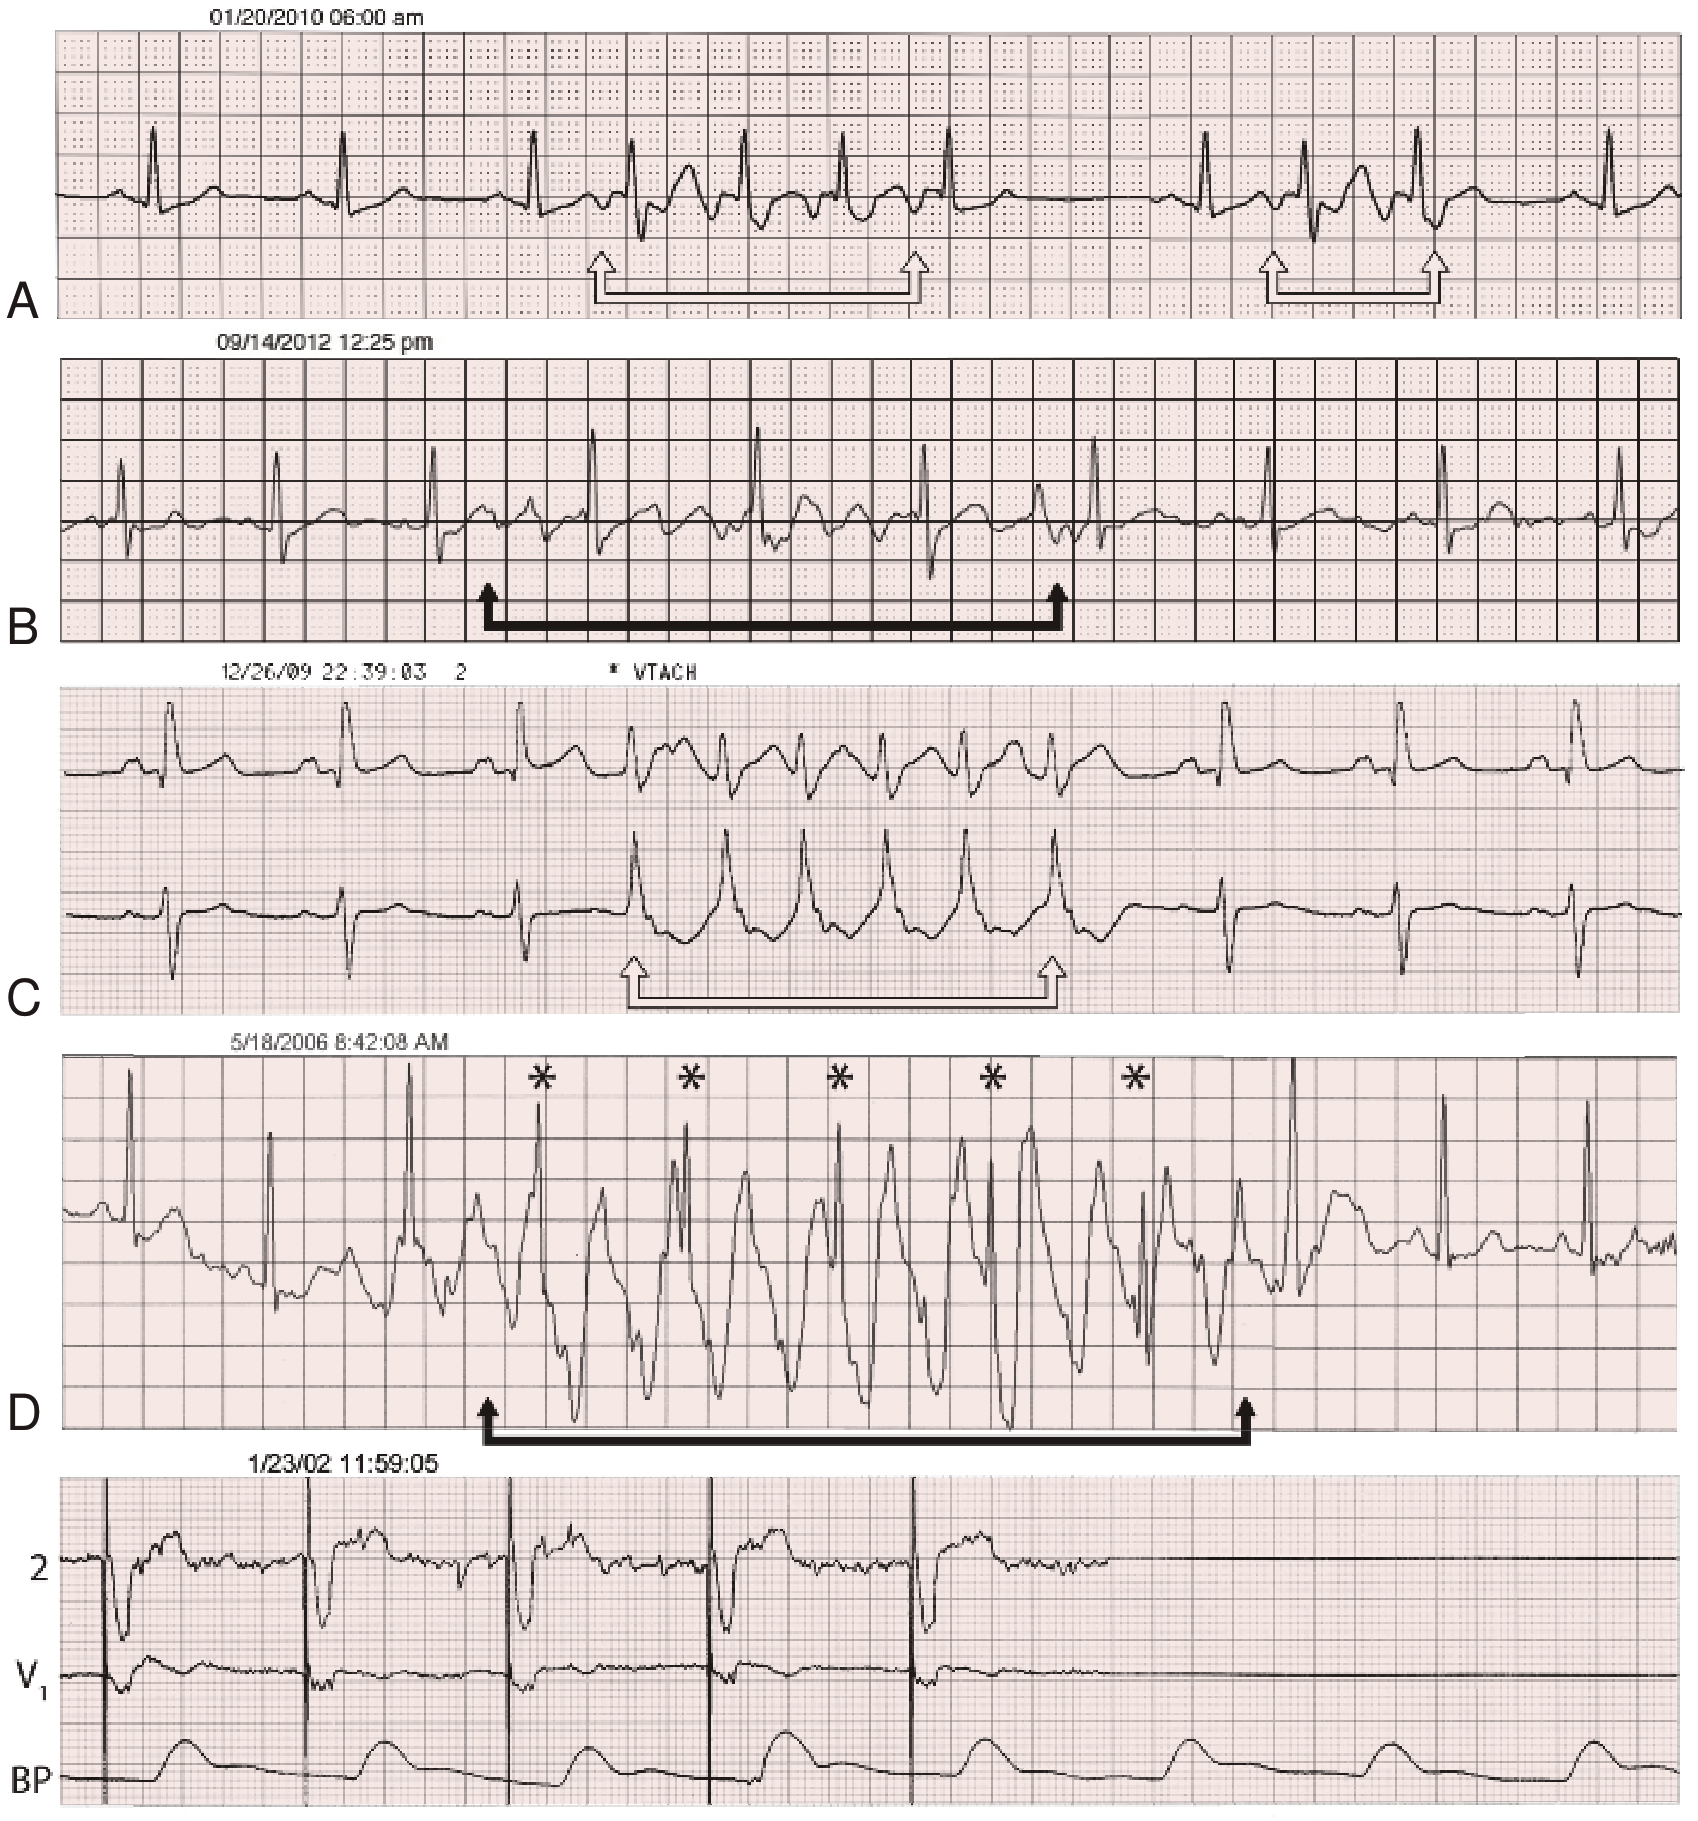
Textbook ECG Strip Examples from Braunwald's Heart Disease
Examples: A = Sinus rhythm with short atrial tachycardia episodes. B = Pseudo-atrial arrhythmia (artifact). C = Nonsustained VT (wide rapid QRS without preceding P wave). D = Pseudo-VT (artifact with preserved sinus rhythm). E = Pseudo-pacemaker failure. - Braunwald's Heart Disease
PART 2: HOW TO READ A CT SCAN
What is a CT Scan?
A CT (Computed Tomography) scan uses rotating X-ray beams and computer algorithms to reconstruct cross-sectional "slice" images of the body. Images are viewed in the axial (horizontal), coronal (front-back), and sagittal (side) planes. The patient is viewed from below (feet-first orientation) - so the right side of the patient appears on the LEFT of the image.
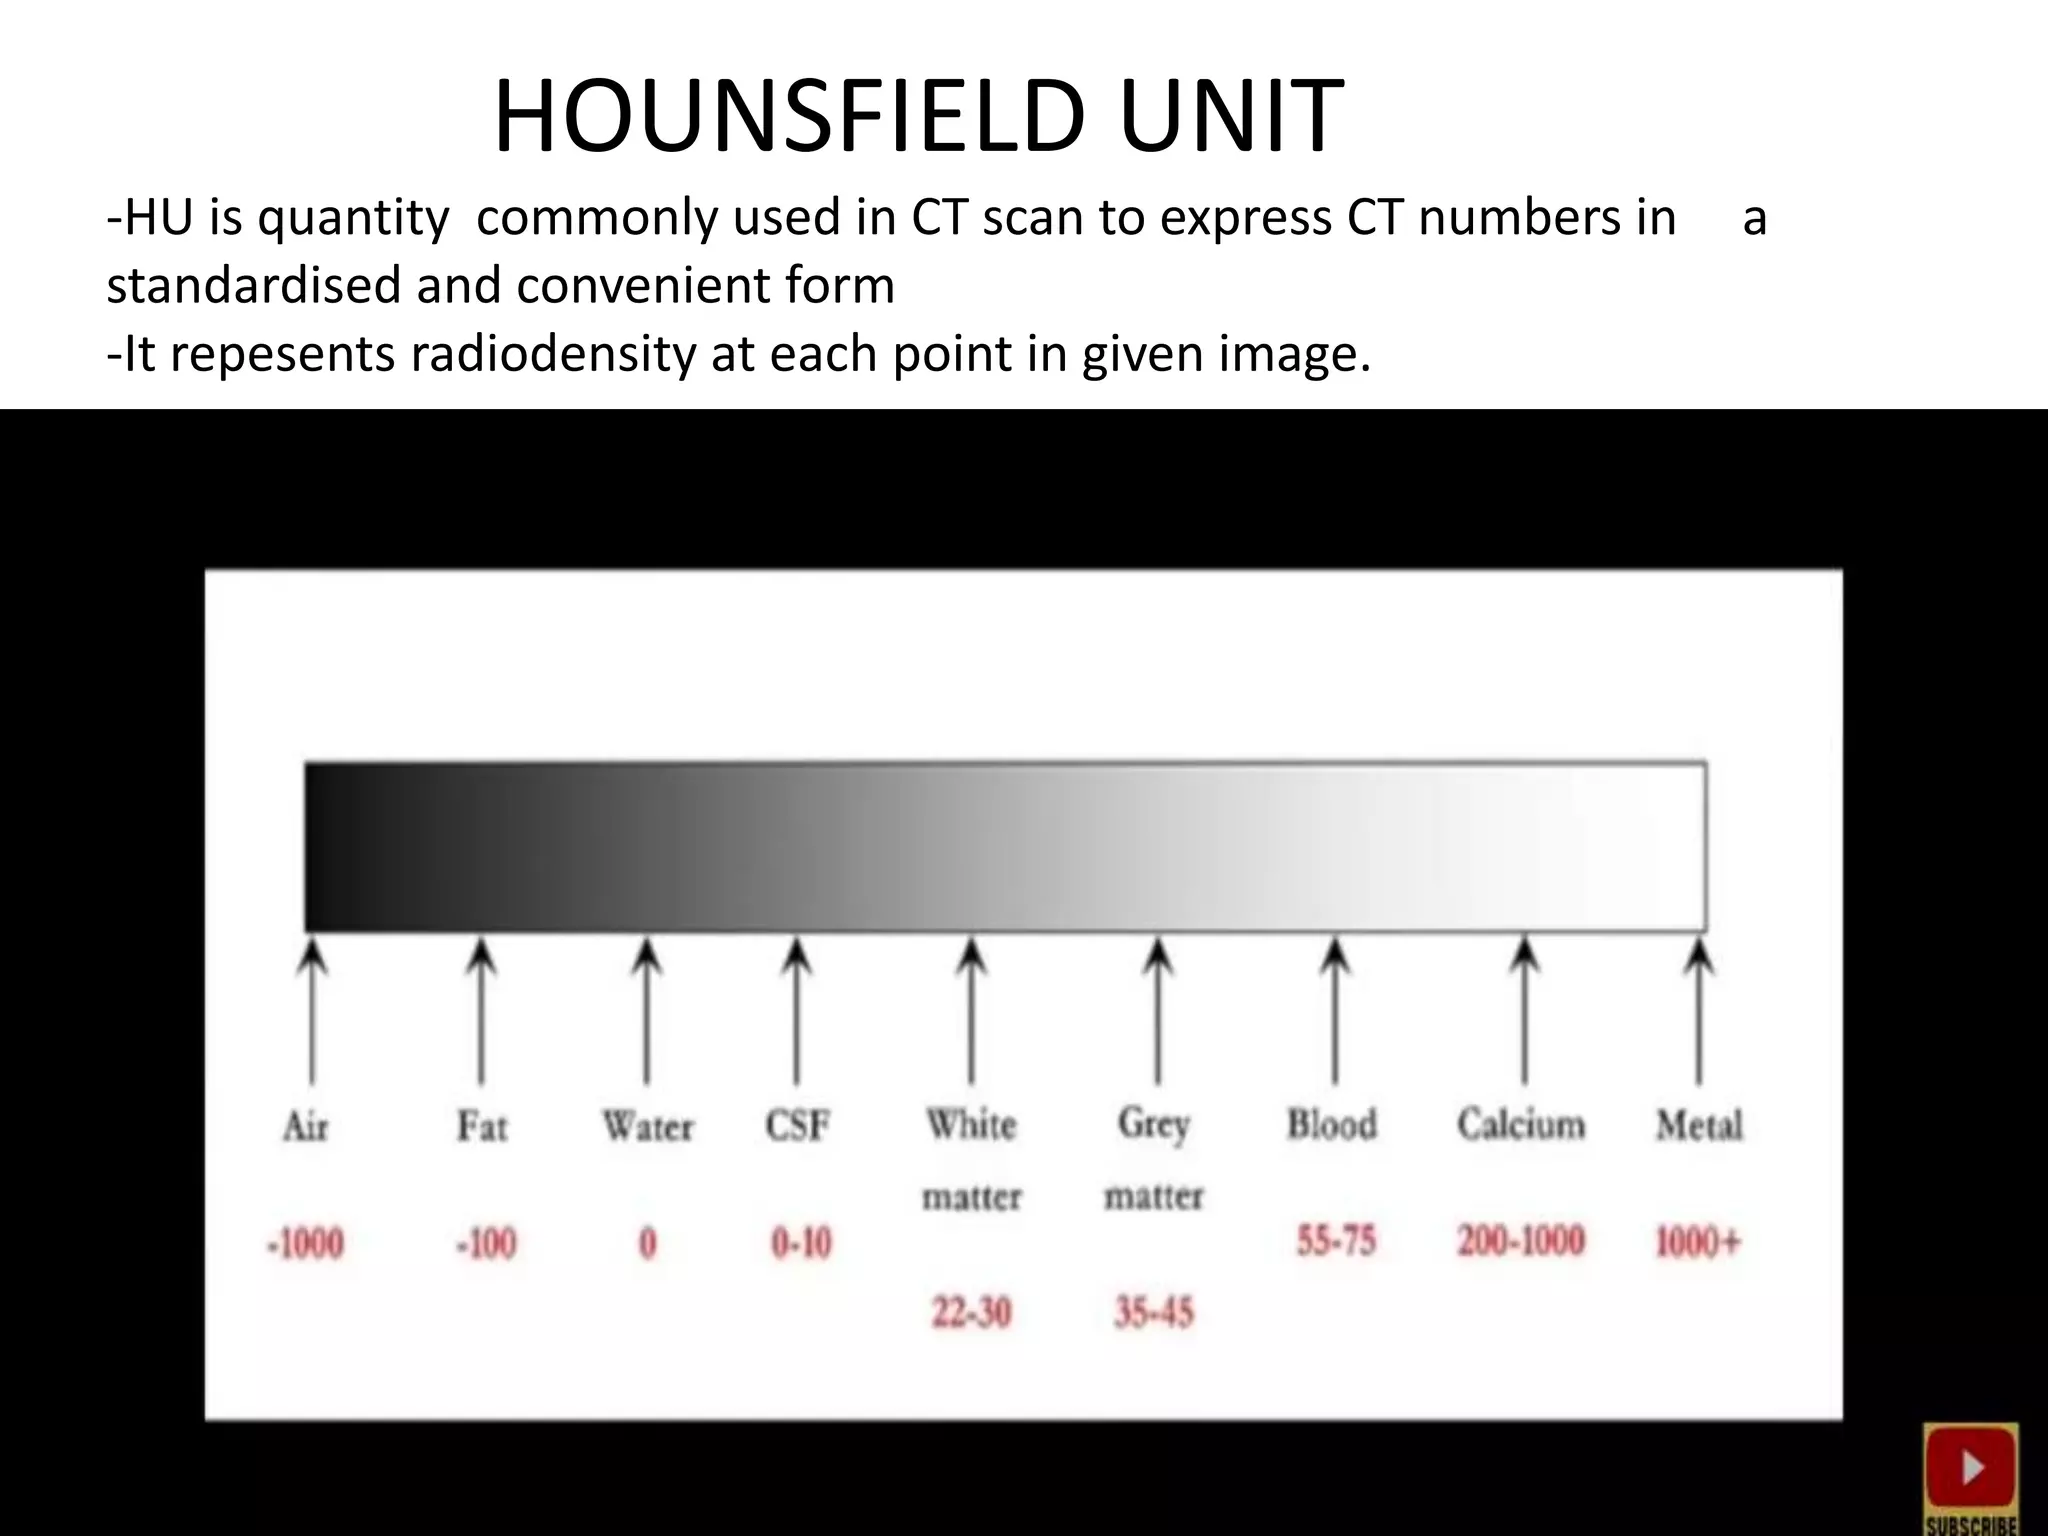
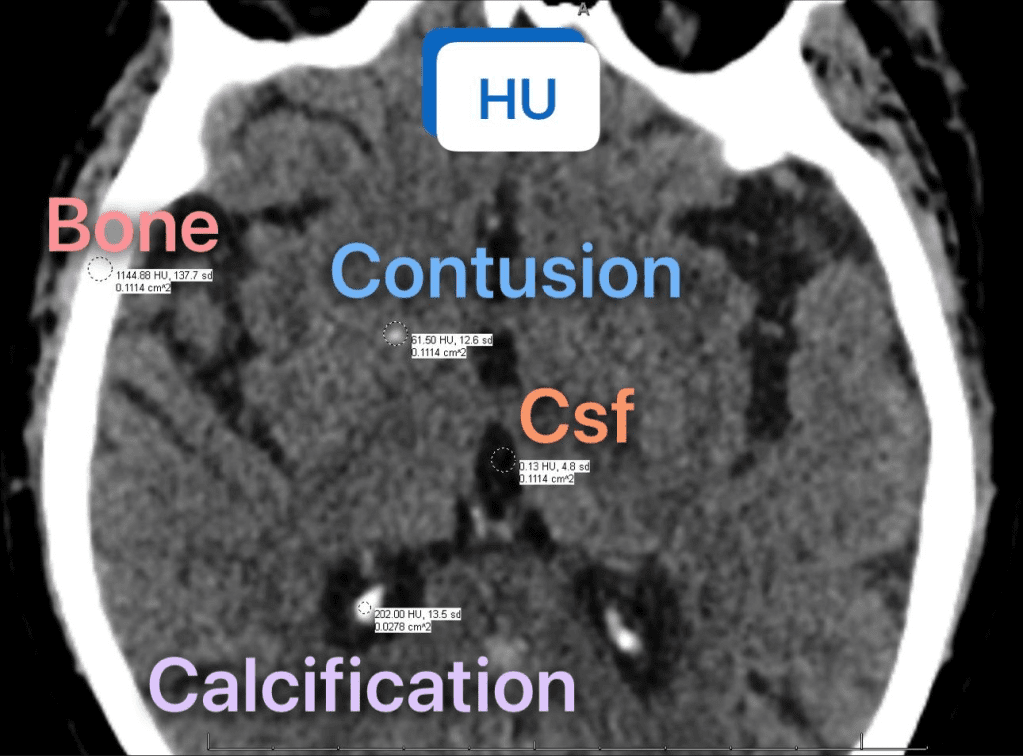
STEP 1 - Understand Hounsfield Units (HU)
Every tissue has a characteristic density measured in Hounsfield Units. This is the foundation of CT interpretation:
| Tissue | HU Range | Appears on CT |
|---|
| Air | -1000 | Black |
| Lung parenchyma | -700 to -600 | Dark black |
| Fat | -120 to -90 | Dark grey/black |
| Water / CSF | 0 to +10 | Grey |
| Brain white matter | +22 to +30 | Light grey |
| Brain grey matter | +35 to +45 | Slightly darker grey |
| Blood (unclotted) | +13 to +50 | Grey |
| Acute blood (clotted) | +55 to +75 | Bright white |
| Soft tissue / muscle | +35 to +55 | Medium grey |
| Bone | +700 to +3000 | Bright white |
| Metal implants | > +3000 | Extremely bright white |
| Contrast agent (iodine) | +100 to +400 | Bright white |
Key rule: Dense structures are WHITE (hyperdense). Less dense structures are BLACK (hypodense). Water is the reference (0 HU = grey).
STEP 2 - Understand CT Windowing
Because the human eye can only distinguish ~16 shades of grey, CT "windows" are used to optimize viewing of specific tissues. The window width (WW) sets the range of HU displayed; the window level (WL) sets the center of that range.
| Window | WW | WL | What you see |
|---|
| Brain / soft tissue | 80 | +40 | Brain parenchyma, blood |
| Subdural | 200 | +60 | Subdural bleeds |
| Bone | 2500 | +500 | Skull fractures, bony detail |
| Lung | 1500 | -600 | Lung parenchyma, airways |
| Mediastinal | 400 | +40 | Mediastinum, heart, vessels, lymph nodes |
| Abdomen / soft tissue | 350 | +50 | Abdominal organs |
| Liver | 150 | +60 | Subtle liver lesions |
Practical rule: Always look at each CT with MULTIPLE windows. A chest CT should be viewed in both lung and mediastinal windows. A head CT should be viewed in brain, subdural, and bone windows.
STEP 3 - Reading a CT Head (Brain)
Orientation: Axial slices, inferior to superior. Right side of patient = LEFT side of image.
Normal brain CT - what to identify:
- Sulci and gyri symmetry
- Grey/white matter differentiation
- Ventricular system (lateral ventricles, 3rd ventricle, 4th ventricle) - should be symmetric
- Cisterns (basal cisterns around brainstem)
- Midline structures - no shift should be present
Systematic approach (use the ABC/2 method as backup):
- Blood - any hyperdense (white) areas in the parenchyma, subarachnoid space, ventricles, or extra-axial spaces?
- Brain - grey/white differentiation preserved? Any areas of hypo- or hyperdensity?
- CSF spaces - ventricles and sulci normal? Midline shift?
- Bone - skull fractures, erosions?
Key pathological findings on CT head:
| Finding | Appearance | Diagnosis |
|---|
| Hyperdense (white) lenticular/biconvex extra-axial collection | Acute blood between skull and dura | Epidural hematoma - does NOT cross sutures |
| Hyperdense crescent-shaped extra-axial collection | Acute blood between dura and brain | Acute subdural hematoma - crosses sutures |
| Hypodense crescent-shaped collection | Chronic blood (> 3 weeks) | Chronic subdural hematoma |
| Hyperdense material in sulci, cisterns | Blood in subarachnoid space | Subarachnoid hemorrhage (SAH) |
| Hyperdense area within brain parenchyma | Intraparenchymal blood | Intracerebral hemorrhage |
| Wedge-shaped hypodense area matching territory | Absent blood flow → low density | Ischemic stroke (may be invisible in first 6 hours) |
| Loss of grey/white differentiation, dense MCA sign | Early ischemia signs | Acute large vessel occlusion |
| Midline shift | Asymmetric brain hemispheres | Mass effect - herniation risk |
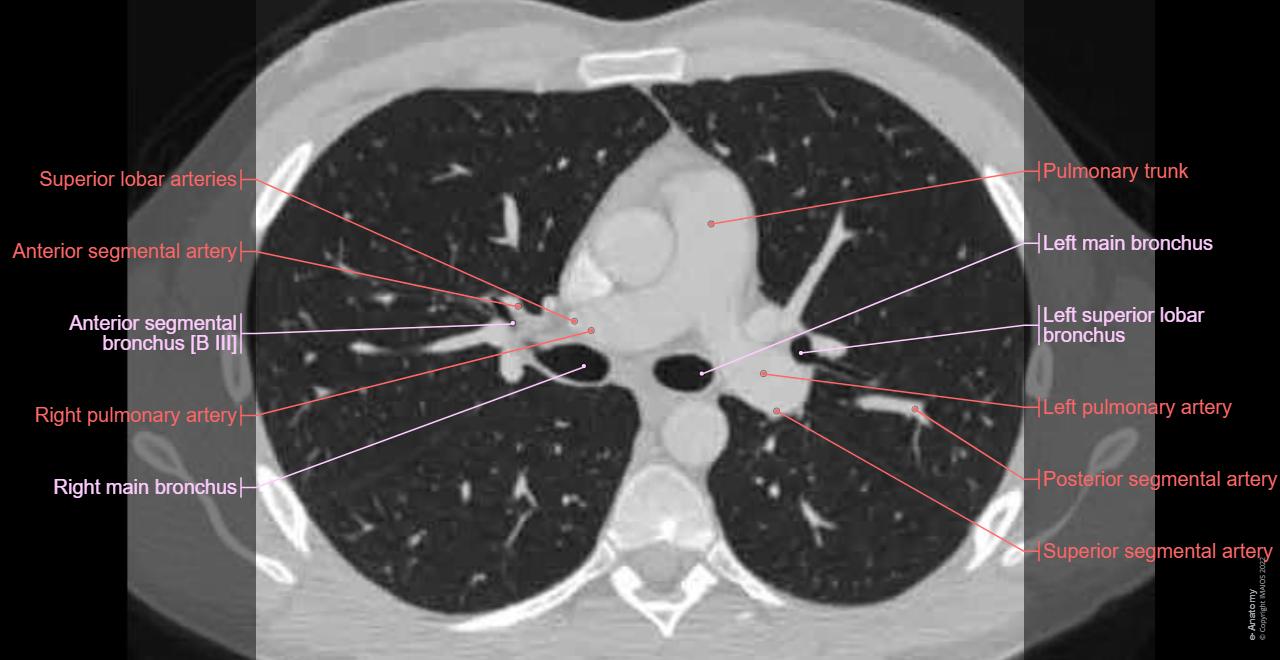
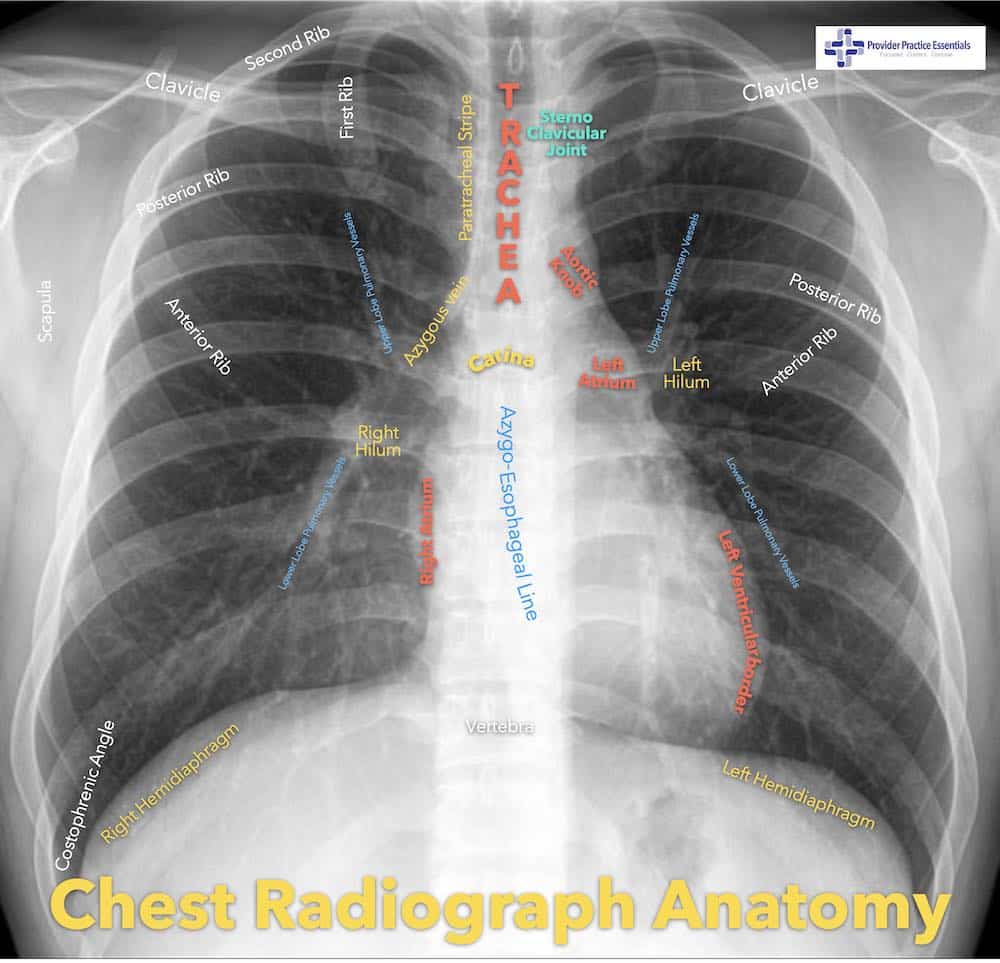
STEP 4 - Reading a CT Chest (Thorax)
Always view with BOTH lung windows AND mediastinal windows.
Systematic approach:
A. Lung window (WW 1500, WL -600):
- Lung parenchyma: Any areas of increased density (consolidation, ground-glass opacity, nodules)?
- Airways: Trachea central? Bronchi visible to 3rd/4th generation?
- Pleura: Any pleural effusion (hypodense fluid tracking dependent), pneumothorax (hypodense rim with no lung markings)?
- Fissures: Major (oblique) and minor (horizontal) fissures visible?
B. Mediastinal window (WW 400, WL +40):
- Mediastinum: Widened? (> 8 cm at aortic arch suggests aortic dissection)
- Heart: Size, pericardial effusion?
- Great vessels: Aorta - diameter, dissection flap?
- Lymph nodes: Short axis > 10 mm is abnormal
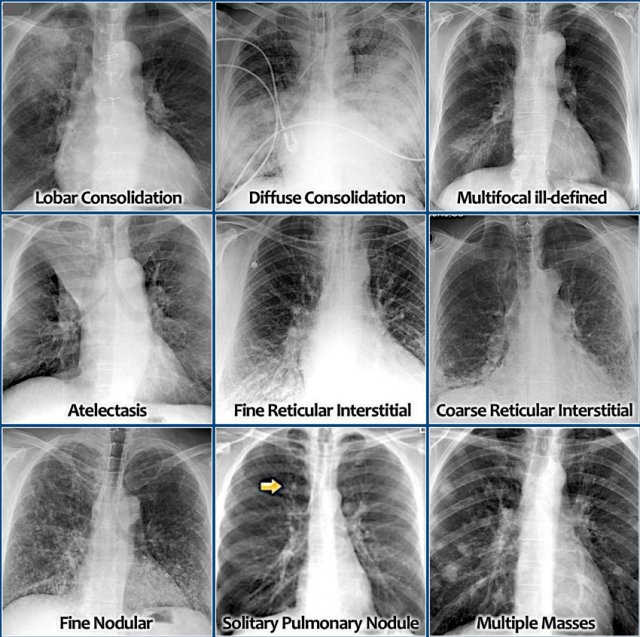
Key chest CT pathologies:
| Finding | CT Appearance | Diagnosis |
|---|
| Ground-glass opacity | Hazy increased density, vessels still visible | Infection (pneumonia), pulmonary edema, early fibrosis |
| Consolidation | Solid white area, air bronchograms visible | Pneumonia, lobar collapse |
| Pleural effusion | Dependent hypodense fluid (black), usually bilateral | Heart failure, infection, malignancy |
| Pneumothorax | Black rim between chest wall and lung edge on LUNG window | Spontaneous or traumatic |
| PE (pulmonary embolism) | Filling defect (dark) within bright contrast-enhanced pulmonary artery | Pulmonary embolism |
| Pulmonary nodule | Discrete rounded opacity | Benign (< 6 mm, smooth, calcified) vs. malignant (> 8 mm, irregular, spiculated) |
| Honeycombing + traction bronchiectasis | Cystic spaces in lung bases | Pulmonary fibrosis (ILD) |
| "Tree-in-bud" pattern | Centrilobular nodules + branching | Endobronchial spread of infection (TB, atypical) |
| Saddle embolus | Filling defect straddling pulmonary artery bifurcation | Massive PE |
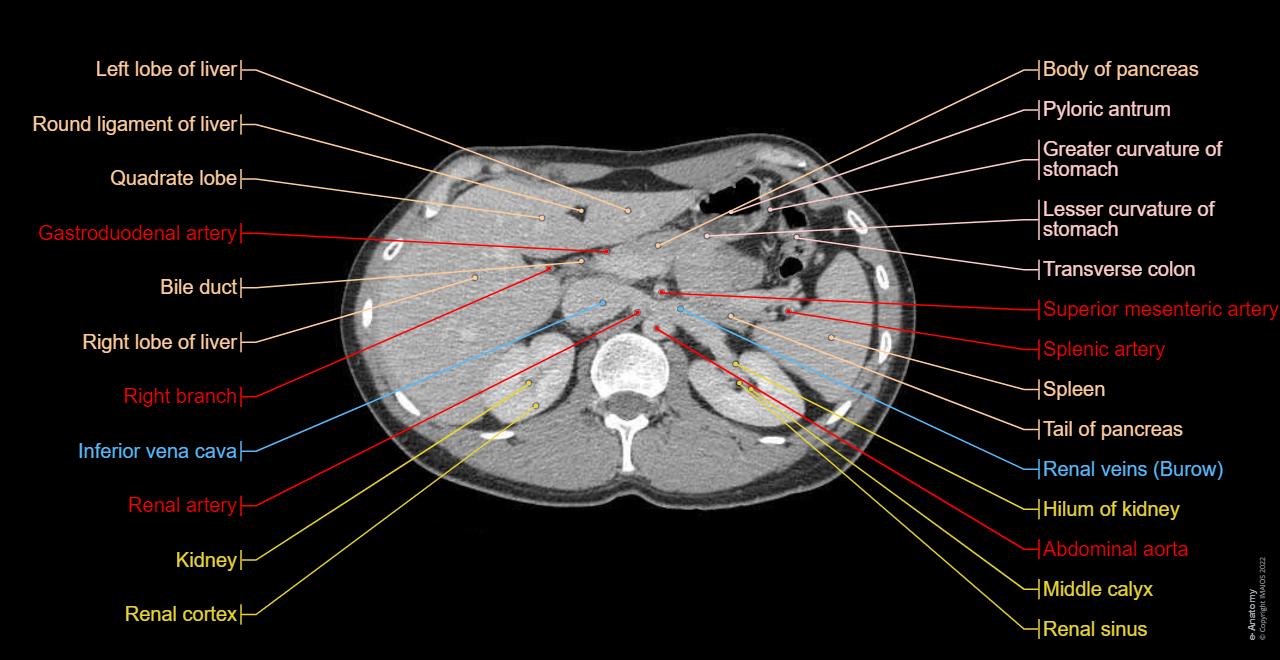
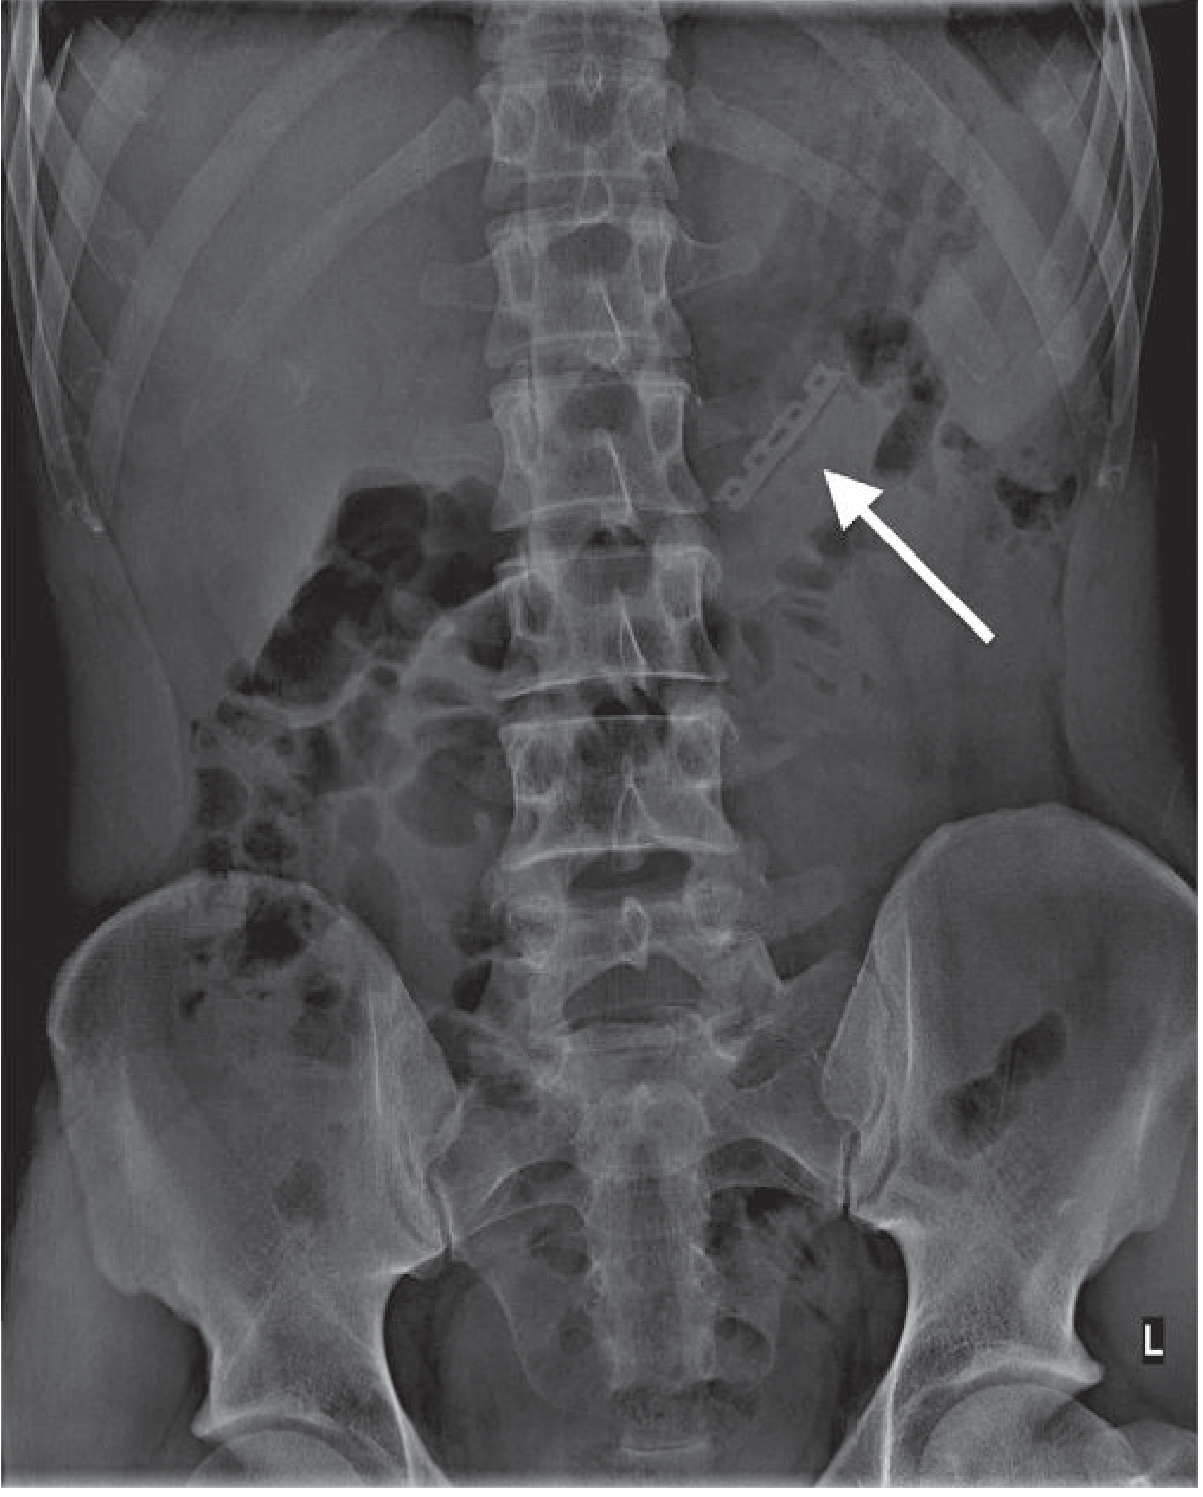
STEP 5 - Reading a CT Abdomen
CT abdomen is almost always done with IV contrast (to enhance vessels and organs) and sometimes oral contrast. Phases:
- Non-contrast: Good for stones, calcifications, acute blood
- Arterial phase (25-35 sec): Arteries bright, organ arterial supply
- Portal venous phase (70-80 sec): Liver, spleen, kidneys at peak enhancement - MOST USEFUL phase
- Delayed phase (3-5 min): Renal collecting system, bladder
Systematic approach (organ by organ):
- Liver (right side, largest organ): Homogeneous, moderate density. Look for focal lesions (hypodense = cysts/metastases; hyperdense = HCC with arterial enhancement; calcified = old infection). Measure HU - fatty liver < 40 HU (less than spleen).
- Gallbladder: Thin-walled, fluid-filled (black). Stones = dense white (calcified) or may not be visible.
- Spleen (left side): Homogeneous, slightly denser than liver. Look for lacerations (jagged hypodense lines), infarcts (wedge-shaped hypodense area).
- Pancreas (transverse, anterior to IVC and aorta): Uniform, head on right, tail on left. Pancreatic duct (< 3 mm). Pancreatitis = swelling + peripancreatic stranding (haziness in fat).
- Kidneys (retroperitoneal, bilateral): Look for stones (hyperdense), hydronephrosis (dilated collecting system), masses (hyperdense = RCC with enhancement; hypodense = cysts).
- Aorta (midline, left of IVC): Normal < 3 cm diameter. > 3 cm = aneurysm. Dissection = intimal flap visible.
- Appendix: Look in right iliac fossa. Normal < 6 mm, no fat stranding. Appendicitis: > 6 mm, wall thickening, periappendiceal fat stranding.
- Bowel: Normal wall < 3-4 mm, no stranding. Thickened wall + mesenteric stranding = inflammation/ischemia.
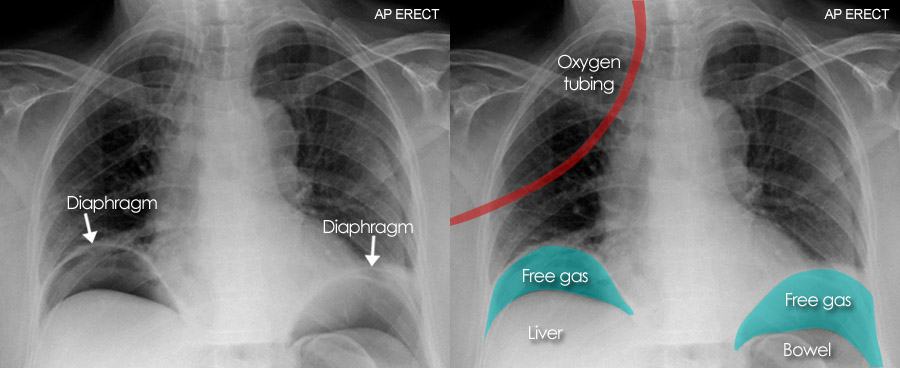
- Free fluid / free air: Fluid appears black in dependent spaces (perihepatic, perisplenic, pelvis). Free air (black) under diaphragm or anterior abdomen = bowel perforation.
STEP 6 - CT with Contrast: What to Look For
Enhancement patterns tell you about vascularity:
- Homogeneous enhancement: Benign (cyst, adenoma)
- Rim enhancement: Abscess or necrotic tumor
- Arterial phase enhancement: Hypervascular lesion (HCC, carcinoid, RCC, hemangioma)
- No enhancement: Cyst, necrosis, non-vascular structure
- Washout on delayed phase: Strongly suggests HCC
Contrast hazards to flag:
- Contrast allergy risk - check history
- Nephrotoxicity - check creatinine/GFR before IV contrast
- Metformin should be held before contrast (risk of lactic acidosis)
- Never give IV contrast intrathecally
Quick Reference Summary Tables
ECG Interpretation Checklist
| Step | What to Assess | Normal Value |
|---|
| 1. Rate | BPM (300 / large boxes) | 60-100 bpm |
| 2. Rhythm | Regular? P before QRS? | Regular sinus |
| 3. Axis | Lead I and aVF direction | Both positive = normal |
| 4. P wave | Size, shape, duration | < 0.12 sec, < 2.5 mm |
| 5. PR interval | Duration | 0.12-0.20 sec |
| 6. QRS | Width, morphology | < 0.12 sec, no Q waves |
| 7. ST segment | Elevation or depression | Isoelectric (flat) |
| 8. T wave | Direction, shape | Upright in I, II, V4-V6 |
| 9. QT interval | Corrected QTc | < 440 ms (men) |
CT Scan Window Quick Reference
| Organ/Area | Window Width | Window Level |
|---|
| Brain | 80 | +40 |
| Bone | 2500 | +500 |
| Lung | 1500 | -600 |
| Mediastinum | 400 | +40 |
| Abdomen | 350 | +50 |
| Liver | 150 | +60 |
Key Sources
- Braunwald's Heart Disease: A Textbook of Cardiovascular Medicine - ECG chapters 61, 80
- Harrison's Principles of Internal Medicine, 22nd Edition (2025) - Chapter 297 (CT imaging, Hounsfield units)
- Rosen's Emergency Medicine - ECG and CT interpretation chapters
- ECGWaves.com - Normal ECG characteristics
- ECGWeekly.com - Intervals and segments reference
- Kenhub - Abdominal CT - Abdominal anatomy guide
Clinical note: This guide is for educational purposes. ECG and CT interpretation in clinical practice requires direct training, supervised reading, and correlation with patient history and examination. Never make clinical decisions based on imaging alone without appropriate training and clinical context.