
Give me a full notes regarding Irritable bowel syndrome,it's clear definition , caustic factor, pathophysiology, diagnostic criteria, investigations, treatments etc.,
"irritable bowel syndrome"[MeSH Terms] AND diagnosis AND treatment
irritable bowel syndrome pathophysiology diagram
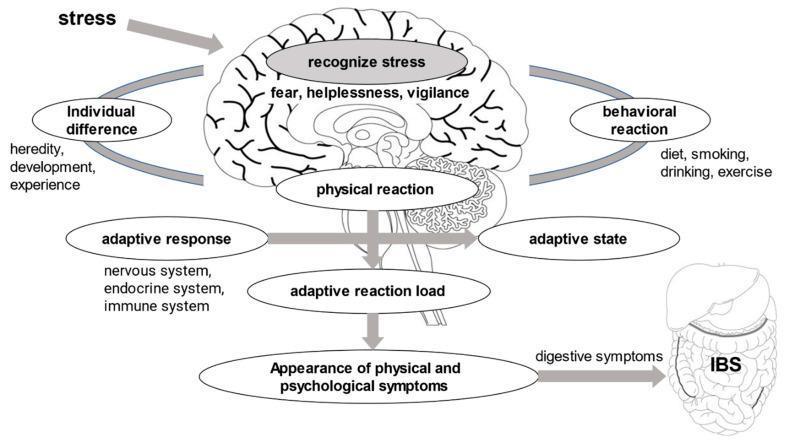
This pathophysiology diagram illustrates the biopsychosocial model of Irritable Bowel Syndrome (IBS), mapping the pathway from psychological stress to gastrointestinal symptoms. Centered on a sagittal-view illustration of the human brain, the flowchart begins with 'stress' triggering a cognitive/emotional recognition phase (fear, helplessness, vigilance). This central processing initiates a 'physical reaction' that interacts with 'individual differences' (heredity, development, experience) and 'behavioral reactions' (diet, smoking, drinking, exercise). The core mechanism involves an 'adaptive response' mediated by the nervous, endocrine, and immune systems, which influences the 'adaptive state' and the 'adaptive reaction load'. The cumulative effect of these physiological and behavioral factors leads to the 'appearance of physical and psychological symptoms,' specifically manifested as 'digestive symptoms' in the lower gastrointestinal tract, labeled as IBS. The diagram serves as an educational tool for understanding the brain-gut axis and the multifactorial nature of functional gastrointestinal disorders, highlighting the integration of genetics, lifestyle, and systemic physiological responses in disease manifestation.
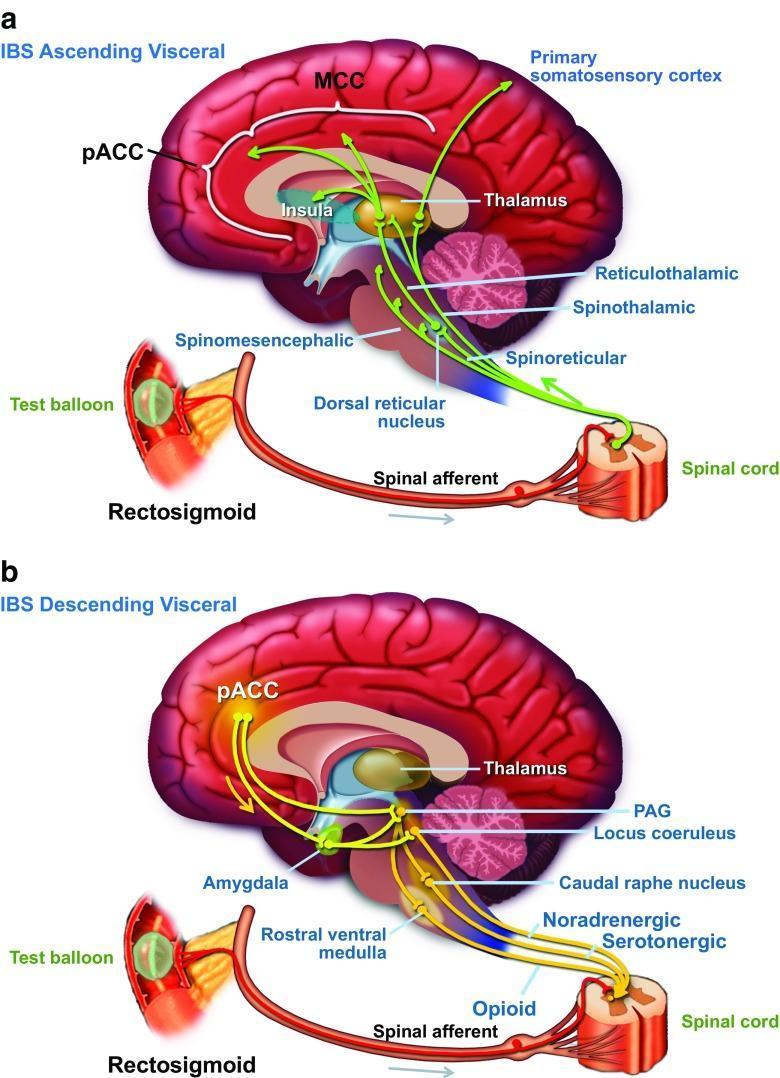
This medical illustration depicts the gut-brain axis through two comparative diagrams focusing on the neuroanatomical pathways of visceral perception and pain regulation in the context of Irritable Bowel Syndrome (IBS). Diagram (a) illustrates the ascending visceral pathway, where mechanical stimulation (represented by a test balloon in the rectosigmoid) triggers signals via spinal afferents to the spinal cord. These signals ascend through the spinomesencephalic, spinothalamic, and spinoreticular tracts to brain centers including the thalamus, insula, perigenual anterior cingulate cortex (pACC), midcingulate cortex (MCC), and primary somatosensory cortex. Diagram (b) outlines the descending visceral modulatory pathway, originating in the pACC and relaying through the amygdala, periaqueductal gray (PAG), and rostral ventral medulla. Descending noradrenergic, serotonergic, and opioid pathways project back to the spinal cord dorsal horn to modulate afferent signaling. The illustration serves as an educational tool for explaining how central nervous system processes can influence peripheral visceral sensitivity and the clinical rationale for using neuromodulators in disorders of gut-brain interaction.
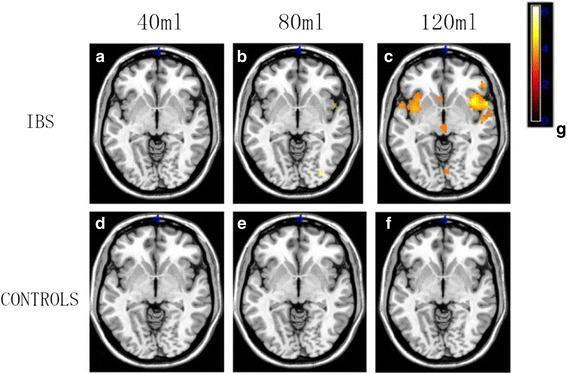
This diagnostic image set consists of axial functional MRI (fMRI) scans comparing brain activation patterns between patients with Irritable Bowel Syndrome (IBS) and healthy controls during graded visceral stimulation. The images are arranged in a grid corresponding to rectal balloon distention volumes of 40ml, 80ml, and 120ml. A colorimetric scale (g) indicates activation intensity, where lighter yellow/white colors represent higher signal changes and darker red/orange colors represent lower changes. In the IBS group (a-c), there is a volume-dependent increase in cortical activation; at 120ml (c), prominent activation is visible in the prefrontal cortex, insular cortex, and parietal regions. In contrast, the control group (d-f) shows minimal to no significant brain activation across all three stimulation volumes. This comparison illustrates the pathophysiology of visceral hypersensitivity and altered central pain processing in IBS patients, demonstrating an exaggerated neural response to mechanical bowel distention compared to healthy subjects.
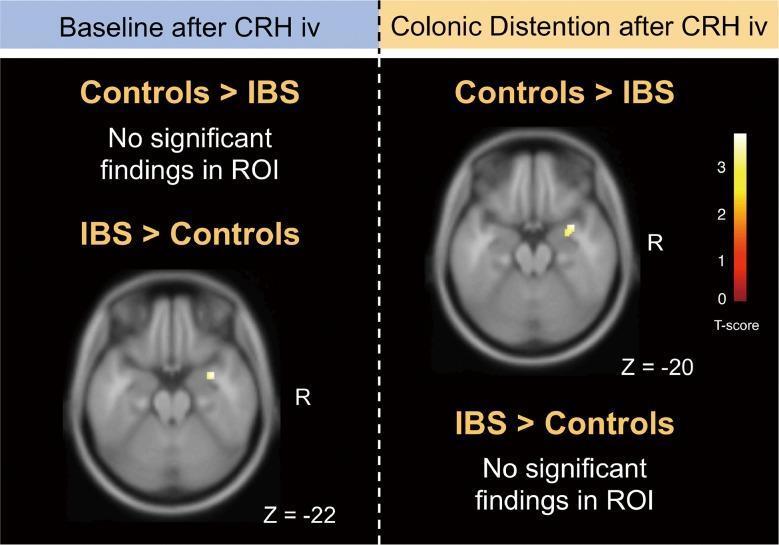
This diagnostic image displays axial slices of functional MRI (fMRI) scans comparing brain activity between Irritable Bowel Syndrome (IBS) patients and healthy controls following intravenous Corticotropin-Releasing Hormone (CRH) injection. The left panel shows 'Baseline after CRH iv' at axial section Z = -22, where IBS patients demonstrate significantly greater activation in the right amygdala compared to controls. The right panel shows 'Colonic Distention after CRH iv' at axial section Z = -20, where healthy controls exhibit significantly higher activation in the right amygdala than IBS patients. Significant findings are indicated by yellow voxel clusters overlaid on a single-subject MRI template. A T-score scale (0 to 3) is provided on the right, with yellow representing higher statistical significance. Regions of Interest (ROI) analysis was conducted with a threshold of PFWE-corrected < 0.05. This image illustrates the differential neural processing of visceral stress and baseline states in the brain-gut axis, specifically highlighting the amygdala's role in the pathophysiology of IBS.
Irritable Bowel Syndrome (IBS) - Comprehensive Clinical Notes
1. DEFINITION
2. EPIDEMIOLOGY
| Parameter | Data |
|---|---|
| Global prevalence (Rome IV) | ~4.1% |
| USA/UK/Canada prevalence | ~4.6% |
| Women | 5.2% |
| Men | 2.9% |
| Incidence (physician-diagnosed) | ~38 per 10,000 person-years |
| Annual physician visits | ~4.4 million (USA) |
- IBS predominantly affects individuals under 50 years of age; new onset after 50 is a red flag
- Up to 50% of individuals with IBS symptoms do not seek health care
- Significantly associated with work absenteeism, reduced productivity, and psychological comorbidity
- A 2025 meta-analysis (PMID: 40359286) of 33 countries confirms global prevalence 4-5% using Rome III/IV criteria, with female predominance
3. SUBTYPES (Rome IV Classification)
| Subtype | Abbreviation | Prevalence |
|---|---|---|
| IBS with predominant diarrhea | IBS-D | 35-40% |
| IBS with mixed bowel habits | IBS-M | 35-40% |
| IBS with predominant constipation | IBS-C | ~25% |
| IBS unclassified | IBS-U | <5% |
4. CAUSATIVE / RISK FACTORS
A. Genetic Predisposition
- IBS clusters in families; relatives of IBS patients have a 2-3x higher risk
- Twin studies show greater concordance in monozygotic than dizygotic twins
- Specific genetic polymorphisms affect serotonin transporter function (SLC6A4 gene), adrenergic receptors (ADRA2A, ADRB2), and immune regulation (IL-6, TNF-alpha)
B. Post-Infectious IBS (PI-IBS)
- Accounts for 10-33% of new IBS cases
- Develops after acute gastroenteritis (bacterial, viral, or protozoal)
- Risk factors: younger age, female sex, prolonged initial illness, antibiotic use, psychological distress at time of infection
- Organisms implicated: Salmonella, Campylobacter, Shigella, E. coli (ETEC), norovirus, Giardia lamblia
C. Adverse Childhood Events (ACEs)
- Physical, emotional, or sexual abuse during childhood is a significant risk factor
- Increases stress reactivity and alters the hypothalamic-pituitary-adrenal (HPA) axis
D. Psychosocial Factors
- Anxiety, depression, somatization, catastrophizing
- Life stressors and emotional upset commonly trigger or worsen symptoms
- Psychological comorbidity present in 40-60% of IBS patients seeking care
E. Food and Dietary Triggers
- FODMAPs (Fermentable Oligosaccharides, Disaccharides, Monosaccharides, and Polyols)
- Lactose intolerance
- Gluten sensitivity (non-celiac)
- High-fat meals, caffeine, alcohol, carbonated drinks
F. Altered Gut Microbiota (Dysbiosis)
- Alterations in the composition and diversity of the gut microbiome have been documented
- Small intestinal bacterial overgrowth (SIBO) is present in a subset of IBS patients
5. PATHOPHYSIOLOGY
A. Visceral Hypersensitivity (Central Mechanism)
- Most consistent finding in IBS: enhanced perception of normal gut stimuli
- Decreased pain thresholds to balloon distention of the rectum and colon (allodynia + hyperalgesia)
- Results from sensitization of peripheral afferent neurons (peripheral sensitization) AND altered CNS processing (central sensitization)
- The anterior cingulate cortex, insula, and prefrontal cortex show exaggerated activation on fMRI during gut stimulation in IBS patients
B. Altered Gut-Brain Axis
- Bidirectional dysregulation between the enteric nervous system (ENS) and the CNS
- The gut has ~100 million neurons and an extensive autonomic innervation
- Stress activates the HPA axis, releasing corticotropin-releasing hormone (CRH), which alters gut motility, barrier function, and immune activation
C. Altered Intestinal Motility
- Colonic transit is generally slower in IBS-C and faster in IBS-D
- Exaggerated motor responses to meals (gastrocolic reflex), cholecystokinin (CCK), and mechanical stimuli
- High-amplitude propagating contractions (HAPCs) may be increased in IBS-D
D. Altered Mucosal Immune Function
- Increased mast cell density and activation near enteric nerves (particularly in post-infectious IBS)
- Elevated mucosal cytokines: IL-1β, IL-6, TNF-alpha
- Mast cell mediators (histamine, serotonin, proteases) directly activate nearby afferent neurons, lowering pain thresholds
E. Dysbiosis and Altered Gut Microbiota
- Reduced diversity of gut microbiome
- Altered Firmicutes:Bacteroidetes ratio
- SIBO in a subset of patients (especially IBS-D)
- Dysbiosis alters intestinal permeability, antigen presentation, and mast cell activation
F. Increased Intestinal Permeability ("Leaky Gut")
- Disruption of tight junctions allows bacterial products (LPS, PAMPs) to enter the mucosa
- Triggers innate immune activation and neuronal sensitization
- More prominent in post-infectious IBS
G. Serotonin (5-HT) Dysregulation
- ~95% of the body's serotonin is produced by enterochromaffin (EC) cells in the gut mucosa
- 5-HT3 and 5-HT4 receptors regulate intestinal motility and secretion
- Reduced serotonin reuptake transporter (SERT) in IBS-D → elevated mucosal 5-HT → accelerated transit
- Reduced 5-HT availability in IBS-C → slowed transit
H. Altered Autonomic Function
- Altered sympathetic/parasympathetic balance
- Increased sympathetic tone (especially in IBS-D) disrupts normal motility patterns
6. CLINICAL FEATURES
Core Symptoms
- Recurrent abdominal pain - lower abdominal most common; often cramping/colicky
- Altered bowel habits - constipation, diarrhea, or alternating
- Bloating and abdominal distension
- Mucus in stools (no blood)
- Incomplete evacuation feeling
Features Supportive of IBS
- Symptoms begin during periods of stress or emotional upset
- Small-volume stools (no blood)
- Symptoms worsen after meals (postprandial worsening)
- Relief with defecation
- Long history without progressive deterioration
Extraintestinal Symptoms (common)
- Fibromyalgia (~20% of IBS patients)
- Chronic fatigue syndrome
- Chronic pelvic pain
- Interstitial cystitis / bladder symptoms
- Headache
- Dyspareunia
- Temporomandibular joint (TMJ) disorder
- Depression and anxiety
7. DIAGNOSTIC CRITERIA - ROME IV (2016)
- Related to defecation
- Associated with a change in frequency of stool
- Associated with a change in form (appearance) of stool
Supportive Symptoms (not required but increase diagnostic confidence)
- Abnormal stool frequency: ≤3 BMs/week OR >3 BMs/day
- Abnormal stool form: lumpy/hard OR loose/watery
- Defecation straining
- Urgency
- Feeling of incomplete bowel movement
- Passing mucus
- Bloating or abdominal distension
Alarm Features (RED FLAGS - argue AGAINST IBS, prompt investigation)
- New-onset symptoms at age ≥50 years
- Unintentional weight loss
- Hematochezia or melena (not related to hemorrhoids)
- Nocturnal diarrhea (waking from sleep)
- Anemia (iron deficiency)
- Palpable abdominal mass or lymphadenopathy
- Family history of colorectal cancer, IBD, or celiac disease
- Fever
8. INVESTIGATIONS
Recommended for All IBS
| Test | Purpose |
|---|---|
| CBC | Exclude anemia, infection |
| CRP / ESR | Exclude inflammation (IBD) |
| Fecal calprotectin | Elevated in IBD (helps differentiate from IBS) |
| Celiac serologies (tTG-IgA, total IgA) | Particularly in IBS-D - celiac can mimic IBS |
| TSH | Exclude thyroid dysfunction |
For IBS-D Specifically
- Celiac serologies (strongly recommended)
- Stool microscopy and culture (if post-infectious trigger suspected)
- Consider bile acid malabsorption testing (SeHCAT or serum C4/FGF19)
For IBS-C Specifically
- Consider colonic transit studies (scintigraphy or radiopaque markers) if refractory
Colonoscopy
- NOT routinely recommended in patients <45 years with typical IBS symptoms and no alarm features
- Indicated if: age ≥45-50 (colorectal cancer screening), alarm features present, or refractory symptoms
- Biopsies during colonoscopy: may reveal microscopic colitis (which can mimic IBS-D)
NOT Routinely Recommended
- Routine stool testing in the absence of alarm features
- Abdominal imaging (unless alarm features)
- Small bowel imaging (unless Crohn's disease suspected)
- Hydrogen breath testing (unless SIBO strongly suspected)
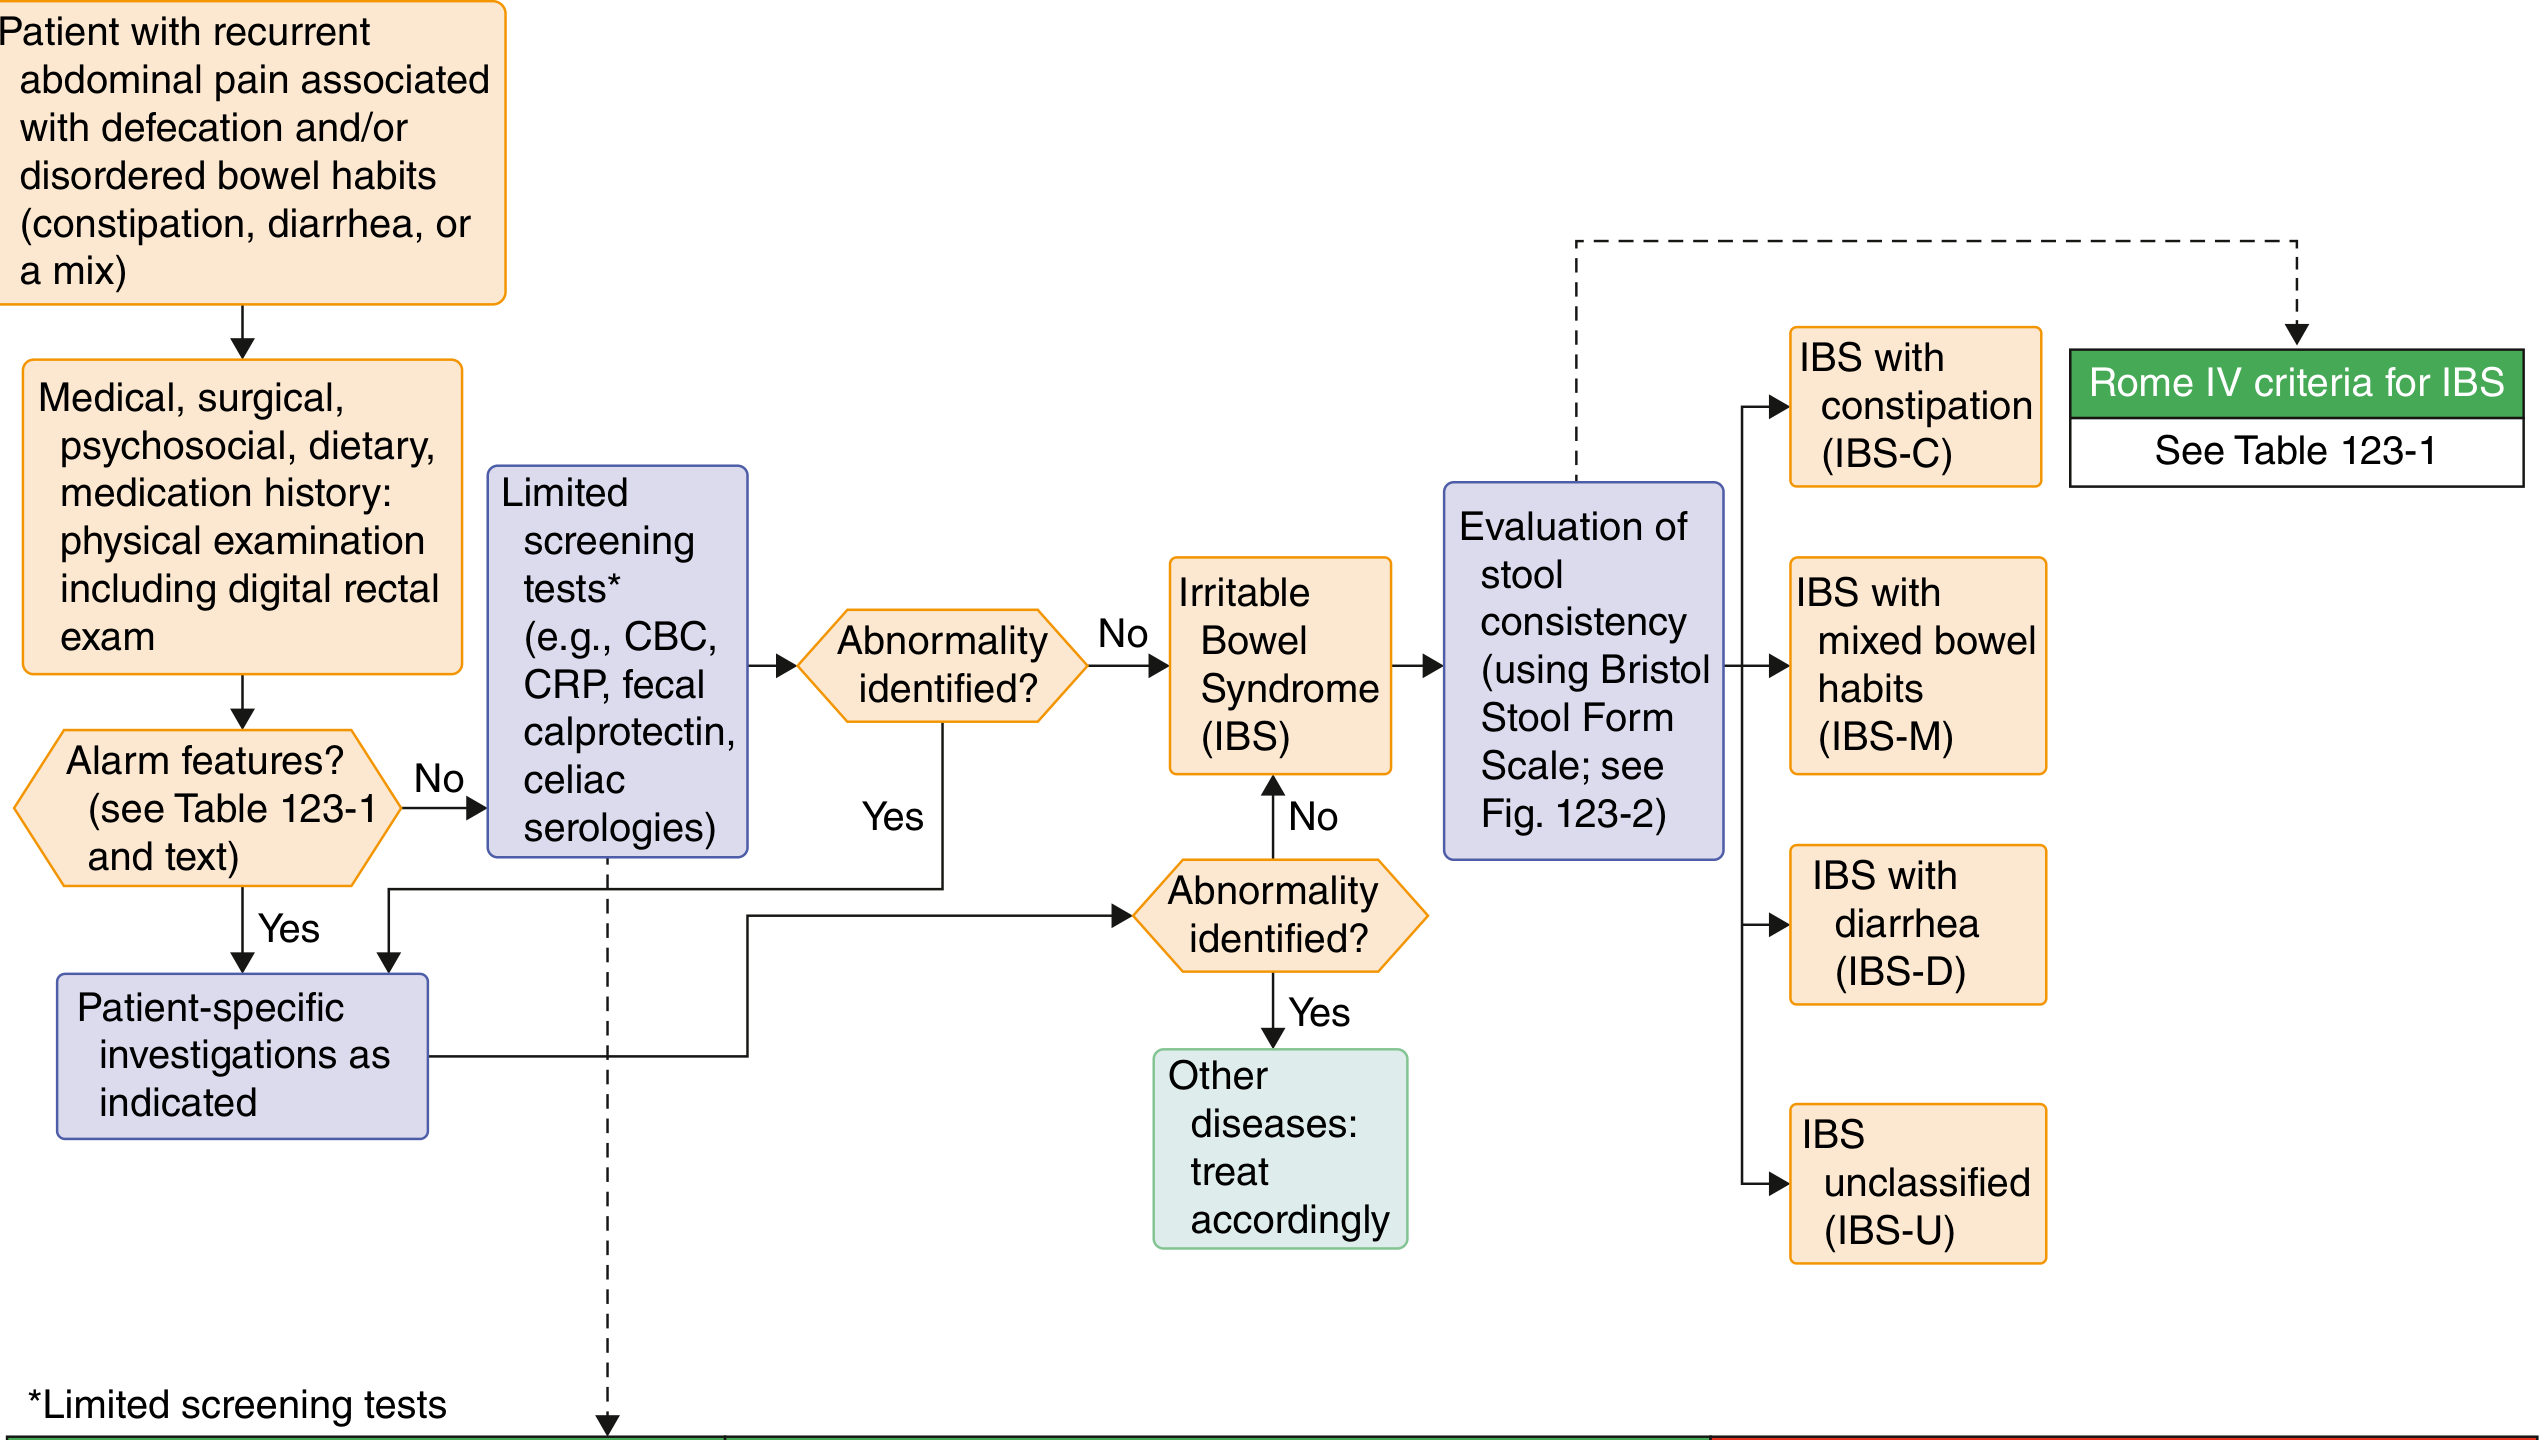
9. DIFFERENTIAL DIAGNOSIS
| Category | Conditions |
|---|---|
| Inflammatory | IBD (Crohn's, ulcerative colitis), microscopic colitis |
| Infectious | Giardia, SIBO, post-infectious diarrhea |
| Malabsorptive | Celiac disease, lactose intolerance, bile acid malabsorption |
| Structural | Colorectal cancer, diverticular disease |
| Endocrine | Hypothyroidism (constipation), hyperthyroidism (diarrhea), hypoparathyroidism |
| Gynecological | Endometriosis, ovarian pathology |
| Others | Chronic intestinal pseudo-obstruction, pelvic floor dysfunction, acute intermittent porphyria, lead poisoning |
10. TREATMENT
Step 1 - General Measures (All IBS)
- Patient education and reassurance: Explain the benign, chronic nature; reassure no cancer/IBD
- Therapeutic relationship: A strong patient-physician relationship improves outcomes
- Symptom diary: Identify personal triggers (dietary, stress, hormonal)
- Regular physical activity: Improves gut motility and reduces psychological distress
- Adequate sleep and stress reduction
Step 2 - Dietary Interventions
Low-FODMAP Diet
- Currently the most evidence-based dietary intervention for IBS
- FODMAP = Fermentable Oligosaccharides, Disaccharides, Monosaccharides, and Polyols (e.g., fructose, lactose, fructans, GOS, sorbitol)
- 50-80% of IBS patients report symptom improvement
- A 2025 Lancet network meta-analysis (PMID: 40258374) confirms low-FODMAP diet is among the most effective dietary interventions for IBS
Dietary Fiber
- Soluble fiber (psyllium) - beneficial in IBS-C; reduces constipation and perception of rectal distension
- Insoluble fiber (wheat bran) - NOT recommended; may worsen bloating and pain
- Target: 20-30 g/day total dietary fiber, titrated slowly
Other Dietary Modifications
- Avoid caffeine, alcohol, carbonated beverages, high-fat meals
- Trial of lactose restriction if lactose intolerance suspected
- Gluten-free diet in selected patients (non-celiac gluten sensitivity)
Step 3 - Pharmacological Treatment
A. Antispasmodics (Pain and Spasm)
| Drug | Dose | Notes |
|---|---|---|
| Peppermint oil | 1-2 capsules TID or as needed | Meta-analysis: superior to placebo for global IBS and pain relief |
| Hyoscyamine | 0.125 mg TID-QID or as needed | Anticholinergic |
| Dicyclomine | 10 mg TID-QID | Less anticholinergic SE than hyoscyamine |
| Mebeverine | 200 mg BD (modified release) | Widely used in Europe |
B. For IBS-C (Constipation-Predominant)
| Drug | Dose | Mechanism | Notes |
|---|---|---|---|
| Polyethylene glycol (PEG) | 17g daily | Osmotic laxative | First-line; improves stool consistency |
| Lactulose | 10-40g daily | Osmotic laxative | May worsen bloating |
| Linaclotide | 290 μg daily | Guanylate cyclase-C agonist | Increases intestinal secretion; also reduces visceral pain |
| Lubiprostone | 8 μg BD | Chloride channel activator | FDA-approved for IBS-C in women ≥18 |
| Plecanatide | 3 mg daily | Guanylate cyclase-C agonist | Similar to linaclotide |
| Tegaserod | 6 mg BD | 5-HT4 partial agonist | FDA-approved for IBS-C in women <65 without CV risk |
| Prucalopride | 2 mg daily | 5-HT4 agonist | Approved for chronic idiopathic constipation |
C. For IBS-D (Diarrhea-Predominant)
| Drug | Dose | Mechanism | Notes |
|---|---|---|---|
| Loperamide | 2-4 mg every 4-6h (max 12 mg/day) | Peripheral opiate agonist | First-line; reduces transit time, stool frequency, urgency |
| Eluxadoline | 100 mg BD (75 mg BD if no gallbladder) | Mixed μ/κ opioid agonist, δ antagonist | FDA-approved; avoid in patients without gallbladder (pancreatitis risk) |
| Alosetron | 0.5-1 mg BD | 5-HT3 antagonist | For severe IBS-D in women; risk of ischemic colitis (REMS program) |
| Rifaximin | 550 mg TID x 14 days | Non-absorbable antibiotic | Targets dysbiosis/SIBO; can repeat if relapse |
| Cholestyramine | 4g with meals | Bile acid sequestrant | For bile acid malabsorption component |
D. Central Neuromodulators (Pain-Predominant / All Subtypes)
| Drug | Dose | Notes |
|---|---|---|
| Amitriptyline (TCA) | 10-25 mg at bedtime, up to 100 mg | Reduces visceral hypersensitivity; preferred in IBS-D (anticonstipating effect) |
| Desipramine (TCA) | 10-25 mg at bedtime, up to 100 mg | Less sedating |
| Nortriptyline (TCA) | 10-25 mg at bedtime, up to 100 mg | Less anticholinergic |
| Citalopram (SSRI) | 5-20 mg daily | Preferred in IBS-C (prokinetic effect) |
| Fluoxetine (SSRI) | 20-40 mg daily | |
| Duloxetine (SNRI) | 30-60 mg daily | Especially if anxiety/depression comorbid |
E. Probiotics
- Meta-analyses suggest modest benefit for global IBS symptoms and bloating
- Specific strains with most evidence: Lactobacillus acidophilus, Bifidobacterium infantis 35624, Lactobacillus rhamnosus GG
- Benefit is strain-specific and effect size is modest
F. Antibiotics
- Rifaximin 550 mg TID x 14 days for non-constipated IBS (especially IBS-D)
- Targets gut microbiome dysbiosis and SIBO
- Up to 2 repeat courses if relapse occurs
Step 4 - Psychological Therapies
| Therapy | Evidence |
|---|---|
| Cognitive-Behavioural Therapy (CBT) | Strongest evidence; reduces pain and improves quality of life |
| Gut-directed hypnotherapy | Comparable to CBT; durable benefit up to 5 years |
| Mindfulness-based stress reduction (MBSR) | Emerging evidence; reduces symptom severity |
| Psychodynamic interpersonal therapy | Effective, especially if psychosocial stressors are primary |
11. TREATMENT ALGORITHMS
IBS-C Management
- Lifestyle + dietary changes (low-FODMAP, soluble fiber, activity)
- Osmotic laxatives (PEG, lactulose)
- Secretagogues: linaclotide 290 μg or lubiprostone 8 μg BD
- TCAs at low dose if pain predominant (note: TCAs can worsen constipation)
- SSRIs if psychological comorbidity
- Consider referral for psychological therapy if refractory
IBS-D Management
- Dietary modification + loperamide as needed
- Rifaximin course (14 days)
- Alosetron (severe women-only, REMS)
- Eluxadoline (if no gallbladder, avoid)
- TCA (amitriptyline) low dose if pain + diarrhea
- Psychological therapy
IBS-M / Generalised Pain
- Antispasmodics (peppermint oil or anticholinergics)
- Low-FODMAP diet
- Central neuromodulators (TCA/SSRI)
- Psychological therapies
12. PROGNOSIS
- IBS is a chronic, relapsing-remitting condition - not life-threatening, no progression to IBD or cancer
- ~30-40% of patients experience spontaneous improvement over time
- Subtype can shift over time (IBS-C to IBS-D and vice versa)
- Poor prognostic factors: severe anxiety/depression, high somatic symptom burden, catastrophizing, history of abuse
- Quality of life (QoL) impairment is comparable to that of GERD, asthma, or diabetes for many patients
13. SPECIAL POPULATIONS
IBS in Pregnancy
- Symptoms may improve or worsen during pregnancy
- Safe treatments: dietary modifications, soluble fiber, peppermint oil, low-dose TCAs if needed
- Avoid: alosetron, eluxadoline, linaclotide (potential teratogenicity)
IBS in the Elderly
- New-onset symptoms after 50: always investigate to exclude organic disease (colonoscopy mandatory)
- Anticholinergics should be used with caution (urinary retention, falls, cognitive effects)
Quick Summary Table
| Feature | Key Points |
|---|---|
| Definition | Functional DGBI: recurrent abdominal pain + altered bowel habits, no organic cause |
| Prevalence | ~4-5% globally; women > men (2:1) |
| Key mechanism | Gut-brain axis dysregulation, visceral hypersensitivity |
| Diagnostic criteria | Rome IV: ≥1 day/week abdominal pain for 6 months, with ≥2 stool-related features |
| Key tests | CBC, CRP, fecal calprotectin, celiac antibodies, TSH |
| Colonoscopy | Only if alarm features or age ≥50 |
| First-line treatment | Dietary (low-FODMAP) + patient education + targeted pharmacotherapy |
| Most effective therapy | CBT + gut-directed hypnotherapy for severe/refractory disease |
| Prognosis | Benign; chronic relapsing; no cancer/IBD risk |
Make a presentation on the gut-brain axis and IBS pathophysiology
gut brain axis diagram nervous system enteric
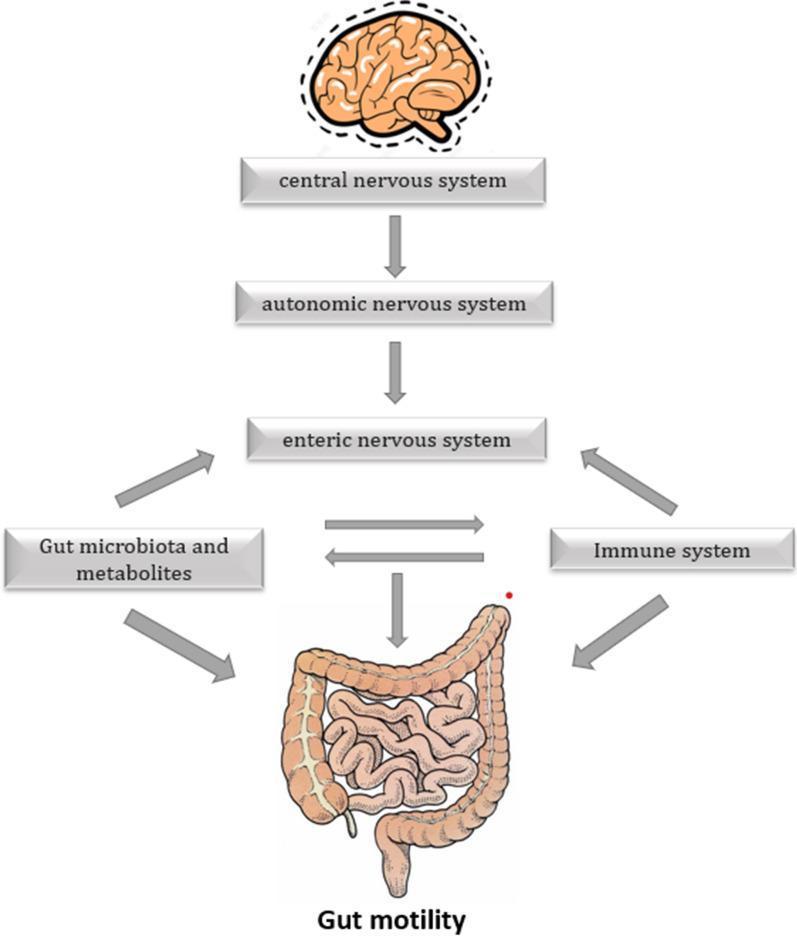
This pathophysiology diagram illustrates the multi-system regulation of human gut motility, focusing on the gut-brain-microbiota axis. The diagram follows a hierarchical structure: the Central Nervous System (represented by a brain icon) influences the Autonomic Nervous System, which in turn acts upon the Enteric Nervous System. The Enteric Nervous System maintains a bidirectional relationship with both the Immune System and the Gut Motility (represented by an illustration of the intestines). Two additional external factors are shown directly influencing this pathway: 'Gut microbiota and metabolites' (such as bile acids, SCFAs, and IPA) and the 'Immune System.' The microbiota and metabolites are shown to have a bidirectional interaction with the Enteric Nervous System and a direct unidirectional influence on gut motility. The Immune System also exhibits bidirectional interaction with the Enteric Nervous System and a direct unidirectional influence on gut motility. The diagram demonstrates the complex integration of neural, immunological, and microbial factors in maintaining or altering gastrointestinal function, particularly in clinical contexts like postoperative ileus.
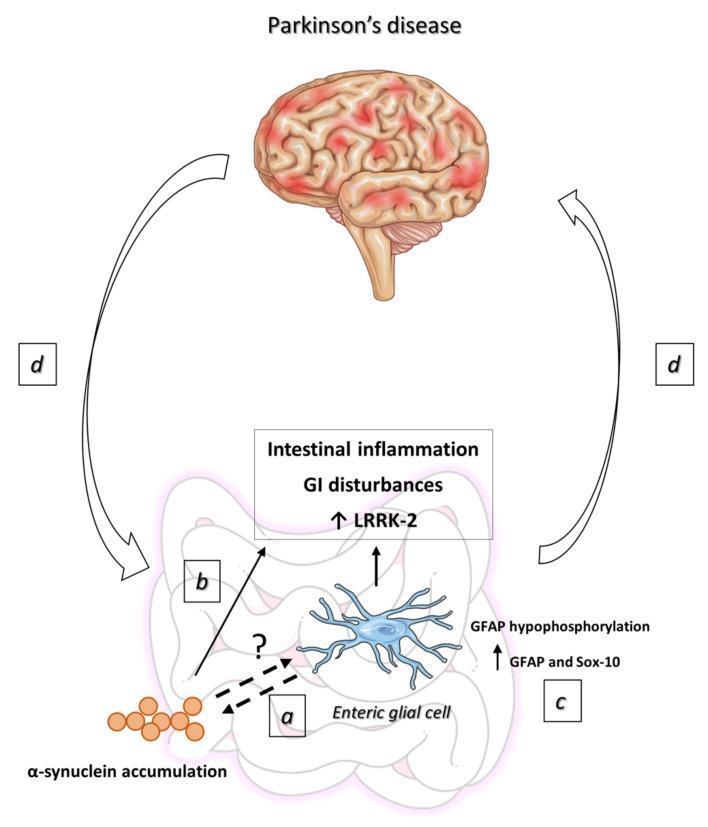
This pathophysiology diagram illustrates the bidirectional gut-brain axis in Parkinson's disease (PD). The central nervous system is represented by a brain illustration at the top, while the gastrointestinal (GI) tract is shown at the bottom, connected by large curved arrows (label d) signifying ascending and descending signaling pathways. The enteric environment features a blue, star-shaped Enteric Glial Cell (EGC) as a central actor. Key pathological features depicted include alpha-synuclein accumulation (label a) and its interaction with reactive EGCs. A 'pathological loop' is suggested by dotted arrows between protein aggregation and cellular activation. Associated biomarkers and clinical manifestations are listed: increased LRRK-2 expression, GI disturbances, and intestinal inflammation (label b). Molecular changes in reactive gliosis (label c) include increased Sox-10 and GFAP expression alongside GFAP hypophosphorylation. The diagram highlights how peripheral enteric neuroinflammation and glial dysfunction contribute to central neurodegeneration, emphasizing the role of the enteric nervous system in PD etiology.
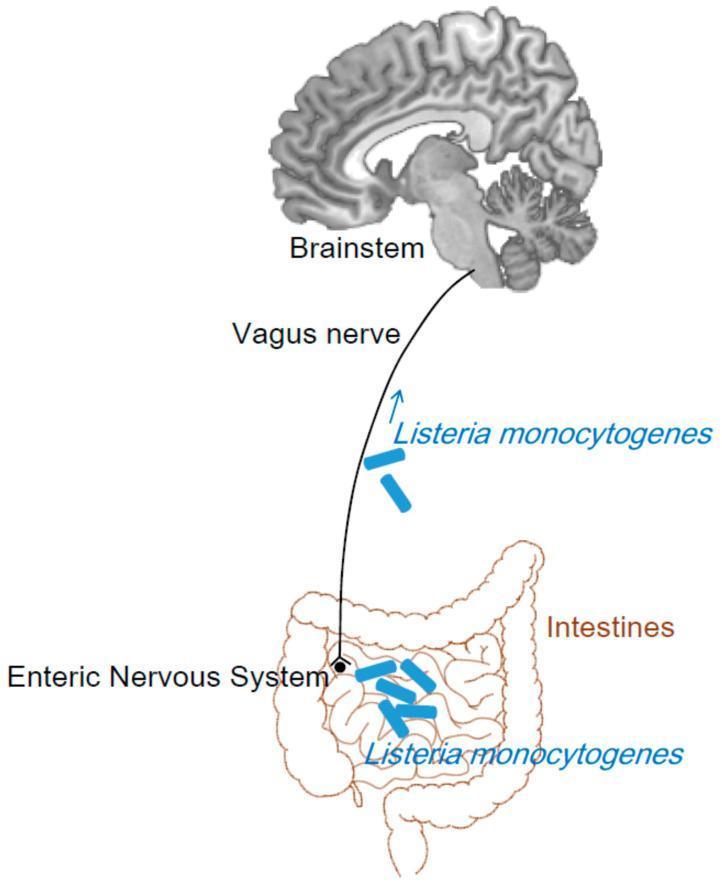
This pathophysiology diagram illustrates the 'gut-brain axis' as a potential retrograde axonal transport pathway for Listeria monocytogenes. The visual consists of three primary anatomical components: a sagittal section of the human brain highlighting the brainstem, an elongated line representing the vagus nerve (Cranial Nerve X), and a line-drawing of the small and large intestines. The diagram depicts the enteric nervous system within the intestinal wall as the starting point. Blue rod-shaped icons representing L. monocytogenes are shown within the intestinal lumen and alongside the vagus nerve, with an upward-pointing arrow indicating a centripetal progression from the gastrointestinal tract toward the brainstem. This educational illustration demonstrates the mechanism by which ingested pathogens may bypass the blood-brain barrier by traveling via autonomic nerve fibers to reach the central nervous system, specifically targeting the rhombencephalon. The content is suitable for medical students and clinicians studying infectious diseases, neurology, and neuroanatomy.
IBS pathophysiology visceral hypersensitivity mast cells serotonin
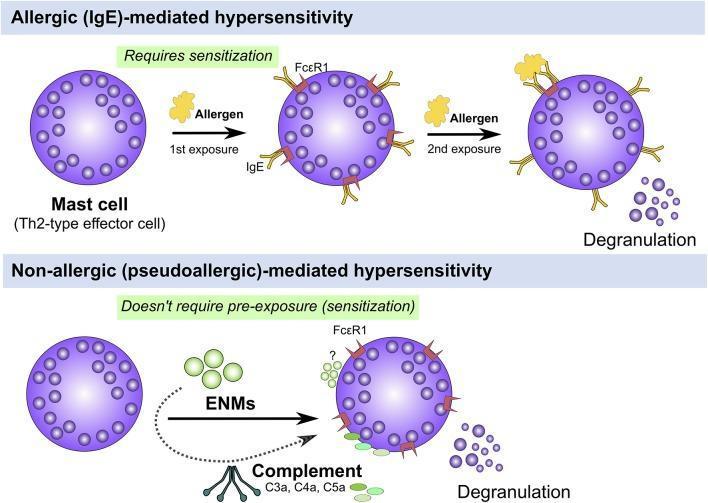
A comparative pathophysiology diagram illustrating two mechanisms of mast cell activation and degranulation in hypersensitivity. The top panel depicts 'Allergic (IgE)-mediated hypersensitivity,' showing a multi-step process: initial sensitization where an allergen exposure leads to IgE antibodies binding to Fć̵R1 receptors on a Th2-type effector mast cell, followed by a second exposure where allergen cross-linking of the IgE-Fć̵R1 complex triggers degranulation. The bottom panel depicts 'Non-allergic (pseudoallergic)-mediated hypersensitivity,' highlighting that this pathway does not require prior sensitization. Instead, activation is triggered by direct interaction with Engineered Nanomaterials (ENMs) or anaphylatoxins from the complement system (C3a, C4a, C5a), leading directly to the release of intracellular granules. Visually, mast cells are shown as spherical purple cells with dense internal granules that are expelled into the extracellular space upon activation. The diagram serves as an educational tool to distinguish classic Type I hypersensitivity from direct mast cell triggers relevant to toxicology and immunology.
This diagnostic image set consists of axial functional MRI (fMRI) scans comparing brain activation patterns between patients with Irritable Bowel Syndrome (IBS) and healthy controls during graded visceral stimulation. The images are arranged in a grid corresponding to rectal balloon distention volumes of 40ml, 80ml, and 120ml. A colorimetric scale (g) indicates activation intensity, where lighter yellow/white colors represent higher signal changes and darker red/orange colors represent lower changes. In the IBS group (a-c), there is a volume-dependent increase in cortical activation; at 120ml (c), prominent activation is visible in the prefrontal cortex, insular cortex, and parietal regions. In contrast, the control group (d-f) shows minimal to no significant brain activation across all three stimulation volumes. This comparison illustrates the pathophysiology of visceral hypersensitivity and altered central pain processing in IBS patients, demonstrating an exaggerated neural response to mechanical bowel distention compared to healthy subjects.
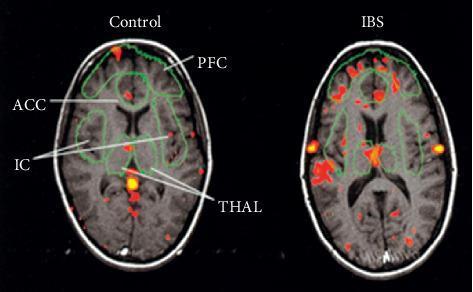
This Comparison Chart features two axial functional magnetic resonance imaging (fMRI) brain scans demonstrating differences in cerebral activation between a control subject and a patient with Irritable Bowel Syndrome (IBS) during visceral nociceptive stimulation. The images use a colorimetric heat map (red/yellow) overlaid on anatomical T1-weighted templates to represent regional cerebral blood flow and neuronal activity. Key neuroanatomical regions are labeled with green outlines, including the Prefrontal Cortex (PFC), Anterior Cingulate Cortex (ACC), Insular Cortex (IC), and Thalamus (THAL). The IBS patient scan shows significantly increased intensity and broader spatial distribution of activation compared to the control subject. Specific hyperactivation is visible in the THAL and ACC, regions associated with the transmission and integration of pain signals. The PFC also demonstrates markedly higher activation in the IBS patient. This diagnostic imaging comparison illustrates the pathophysiology of visceral hypersensitivity and central sensitization in functional gastrointestinal disorders, highlighting the altered central processing of visceral pain.
ls /tmp/workspace/ 2>/dev/null || mkdir -p /tmp/workspace/ibs-presentation && echo "ready"
mkdir -p /tmp/workspace/ibs-presentation && python /tmp/skills/shared/scripts/fetch_images.py \ "https://cdn.orris.care/cdss_images/pmc_clinical_VQA_dc09f0eda8d7cd9f40fe773c7b78924e66fcdd779991812b3b21b26bfd1abe89.jpg" \ "https://cdn.orris.care/cdss_images/pmc_clinical_VQA_94a5e71cf78c5f33507b6fc59b62e9820f56e63ae9b691502f3af670c798060f.jpg" \ "https://cdn.orris.care/cdss_images/pmc_clinical_VQA_e1d4e6717ccea9863734595f022b2d118a5f538086ad53ce090b06e84d91570c.jpg" \ "https://cdn.orris.care/cdss_images/pmc_clinical_VQA_dd84e2c4593db2e36514bb69e54e0a865fd42b9f222473b409fd186afb6b9d98.jpg" \ "https://cdn.orris.care/cdss_images/ee96e3c60f27623d0ad773d5b5844d9fb10b5965867b0b141106bf7e80c232ae.png" \ "https://cdn.orris.care/cdss_images/pmc_clinical_VQA_ac7a6cb994ee7cbe8269e31542997ddea41dcfe079c340e70bcdcfa7e9bfd978.jpg" \ 2>/dev/null | python3 -c "import sys,json; data=json.load(sys.stdin); [print(i, 'OK' if d['base64'] else 'FAIL: '+str(d['error'])) for i,d in enumerate(data)]"
~/ibs-presentation/build_pptx.py
import json, subprocess, base64
from io import BytesIO
from pptx import Presentation
from pptx.util import Inches, Pt, Emu
from pptx.dml.color import RGBColor
from pptx.enum.text import PP_ALIGN, MSO_ANCHOR
from pptx.enum.shapes import MSO_SHAPE
from PIL import Image

# ── Colour palette ──────────────────────────────────────────────
NAVY       = RGBColor(0x0D, 0x2B, 0x55)   # deep navy – bg
TEAL       = RGBColor(0x00, 0x8B, 0x8B)   # teal accent
GOLD       = RGBColor(0xF0, 0xA5, 0x00)   # amber/gold accent
WHITE      = RGBColor(0xFF, 0xFF, 0xFF)
LIGHT_GREY = RGBColor(0xF0, 0xF4, 0xF8)
MID_GREY   = RGBColor(0xCC, 0xD6, 0xE0)
DARK_TEXT  = RGBColor(0x1A, 0x1A, 0x2E)
SLIDE_W    = Inches(13.333)
SLIDE_H    = Inches(7.5)

# ── Fetch all images at once ─────────────────────────────────────
IMAGE_URLS = [
    "https://cdn.orris.care/cdss_images/pmc_clinical_VQA_dc09f0eda8d7cd9f40fe773c7b78924e66fcdd779991812b3b21b26bfd1abe89.jpg",  # 0 biopsychosocial stress→IBS
    "https://cdn.orris.care/cdss_images/pmc_clinical_VQA_94a5e71cf78c5f33507b6fc59b62e9820f56e63ae9b691502f3af670c798060f.jpg",  # 1 ascending/descending visceral pathway
    "https://cdn.orris.care/cdss_images/pmc_clinical_VQA_e1d4e6717ccea9863734595f022b2d118a5f538086ad53ce090b06e84d91570c.jpg",  # 2 CNS→ENS gut motility axis
    "https://cdn.orris.care/cdss_images/pmc_clinical_VQA_dd84e2c4593db2e36514bb69e54e0a865fd42b9f222473b409fd186afb6b9d98.jpg",  # 3 fMRI IBS vs control
    "https://cdn.orris.care/cdss_images/ee96e3c60f27623d0ad773d5b5844d9fb10b5965867b0b141106bf7e80c232ae.png",               # 4 IBS diagnostic algorithm
    "https://cdn.orris.care/cdss_images/pmc_clinical_VQA_ac7a6cb994ee7cbe8269e31542997ddea41dcfe079c340e70bcdcfa7e9bfd978.jpg",  # 5 fMRI IBS vs control (ACC/PFC)
]
raw_result = subprocess.check_output(
    ["python", "/tmp/skills/shared/scripts/fetch_images.py"] + IMAGE_URLS
)
imgs = json.loads(raw_result)

def get_img(idx):
    d = imgs[idx]
    if d["base64"]:
        raw = base64.b64decode(d["base64"].split(",", 1)[1])
        return BytesIO(raw)
    return None

def add_picture_centered(slide, img_io, top, max_h, max_w=None):
    """Add picture centered horizontally, respecting max height."""
    img_io.seek(0)
    w_px, h_px = Image.open(img_io).size
    img_io.seek(0)
    disp_h = max_h
    disp_w = int(disp_h * (w_px / h_px))
    if max_w and disp_w > max_w:
        disp_w = max_w
        disp_h = int(disp_w * (h_px / w_px))
    left = int((SLIDE_W - disp_w) / 2)
    slide.shapes.add_picture(img_io, left, top, width=disp_w, height=disp_h)

# ── Helper: solid background ─────────────────────────────────────
def set_bg(slide, color):
    bg = slide.background
    bg.fill.solid()
    bg.fill.fore_color.rgb = color

# ── Helper: add rectangle ────────────────────────────────────────
def add_rect(slide, left, top, width, height, fill_color, line_color=None, radius=False):
    shape_type = MSO_SHAPE.ROUNDED_RECTANGLE if radius else MSO_SHAPE.RECTANGLE
    shape = slide.shapes.add_shape(shape_type, left, top, width, height)
    shape.fill.solid()
    shape.fill.fore_color.rgb = fill_color
    if line_color:
        shape.line.color.rgb = line_color
        shape.line.width = Pt(1)
    else:
        shape.line.fill.background()
    return shape

# ── Helper: text box ─────────────────────────────────────────────
def add_text(slide, text, left, top, width, height,
             font_size=18, bold=False, color=WHITE,
             align=PP_ALIGN.LEFT, italic=False, wrap=True):
    tb = slide.shapes.add_textbox(left, top, width, height)
    tf = tb.text_frame
    tf.word_wrap = wrap
    tf.margin_left = 0; tf.margin_right = 0
    tf.margin_top = 0; tf.margin_bottom = 0
    p = tf.paragraphs[0]
    p.alignment = align
    run = p.add_run()
    run.text = text
    run.font.size = Pt(font_size)
    run.font.bold = bold
    run.font.italic = italic
    run.font.color.rgb = color
    run.font.name = "Calibri"
    return tb

def add_multiline(slide, lines, left, top, width, height,
                  font_size=16, color=WHITE, bold_first=False,
                  line_spacing=None, align=PP_ALIGN.LEFT):
    """Lines = list of (text, bold, color_override_or_None)"""
    tb = slide.shapes.add_textbox(left, top, width, height)
    tf = tb.text_frame
    tf.word_wrap = True
    tf.margin_left = Inches(0.05); tf.margin_right = Inches(0.05)
    tf.margin_top = Inches(0.05); tf.margin_bottom = Inches(0.05)
    for i, item in enumerate(lines):
        if isinstance(item, str):
            text, bold, col = item, False, color
        else:
            text = item[0]
            bold = item[1] if len(item) > 1 else False
            col  = item[2] if len(item) > 2 else color
        p = tf.paragraphs[0] if i == 0 else tf.add_paragraph()
        p.alignment = align
        if line_spacing:
            from pptx.oxml.ns import qn
            from lxml import etree
            pPr = p._pPr
            if pPr is None:
                pPr = p._p.get_or_add_pPr()
            lnSpc = etree.SubElement(pPr, qn('a:lnSpc'))
            spcPct = etree.SubElement(lnSpc, qn('a:spcPct'))
            spcPct.set('val', str(int(line_spacing * 1000)))
        run = p.add_run()
        run.text = text
        run.font.size = Pt(font_size)
        run.font.bold = bold
        run.font.color.rgb = col
        run.font.name = "Calibri"
    return tb

# ═══════════════════════════════════════════════════════════════════
# BUILD PRESENTATION
# ═══════════════════════════════════════════════════════════════════
prs = Presentation()
prs.slide_width  = SLIDE_W
prs.slide_height = SLIDE_H
blank = prs.slide_layouts[6]

# ─────────────────────────────────────────────────────────────────
# SLIDE 1 – TITLE SLIDE
# ─────────────────────────────────────────────────────────────────
slide = prs.slides.add_slide(blank)
set_bg(slide, NAVY)

# Left accent bar
add_rect(slide, 0, 0, Inches(0.25), SLIDE_H, TEAL)
# Bottom accent bar
add_rect(slide, 0, Inches(6.9), SLIDE_W, Inches(0.6), TEAL)

# Title
add_text(slide, "The Gut-Brain Axis &",
         Inches(0.6), Inches(1.4), Inches(11), Inches(1.2),
         font_size=44, bold=True, color=WHITE, align=PP_ALIGN.LEFT)
add_text(slide, "IBS Pathophysiology",
         Inches(0.6), Inches(2.5), Inches(11), Inches(1.2),
         font_size=44, bold=True, color=GOLD, align=PP_ALIGN.LEFT)

# Divider line
line_rect = add_rect(slide, Inches(0.6), Inches(3.75), Inches(5), Inches(0.04), TEAL)

# Subtitle
add_text(slide, "A Comprehensive Review of Mechanisms, Evidence & Clinical Implications",
         Inches(0.6), Inches(3.9), Inches(11.5), Inches(0.8),
         font_size=18, bold=False, color=MID_GREY, align=PP_ALIGN.LEFT)

# Info strip
add_text(slide, "Sources: Goldman-Cecil Medicine 27e  •  Harrison's 22e  •  Lancet GH 2025",
         Inches(0.5), Inches(7.0), Inches(12), Inches(0.4),
         font_size=12, color=WHITE, align=PP_ALIGN.LEFT)

# ─────────────────────────────────────────────────────────────────
# SLIDE 2 – OVERVIEW / AGENDA
# ─────────────────────────────────────────────────────────────────
slide = prs.slides.add_slide(blank)
set_bg(slide, LIGHT_GREY)
add_rect(slide, 0, 0, SLIDE_W, Inches(1.1), NAVY)
add_text(slide, "Presentation Overview", Inches(0.5), Inches(0.15), Inches(12), Inches(0.8),
         font_size=30, bold=True, color=WHITE)
add_rect(slide, 0, Inches(1.1), Inches(0.25), Inches(6.4), TEAL)

topics = [
    ("1", "What is IBS? — Definition & Epidemiology"),
    ("2", "The Gut-Brain Axis — Anatomy & Physiology"),
    ("3", "Pathophysiology of IBS — Core Mechanisms"),
    ("4", "Visceral Hypersensitivity & Central Sensitization"),
    ("5", "Serotonin, Microbiota & Mucosal Immunity"),
    ("6", "Biopsychosocial Model & Stress"),
    ("7", "Clinical Features & Diagnostic Criteria"),
    ("8", "Treatment Principles — Targeting the Axis"),
]
cols = [Inches(0.8), Inches(7.1)]
for i, (num, topic) in enumerate(topics):
    row = i % 4
    col_x = cols[i // 4]
    top = Inches(1.4 + row * 1.4)
    # number circle
    circ = slide.shapes.add_shape(MSO_SHAPE.OVAL,
                                  col_x, top + Inches(0.05),
                                  Inches(0.55), Inches(0.55))
    circ.fill.solid(); circ.fill.fore_color.rgb = TEAL
    circ.line.fill.background()
    add_text(slide, num, col_x, top, Inches(0.55), Inches(0.6),
             font_size=16, bold=True, color=WHITE, align=PP_ALIGN.CENTER)
    add_text(slide, topic, col_x + Inches(0.65), top + Inches(0.05),
             Inches(5.7), Inches(0.55),
             font_size=17, bold=False, color=DARK_TEXT)

# ─────────────────────────────────────────────────────────────────
# SLIDE 3 – IBS DEFINITION & EPIDEMIOLOGY
# ─────────────────────────────────────────────────────────────────
slide = prs.slides.add_slide(blank)
set_bg(slide, NAVY)
add_rect(slide, 0, 0, SLIDE_W, Inches(1.1), RGBColor(0x06, 0x1A, 0x3A))
add_text(slide, "IBS — Definition & Epidemiology",
         Inches(0.5), Inches(0.12), Inches(12), Inches(0.85),
         font_size=30, bold=True, color=WHITE)
add_rect(slide, 0, Inches(1.08), SLIDE_W, Inches(0.06), TEAL)

# Definition box (left)
add_rect(slide, Inches(0.35), Inches(1.3), Inches(6.0), Inches(2.6),
         RGBColor(0x0F, 0x35, 0x6A), radius=True)
add_text(slide, "DEFINITION", Inches(0.5), Inches(1.4), Inches(5.7), Inches(0.45),
         font_size=13, bold=True, color=GOLD)
add_multiline(slide, [
    ("A functional bowel disorder (disorder of gut-brain interaction)", False),
    ("Characterised by chronic/recurrent abdominal pain", False),
    ("Associated with altered stool form and/or frequency", False),
    ("No identifiable structural or biochemical abnormality", False),
    ("Part of a spectrum: functional constipation, functional diarrhea, bloating", False),
], Inches(0.5), Inches(1.85), Inches(5.7), Inches(1.8),
font_size=15, color=WHITE, line_spacing=1.15)

# Epidemiology box (right)
add_rect(slide, Inches(6.75), Inches(1.3), Inches(6.2), Inches(2.6),
         RGBColor(0x0F, 0x35, 0x6A), radius=True)
add_text(slide, "EPIDEMIOLOGY", Inches(6.9), Inches(1.4), Inches(5.9), Inches(0.45),
         font_size=13, bold=True, color=GOLD)
epi_data = [
    ("Global prevalence (Rome IV)", "~4.1%"),
    ("USA/UK/Canada", "~4.6%"),
    ("Women : Men ratio", "~2 : 1"),
    ("Incidence", "38 / 10,000 person-years"),
    ("Annual physician visits (USA)", "~4.4 million"),
    ("Seek health care", "~50% of affected individuals"),
]
for j, (label, val) in enumerate(epi_data):
    y = Inches(1.85 + j * 0.33)
    add_text(slide, f"• {label}:", Inches(6.9), y, Inches(3.8), Inches(0.35),
             font_size=14, color=MID_GREY)
    add_text(slide, val, Inches(10.5), y, Inches(2.2), Inches(0.35),
             font_size=14, bold=True, color=GOLD)

# Subtypes row
add_rect(slide, Inches(0.35), Inches(4.1), SLIDE_W - Inches(0.7), Inches(0.38), TEAL, radius=True)
add_text(slide, "SUBTYPES  (Rome IV  Bristol Stool Scale)",
         Inches(0.5), Inches(4.12), Inches(12), Inches(0.34),
         font_size=14, bold=True, color=WHITE, align=PP_ALIGN.CENTER)

subtypes = [("IBS-D\nDiarrhea-predominant", "35-40%"),
            ("IBS-M\nMixed bowel habits", "35-40%"),
            ("IBS-C\nConstipation-predominant", "~25%"),
            ("IBS-U\nUnclassified", "<5%")]
cols_x = [Inches(0.35), Inches(3.65), Inches(6.95), Inches(10.25)]
for (label, pct), cx in zip(subtypes, cols_x):
    add_rect(slide, cx, Inches(4.6), Inches(2.9), Inches(1.6),
             RGBColor(0x0F, 0x35, 0x6A), radius=True)
    add_text(slide, label, cx + Inches(0.1), Inches(4.65), Inches(2.7), Inches(0.85),
             font_size=14, bold=False, color=WHITE, align=PP_ALIGN.CENTER)
    add_text(slide, pct, cx + Inches(0.1), Inches(5.5), Inches(2.7), Inches(0.5),
             font_size=20, bold=True, color=GOLD, align=PP_ALIGN.CENTER)

# ─────────────────────────────────────────────────────────────────
# SLIDE 4 – THE GUT-BRAIN AXIS
# ─────────────────────────────────────────────────────────────────
slide = prs.slides.add_slide(blank)
set_bg(slide, LIGHT_GREY)
add_rect(slide, 0, 0, SLIDE_W, Inches(1.1), NAVY)
add_text(slide, "The Gut-Brain Axis — Architecture",
         Inches(0.5), Inches(0.12), Inches(12), Inches(0.85),
         font_size=30, bold=True, color=WHITE)
add_rect(slide, 0, Inches(1.08), SLIDE_W, Inches(0.06), TEAL)

# Image
img_io = get_img(2)
if img_io:
    img_io.seek(0)
    w_px, h_px = Image.open(img_io).size
    img_io.seek(0)
    disp_h = Inches(4.8)
    disp_w = int(disp_h * (w_px / h_px))
    if disp_w > Inches(5.5):
        disp_w = Inches(5.5)
        disp_h = int(disp_w * (h_px / w_px))
    slide.shapes.add_picture(img_io, Inches(0.4), Inches(1.3), width=disp_w, height=disp_h)

# Bullet points right
bullets = [
    ("CNS", "Brain, spinal cord — processes and modulates gut signals"),
    ("ANS", "Sympathetic (inhibitory) & Parasympathetic (vagus; excitatory)"),
    ("ENS", "\"Second brain\" — 100 million neurons, operates autonomously"),
    ("HPA Axis", "Stress activates CRH → cortisol → alters gut permeability & motility"),
    ("Vagus Nerve", "Primary conduit — 80% afferent (gut → brain), 20% efferent"),
    ("Microbiota", "Bidirectional signalling via SCFAs, serotonin, cytokines, bile acids"),
    ("Immune", "Mucosal mast cells activated by stress & dysbiosis → nociception"),
]
bx = Inches(6.5)
for j, (title, desc) in enumerate(bullets):
    top = Inches(1.3 + j * 0.83)
    add_rect(slide, bx, top, Inches(0.9), Inches(0.42),
             TEAL, radius=True)
    add_text(slide, title, bx, top, Inches(0.9), Inches(0.42),
             font_size=11, bold=True, color=WHITE, align=PP_ALIGN.CENTER)
    add_text(slide, desc, bx + Inches(1.0), top, Inches(5.5), Inches(0.55),
             font_size=13, color=DARK_TEXT)

add_text(slide, "Source: Goldman-Cecil Medicine 27e",
         Inches(0.4), Inches(7.15), Inches(8), Inches(0.3),
         font_size=10, italic=True, color=RGBColor(0x77, 0x77, 0x88))

# ─────────────────────────────────────────────────────────────────
# SLIDE 5 – PATHOPHYSIOLOGY OVERVIEW
# ─────────────────────────────────────────────────────────────────
slide = prs.slides.add_slide(blank)
set_bg(slide, NAVY)
add_rect(slide, 0, 0, SLIDE_W, Inches(1.1), RGBColor(0x06, 0x1A, 0x3A))
add_text(slide, "IBS Pathophysiology — Core Mechanisms",
         Inches(0.5), Inches(0.12), Inches(12), Inches(0.85),
         font_size=30, bold=True, color=WHITE)
add_rect(slide, 0, Inches(1.08), SLIDE_W, Inches(0.06), GOLD)

mechs = [
    ("🧠 Visceral\nHypersensitivity", "Lowered pain threshold to gut distension (allodynia + hyperalgesia). Most consistent IBS finding."),
    ("⚡ Altered\nMotility", "Colonic transit slower in IBS-C, faster in IBS-D. Exaggerated gastrocolic reflex, abnormal HAPCs."),
    ("🦠 Gut\nDysbiosis", "Reduced microbiome diversity. Altered Firmicutes:Bacteroidetes ratio. SIBO in subset. Post-infectious trigger in 10–33%."),
    ("🔓 Leaky Gut\n(Permeability)", "Tight junction disruption → bacterial LPS enters mucosa → innate immune activation & neuronal sensitization."),
    ("🛡️ Mucosal\nImmunity", "Increased mast cell density near afferent nerves. Elevated IL-1β, IL-6, TNF-α → lower pain thresholds."),
    ("💊 Serotonin\nDysregulation", "95% gut 5-HT from EC cells. Low SERT in IBS-D → elevated 5-HT. Reduced 5-HT availability in IBS-C."),
]
cols_per_row = 3
for idx, (title, desc) in enumerate(mechs):
    row = idx // cols_per_row
    col = idx % cols_per_row
    cx = Inches(0.3 + col * 4.3)
    cy = Inches(1.25 + row * 2.8)
    add_rect(slide, cx, cy, Inches(4.0), Inches(2.5),
             RGBColor(0x0F, 0x35, 0x6A), radius=True)
    add_text(slide, title, cx + Inches(0.15), cy + Inches(0.1), Inches(3.7), Inches(0.75),
             font_size=15, bold=True, color=GOLD, align=PP_ALIGN.LEFT)
    add_rect(slide, cx + Inches(0.15), cy + Inches(0.85), Inches(3.7), Inches(0.04), TEAL)
    add_text(slide, desc, cx + Inches(0.15), cy + Inches(0.95), Inches(3.7), Inches(1.4),
             font_size=13, color=WHITE, wrap=True)

# ─────────────────────────────────────────────────────────────────
# SLIDE 6 – VISCERAL HYPERSENSITIVITY (with fMRI images)
# ─────────────────────────────────────────────────────────────────
slide = prs.slides.add_slide(blank)
set_bg(slide, LIGHT_GREY)
add_rect(slide, 0, 0, SLIDE_W, Inches(1.1), NAVY)
add_text(slide, "Visceral Hypersensitivity & Central Sensitization",
         Inches(0.5), Inches(0.12), Inches(12), Inches(0.85),
         font_size=30, bold=True, color=WHITE)
add_rect(slide, 0, Inches(1.08), SLIDE_W, Inches(0.06), TEAL)

# Left: ascending pathway diagram
img_io = get_img(1)
if img_io:
    img_io.seek(0)
    w_px, h_px = Image.open(img_io).size
    img_io.seek(0)
    disp_h = Inches(4.4)
    disp_w = int(disp_h * (w_px / h_px))
    if disp_w > Inches(6.0):
        disp_w = Inches(6.0)
        disp_h = int(disp_w * (h_px / w_px))
    slide.shapes.add_picture(img_io, Inches(0.3), Inches(1.3), width=disp_w, height=disp_h)

# Right: text
points = [
    ("Peripheral Sensitization", "Repetitive gut stimuli sensitise nociceptors; mast cell mediators (histamine, tryptase) activate afferent TRPV1 & TRPA1 receptors"),
    ("Central Sensitization", "Wind-up in spinal cord dorsal horn; altered descending inhibitory pathways (noradrenergic, serotonergic, opioid)"),
    ("Brain Regions Involved", "Anterior cingulate cortex (ACC), insula, prefrontal cortex, thalamus — all show exaggerated fMRI activation in IBS"),
    ("Clinical Result", "Pain at lower distension thresholds than controls (allodynia); exaggerated pain at normal thresholds (hyperalgesia)"),
]
bx = Inches(7.0)
for j, (title, desc) in enumerate(points):
    top = Inches(1.3 + j * 1.4)
    add_rect(slide, bx, top, Inches(5.9), Inches(0.38), NAVY, radius=True)
    add_text(slide, title, bx + Inches(0.12), top + Inches(0.04), Inches(5.6), Inches(0.35),
             font_size=14, bold=True, color=GOLD)
    add_text(slide, desc, bx + Inches(0.12), top + Inches(0.42), Inches(5.6), Inches(0.9),
             font_size=13, color=DARK_TEXT, wrap=True)

add_text(slide, "Ascending visceral pathway (a) and descending pain modulation (b) in IBS. Source: Sleisenger & Fordtran",
         Inches(0.3), Inches(7.15), Inches(9), Inches(0.3),
         font_size=10, italic=True, color=RGBColor(0x55, 0x55, 0x66))

# ─────────────────────────────────────────────────────────────────
# SLIDE 7 – BIOPSYCHOSOCIAL MODEL (with image)
# ─────────────────────────────────────────────────────────────────
slide = prs.slides.add_slide(blank)
set_bg(slide, NAVY)
add_rect(slide, 0, 0, SLIDE_W, Inches(1.1), RGBColor(0x06, 0x1A, 0x3A))
add_text(slide, "The Biopsychosocial Model of IBS",
         Inches(0.5), Inches(0.12), Inches(12), Inches(0.85),
         font_size=30, bold=True, color=WHITE)
add_rect(slide, 0, Inches(1.08), SLIDE_W, Inches(0.06), GOLD)

# Image
img_io = get_img(0)
if img_io:
    img_io.seek(0)
    w_px, h_px = Image.open(img_io).size
    img_io.seek(0)
    disp_h = Inches(4.5)
    disp_w = int(disp_h * (w_px / h_px))
    if disp_w > Inches(5.8):
        disp_w = Inches(5.8)
        disp_h = int(disp_w * (h_px / w_px))
    slide.shapes.add_picture(img_io, Inches(0.3), Inches(1.3), width=disp_w, height=disp_h)

# Right column
bx = Inches(6.8)
add_rect(slide, bx, Inches(1.3), Inches(6.2), Inches(5.8),
         RGBColor(0x0F, 0x35, 0x6A), radius=True)
add_text(slide, "Biopsychosocial Factors in IBS",
         bx + Inches(0.15), Inches(1.4), Inches(5.9), Inches(0.5),
         font_size=16, bold=True, color=GOLD)

factors = [
    ("BIOLOGICAL", ["Genetic polymorphisms (SCL6A4, ADRA2A)", "Post-infectious gut changes", "Altered ENS structure", "Hormonal influences (F>M, menstrual cycle)"]),
    ("PSYCHOLOGICAL", ["Anxiety & depression (40-60% comorbidity)", "Somatization and catastrophizing", "Adverse childhood experiences (ACEs)", "Psychological stress as trigger"]),
    ("SOCIAL", ["Social stress and life events", "Health-care-seeking behaviour", "Work absenteeism & productivity loss", "Cultural attitudes to bowel function"]),
]
y_off = Inches(2.0)
for cat, items in factors:
    add_rect(slide, bx + Inches(0.15), y_off, Inches(1.4), Inches(0.32), TEAL, radius=True)
    add_text(slide, cat, bx + Inches(0.15), y_off, Inches(1.4), Inches(0.32),
             font_size=10, bold=True, color=WHITE, align=PP_ALIGN.CENTER)
    for item in items:
        y_off += Inches(0.38)
        add_text(slide, f"  • {item}", bx + Inches(0.2), y_off, Inches(5.8), Inches(0.35),
                 font_size=13, color=WHITE)
    y_off += Inches(0.45)

# ─────────────────────────────────────────────────────────────────
# SLIDE 8 – SEROTONIN & MICROBIOTA
# ─────────────────────────────────────────────────────────────────
slide = prs.slides.add_slide(blank)
set_bg(slide, LIGHT_GREY)
add_rect(slide, 0, 0, SLIDE_W, Inches(1.1), NAVY)
add_text(slide, "Serotonin Dysregulation & Gut Microbiota",
         Inches(0.5), Inches(0.12), Inches(12), Inches(0.85),
         font_size=30, bold=True, color=WHITE)
add_rect(slide, 0, Inches(1.08), SLIDE_W, Inches(0.06), TEAL)

# Left: serotonin panel
add_rect(slide, Inches(0.3), Inches(1.25), Inches(6.1), Inches(5.8),
         RGBColor(0xE8, 0xF0, 0xF8), radius=True)
add_text(slide, "5-HT (Serotonin) in IBS",
         Inches(0.45), Inches(1.35), Inches(5.8), Inches(0.45),
         font_size=17, bold=True, color=NAVY)
add_rect(slide, Inches(0.45), Inches(1.8), Inches(5.8), Inches(0.04), TEAL)
serotonin_lines = [
    "• 95% of body's serotonin stored in gut enterochromaffin (EC) cells",
    "• Released by mechanical/chemical stimulation",
    "• Acts on 5-HT3 (motility, nausea) and 5-HT4 (peristalsis) receptors",
    "",
    "IBS-D:  ↓ SERT expression → ↑ mucosal 5-HT → accelerated transit",
    "IBS-C:  ↓ 5-HT availability → slowed transit, hard stools",
    "",
    "Therapeutic targets:",
    "  → Alosetron (5-HT3 antagonist) — slows transit in IBS-D",
    "  → Tegaserod (5-HT4 agonist) — accelerates transit in IBS-C",
]
for j, line in enumerate(serotonin_lines):
    bold = line.startswith("IBS-") or line.startswith("Therapeutic")
    col = DARK_TEXT if not bold else NAVY
    add_text(slide, line, Inches(0.5), Inches(2.0 + j * 0.42), Inches(5.7), Inches(0.42),
             font_size=13, bold=bold, color=col)

# Right: microbiota panel
add_rect(slide, Inches(6.8), Inches(1.25), Inches(6.2), Inches(5.8),
         RGBColor(0xE8, 0xF0, 0xF8), radius=True)
add_text(slide, "Gut Microbiota & Dysbiosis",
         Inches(6.95), Inches(1.35), Inches(5.9), Inches(0.45),
         font_size=17, bold=True, color=NAVY)
add_rect(slide, Inches(6.95), Inches(1.8), Inches(5.9), Inches(0.04), TEAL)
micro_lines = [
    "• Normal microbiome: 38 trillion bacteria, 500+ species",
    "• IBS: reduced diversity, altered Firmicutes:Bacteroidetes ratio",
    "",
    "Mechanisms of dysbiosis in IBS:",
    "  → ↑ Intestinal permeability (leaky gut)",
    "  → Mucosal mast cell activation",
    "  → Altered SCFA production → motility changes",
    "  → Immune activation → visceral sensitisation",
    "",
    "Post-infectious IBS (10-33% of cases):",
    "  Salmonella, Campylobacter, ETEC, Giardia,",
    "  Norovirus → persistent ENS/immune changes",
    "",
    "Rifaximin (non-absorbed antibiotic) targets dysbiosis",
    "Probiotics: modest benefit (strain-specific)",
]
for j, line in enumerate(micro_lines):
    bold = line.endswith(":") or "Rifaximin" in line
    add_text(slide, line, Inches(7.0), Inches(2.0 + j * 0.38), Inches(5.9), Inches(0.38),
             font_size=12.5, bold=bold, color=DARK_TEXT)

# ─────────────────────────────────────────────────────────────────
# SLIDE 9 – ROME IV DIAGNOSTIC CRITERIA
# ─────────────────────────────────────────────────────────────────
slide = prs.slides.add_slide(blank)
set_bg(slide, NAVY)
add_rect(slide, 0, 0, SLIDE_W, Inches(1.1), RGBColor(0x06, 0x1A, 0x3A))
add_text(slide, "Rome IV Diagnostic Criteria & Red Flags",
         Inches(0.5), Inches(0.12), Inches(12), Inches(0.85),
         font_size=30, bold=True, color=WHITE)
add_rect(slide, 0, Inches(1.08), SLIDE_W, Inches(0.06), GOLD)

# Rome IV box
add_rect(slide, Inches(0.3), Inches(1.3), Inches(7.5), Inches(4.8),
         RGBColor(0x0F, 0x35, 0x6A), radius=True)
add_text(slide, "ROME IV CRITERIA (2016)",
         Inches(0.5), Inches(1.4), Inches(7.1), Inches(0.45),
         font_size=15, bold=True, color=GOLD)
rome_lines = [
    "CORE:  Recurrent abdominal pain ≥1 day/week (last 3 months)",
    "       Symptoms present for ≥6 months",
    "       PLUS 2 or more of:",
    "           ✓  Related to defecation",
    "           ✓  Associated with change in stool FREQUENCY",
    "           ✓  Associated with change in stool FORM",
    "",
    "SUPPORTIVE (increase diagnostic confidence):",
    "  • Abnormal frequency: ≤3/week OR >3/day",
    "  • Abnormal form: lumpy/hard OR loose/watery (Bristol scale)",
    "  • Straining, urgency, incomplete evacuation",
    "  • Mucus in stools",
    "  • Bloating / abdominal distension",
]
for j, line in enumerate(rome_lines):
    bold = "CORE:" in line or "SUPPORTIVE" in line
    col = GOLD if bold else WHITE
    add_text(slide, line, Inches(0.5), Inches(1.9 + j * 0.31), Inches(7.1), Inches(0.3),
             font_size=13, bold=bold, color=col)

# Red flags box
add_rect(slide, Inches(8.1), Inches(1.3), Inches(4.9), Inches(4.8),
         RGBColor(0x5A, 0x0A, 0x0A), radius=True)
add_text(slide, "🚩 RED FLAGS — Investigate",
         Inches(8.25), Inches(1.4), Inches(4.6), Inches(0.45),
         font_size=15, bold=True, color=RGBColor(0xFF, 0x66, 0x66))
red_flags = [
    "New onset after age 50",
    "Unintentional weight loss",
    "Rectal bleeding / melena",
    "Nocturnal diarrhea",
    "Iron-deficiency anaemia",
    "Palpable abdominal mass",
    "Family history: CRC / IBD / celiac",
    "Fever or elevated CRP",
    "Progressive deterioration",
]
for j, flag in enumerate(red_flags):
    add_text(slide, f"▸  {flag}", Inches(8.3), Inches(1.9 + j * 0.42), Inches(4.5), Inches(0.38),
             font_size=13, color=RGBColor(0xFF, 0xCC, 0xCC))

add_text(slide, "Adapted from Goldman-Cecil Medicine 27e, Table 123-1",
         Inches(0.3), Inches(7.2), Inches(8), Inches(0.28),
         font_size=10, italic=True, color=MID_GREY)

# ─────────────────────────────────────────────────────────────────
# SLIDE 10 – INVESTIGATIONS
# ─────────────────────────────────────────────────────────────────
slide = prs.slides.add_slide(blank)
set_bg(slide, LIGHT_GREY)
add_rect(slide, 0, 0, SLIDE_W, Inches(1.1), NAVY)
add_text(slide, "Investigations in IBS",
         Inches(0.5), Inches(0.12), Inches(12), Inches(0.85),
         font_size=30, bold=True, color=WHITE)
add_rect(slide, 0, Inches(1.08), SLIDE_W, Inches(0.06), TEAL)

# Recommended column
add_rect(slide, Inches(0.3), Inches(1.3), Inches(5.8), Inches(5.2),
         RGBColor(0xD0, 0xEC, 0xE8), radius=True)
add_text(slide, "✅  RECOMMENDED",
         Inches(0.5), Inches(1.4), Inches(5.5), Inches(0.45),
         font_size=16, bold=True, color=RGBColor(0x00, 0x66, 0x55))
rec_tests = [
    ("CBC", "Exclude anaemia, infection"),
    ("CRP / ESR", "Exclude active inflammation (IBD)"),
    ("Fecal calprotectin", "Elevated in IBD; helps differentiate"),
    ("Celiac serologies\n(tTG-IgA + total IgA)", "Especially in IBS-D; celiac mimics IBS"),
    ("TSH", "Exclude thyroid dysfunction"),
    ("Colonoscopy", "If age ≥50 or any alarm features"),
    ("Biopsies (colonoscopy)", "Rule out microscopic colitis (IBS-D)"),
]
for j, (test, note) in enumerate(rec_tests):
    top = Inches(1.95 + j * 0.63)
    add_text(slide, test, Inches(0.5), top, Inches(2.5), Inches(0.6),
             font_size=13, bold=True, color=DARK_TEXT)
    add_text(slide, note, Inches(2.95), top, Inches(3.0), Inches(0.6),
             font_size=13, color=DARK_TEXT)

# Not recommended column
add_rect(slide, Inches(6.5), Inches(1.3), Inches(6.0), Inches(2.6),
         RGBColor(0xF8, 0xE8, 0xE8), radius=True)
add_text(slide, "❌  NOT ROUTINELY RECOMMENDED",
         Inches(6.65), Inches(1.4), Inches(5.7), Inches(0.45),
         font_size=15, bold=True, color=RGBColor(0xAA, 0x00, 0x00))
not_rec = [
    "Routine stool testing (no alarm features)",
    "Abdominal imaging (no alarm features)",
    "Colonoscopy in patients <45 yrs without alarm",
    "Hydrogen breath test (unless SIBO suspected)",
    "Small bowel imaging (unless Crohn's suspected)",
]
for j, item in enumerate(not_rec):
    add_text(slide, f"✗  {item}", Inches(6.65), Inches(1.95 + j * 0.4), Inches(5.7), Inches(0.38),
             font_size=13, color=DARK_TEXT)

# Diagnostic algorithm image
img_io = get_img(4)
if img_io:
    img_io.seek(0)
    w_px, h_px = Image.open(img_io).size
    img_io.seek(0)
    disp_h = Inches(2.5)
    disp_w = int(disp_h * (w_px / h_px))
    if disp_w > Inches(5.8):
        disp_w = Inches(5.8)
        disp_h = int(disp_w * (h_px / w_px))
    slide.shapes.add_picture(img_io, Inches(6.5), Inches(4.1), width=disp_w, height=disp_h)
add_text(slide, "Diagnostic algorithm (Goldman-Cecil Medicine 27e, Fig. 123-1)",
         Inches(6.5), Inches(7.15), Inches(6.5), Inches(0.28),
         font_size=10, italic=True, color=RGBColor(0x55, 0x55, 0x66))

# ─────────────────────────────────────────────────────────────────
# SLIDE 11 – TREATMENT
# ─────────────────────────────────────────────────────────────────
slide = prs.slides.add_slide(blank)
set_bg(slide, NAVY)
add_rect(slide, 0, 0, SLIDE_W, Inches(1.1), RGBColor(0x06, 0x1A, 0x3A))
add_text(slide, "Treatment — Targeting the Gut-Brain Axis",
         Inches(0.5), Inches(0.12), Inches(12), Inches(0.85),
         font_size=30, bold=True, color=WHITE)
add_rect(slide, 0, Inches(1.08), SLIDE_W, Inches(0.06), GOLD)

treatment_cols = [
    ("LIFESTYLE & DIET", TEAL, [
        "Patient education & reassurance",
        "Low-FODMAP diet (50–80% response)",
        "Soluble fibre (psyllium) for IBS-C",
        "Regular physical activity",
        "Stress management / sleep hygiene",
    ]),
    ("PHARMACOLOGICAL", RGBColor(0x00, 0x7A, 0xCC), [
        "Antispasmodics: peppermint oil, dicyclomine",
        "IBS-C: linaclotide 290 μg, lubiprostone 8 μg BD",
        "IBS-D: loperamide; eluxadoline; alosetron (F)",
        "Antibiotics: rifaximin 550 mg TID × 14 days",
        "Neuromodulators: TCA (pain), SSRI (IBS-C)",
    ]),
    ("PSYCHOLOGICAL", GOLD, [
        "Cognitive Behavioural Therapy (CBT)",
        "Gut-directed hypnotherapy",
        "Mindfulness-based stress reduction",
        "Psychodynamic therapy",
        "↑ Preferred for severe/refractory disease",
    ]),
]
for idx, (title, col, items) in enumerate(treatment_cols):
    cx = Inches(0.3 + idx * 4.35)
    add_rect(slide, cx, Inches(1.25), Inches(4.1), Inches(0.5), col, radius=True)
    add_text(slide, title, cx, Inches(1.25), Inches(4.1), Inches(0.5),
             font_size=14, bold=True, color=WHITE, align=PP_ALIGN.CENTER)
    add_rect(slide, cx, Inches(1.8), Inches(4.1), Inches(4.8),
             RGBColor(0x0F, 0x35, 0x6A), radius=True)
    for j, item in enumerate(items):
        add_text(slide, f"• {item}", cx + Inches(0.15), Inches(2.0 + j * 0.85),
                 Inches(3.8), Inches(0.8),
                 font_size=14, color=WHITE, wrap=True)

add_text(slide, "Key principle: Treatment should be tailored to predominant symptom (IBS-C / IBS-D / pain) and severity",
         Inches(0.3), Inches(6.85), Inches(12.7), Inches(0.38),
         font_size=14, italic=True, bold=True, color=GOLD, align=PP_ALIGN.CENTER)

# ─────────────────────────────────────────────────────────────────
# SLIDE 12 – KEY TAKEAWAYS
# ─────────────────────────────────────────────────────────────────
slide = prs.slides.add_slide(blank)
set_bg(slide, NAVY)
add_rect(slide, 0, 0, SLIDE_W, Inches(1.1), RGBColor(0x06, 0x1A, 0x3A))
add_text(slide, "Key Takeaways",
         Inches(0.5), Inches(0.12), Inches(12), Inches(0.85),
         font_size=34, bold=True, color=WHITE)
add_rect(slide, 0, Inches(1.08), SLIDE_W, Inches(0.06), TEAL)

takeaways = [
    ("1", TEAL, "IBS is a disorder of gut-brain interaction (DGBI), not a purely psychological or structural disease."),
    ("2", GOLD, "The gut-brain axis involves CNS, ANS, ENS, HPA axis, immune system, and microbiota — all dysregulated in IBS."),
    ("3", TEAL, "Visceral hypersensitivity is the most consistent pathophysiological finding — lowered pain threshold to gut distension."),
    ("4", GOLD, "Post-infectious IBS (10-33%) highlights the role of mucosal immune activation and dysbiosis as trigger mechanisms."),
    ("5", TEAL, "Rome IV criteria (≥1 day/week pain for 6 months + 2 stool-related features) are the diagnostic standard — not exclusion alone."),
    ("6", GOLD, "Treatment must target the axis: dietary (low-FODMAP), pharmacological (subtype-specific), and psychological (CBT/hypnotherapy)."),
]
for idx, (num, col, text) in enumerate(takeaways):
    row = idx // 2
    c = idx % 2
    cx = Inches(0.35 + c * 6.55)
    cy = Inches(1.3 + row * 1.85)
    add_rect(slide, cx, cy, Inches(6.2), Inches(1.65), RGBColor(0x0F, 0x35, 0x6A), radius=True)
    circ = slide.shapes.add_shape(MSO_SHAPE.OVAL, cx + Inches(0.15), cy + Inches(0.1),
                                   Inches(0.55), Inches(0.55))
    circ.fill.solid(); circ.fill.fore_color.rgb = col
    circ.line.fill.background()
    add_text(slide, num, cx + Inches(0.15), cy + Inches(0.1), Inches(0.55), Inches(0.55),
             font_size=16, bold=True, color=WHITE, align=PP_ALIGN.CENTER)
    add_text(slide, text, cx + Inches(0.82), cy + Inches(0.12), Inches(5.2), Inches(1.42),
             font_size=13.5, color=WHITE, wrap=True)

add_text(slide, "Sources: Goldman-Cecil Medicine 27e  •  Harrison's 22e (2025)  •  Lancet Gastroenterol Hepatol 2025 (PMID 40258374)",
         Inches(0.3), Inches(7.2), Inches(12.7), Inches(0.28),
         font_size=10, italic=True, color=MID_GREY, align=PP_ALIGN.CENTER)

# ─────────────────────────────────────────────────────────────────
# SAVE
# ─────────────────────────────────────────────────────────────────
out_path = "/tmp/workspace/ibs-presentation/Gut_Brain_Axis_IBS_Pathophysiology.pptx"
buf = BytesIO()
prs.save(buf)
with open(out_path, "wb") as f:
    f.write(buf.getvalue())
print(f"Saved: {out_path}")
cd /tmp/workspace/ibs-presentation && python build_pptx.py 2>&1
python3 -c " from pptx import Presentation prs = Presentation('/tmp/workspace/ibs-presentation/Gut_Brain_Axis_IBS_Pathophysiology.pptx') print(f'Slides: {len(prs.slides)}') for i, slide in enumerate(prs.slides, 1): texts = [s.text_frame.text[:60].strip() for s in slide.shapes if s.has_text_frame and s.text_frame.text.strip()] print(f' Slide {i}: {texts[0] if texts else \"(no text)\"}') import os size = os.path.getsize('/tmp/workspace/ibs-presentation/Gut_Brain_Axis_IBS_Pathophysiology.pptx') print(f'File size: {size/1024:.1f} KB') "
Gut Brain Axis IBS Pathophysiology
Presentation · PPTX
| # | Slide Title |
|---|---|
| 1 | Title Slide — Gut-Brain Axis & IBS Pathophysiology |
| 2 | Overview — 8-topic agenda |
| 3 | Definition & Epidemiology — subtypes table, Rome IV prevalence data |
| 4 | Gut-Brain Axis Architecture — CNS, ANS, ENS, vagus, HPA, microbiota, immune (with diagram) |
| 5 | Core Pathophysiology Mechanisms — 6-panel grid: visceral hypersensitivity, motility, dysbiosis, leaky gut, immunity, serotonin |
| 6 | Visceral Hypersensitivity & Central Sensitization — ascending/descending pathways diagram + ACC/PFC/insula involvement |
| 7 | Biopsychosocial Model — stress→IBS flowchart + biological/psychological/social factors |
| 8 | Serotonin Dysregulation & Gut Microbiota — 5-HT3/5-HT4, SERT, IBS-D vs IBS-C mechanisms, rifaximin |
| 9 | Rome IV Diagnostic Criteria & Red Flags — full criteria + 9 red flag alarm features |
| 10 | Investigations — recommended tests vs not recommended + diagnostic algorithm flowchart |
| 11 | Treatment — 3-column layout: Lifestyle/Diet, Pharmacological, Psychological |
| 12 | Key Takeaways — 6 core messages with numbered highlight boxes |