I now have comprehensive textbook data to compile a thorough, well-organized answer. Let me compose the full response.
Ventilator Settings with Indications by Clinical Condition
Core Concepts: What You Set and Why
Every ventilator order involves decisions across two physiological goals:
| Goal | Parameters |
|---|
| Oxygenation | FiO2, PEEP |
| Ventilation (CO2/pH) | Tidal Volume (VT), Respiratory Rate (RR) |
A useful clinical heuristic: if pH is the problem, fix ventilation (RR/VT); if oxygenation is the problem, fix FiO2/PEEP.
1. Ventilator Modes
A. Assist-Control (A/C) - Most Common Initial Mode
The patient can trigger a breath at any rate, but always receives at least the preset number of breaths. Every breath - triggered or mandatory - is a full-sized ventilator breath.
| Subtype | Clinician Sets | Best For |
|---|
| AC-VC (Volume Control) | Tidal volume, inspiratory flow, PEEP, RR | Paralyzed/deeply sedated patients; lung-protective ventilation (ARDS) |
| AC-PC (Pressure Control) | Target pressure, inspiratory time, PEEP, RR | Low-compliance lungs; patients with high airway pressures in VC |
Caution: In A/C, spontaneous efforts trigger full-sized breaths - this risks hyperventilation and air trapping if the patient is not adequately sedated.
B. SIMV (Synchronized Intermittent Mandatory Ventilation)
Delivers mandatory breaths at a set rate synchronized with patient effort; between mandatory breaths, the patient breathes spontaneously (often with Pressure Support added).
- Best for: Patients with regular but poor spontaneous effort; weaning
- Caveat: Increases work of breathing compared to A/C; has largely fallen out of favor for initial ventilation
C. Pressure Support Ventilation (PSV)
Patient-triggered, pressure-targeted, flow-cycled. No mandatory rate - every breath is patient-initiated.
- Best for: Spontaneously breathing patients requiring minimal support; weaning trials
- Clinician sets: Pressure support level (typically 5-20 cm H2O) and PEEP
D. CPAP / BiPAP (Non-Invasive)
| Mode | Settings | Indication |
|---|
| CPAP | Single pressure (5-10 cm H2O) | Obstructive sleep apnea; mild hypoxemia; COPD with minimal CO2 retention |
| BiPAP | IPAP (start 10) + EPAP (start 5) | COPD exacerbation with respiratory acidosis; cardiogenic pulmonary edema; hypercarbic failure |
2. Initial Ventilator Settings: General (Standard Patient)
(Rosen's Emergency Medicine; Washington Manual)
| Parameter | Setting |
|---|
| Mode | AC/VC (most common) |
| Tidal Volume (VT) | 6-8 mL/kg Ideal Body Weight (IBW) |
| Respiratory Rate | 12-14 breaths/min (or match pre-intubation rate) |
| FiO2 | Start at 100%, wean rapidly to keep SpO2 88-94% |
| PEEP | 5 cm H2O (standard starting point) |
| Inspiratory Flow Rate | ≥60 L/min |
| I:E Ratio | 1:2 (standard) |
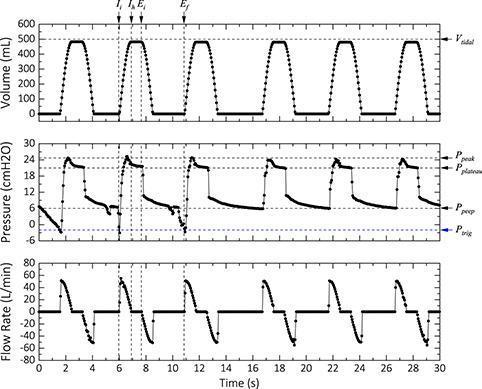
| Plateau Pressure (Pplat) | Keep <30 cm H2O |
IBW Formula:
- Male: 50 kg + 2.3 kg × (height in inches - 60)
- Female: 45.5 kg + 2.3 kg × (height in inches - 60)
3. Condition-Specific Settings
3a. ARDS (Acute Respiratory Distress Syndrome)
Lung-Protective Ventilation - the ARDSNet Protocol (Murray & Nadel; Goldman-Cecil)
| Parameter | Target |
|---|
| Mode | AC/VC preferred |
| VT | 6 mL/kg IBW (start at 8, reduce to 6 over <4 hrs) |
| RR | Up to 35 breaths/min to maintain minute ventilation |
| FiO2 | Titrate to SaO2 88-95% (PaO2 55-80 mmHg) |
| PEEP | Minimum 5 cm H2O; use ARDSNet PEEP/FiO2 table (see below) |
| Plateau Pressure | ≤30 cm H2O (strictly enforced) |
| Permissive Hypercapnia | Tolerate pH ≥7.20 to avoid high pressures |
ARDSNet PEEP/FiO2 Table (Lower PEEP Strategy):
| FiO2 | 0.30 | 0.40 | 0.50 | 0.60 | 0.70 | 0.80 | 0.90 | 1.0 |
|---|
| PEEP | 5 | 5-8 | 8-10 | 10 | 10-14 | 14 | 14-18 | 18-24 |
Low VT ventilation reduces inflammatory cytokines in BAL fluid and plasma, attenuating ventilator-induced lung injury (VILI). - Murray & Nadel's Textbook of Respiratory Medicine
Rescue Strategies for Refractory Hypoxemia (PaO2/FiO2 <100):
- Prone positioning (16+ hrs/day)
- High PEEP / recruitment maneuvers
- Neuromuscular blockade (cisatracurium)
- Inhaled nitric oxide / prostacyclins
- ECMO (veno-venous) in severe refractory cases
3b. COPD Exacerbation
First-line: NIV (BiPAP) - indicated for respiratory acidosis (PaCO2 >45 mmHg, pH ≤7.35)
Invasive ventilation indicated when: (Harrison's 22E)
- Severe respiratory distress unresponsive to NIV
- Hemodynamic instability
- Impaired mental status / inability to cooperate with NIV
- Respiratory arrest
Key Ventilator Adjustments for COPD:
| Parameter | Setting | Rationale |
|---|
| Mode | AC/VC | Full support initially |
| VT | 8 mL/kg IBW | Slightly higher than ARDS |
| RR | 10 breaths/min (low!) | Allow maximum expiratory time |
| I:E Ratio | 1:3 to 1:4 (prolonged expiration) | Prevent auto-PEEP and air trapping |
| Inspiratory Flow | 60-80 L/min | Faster delivery = more time for expiration |
| PEEP | 5 cm H2O (avoid high PEEP) | External PEEP can worsen air trapping |
| FiO2 | Target SpO2 88-92% | Avoid hyperoxia/Haldane effect |
| Permissive Hypercapnia | Tolerate pH 7.25-7.30 | Avoid barotrauma from over-ventilation |
Auto-PEEP (intrinsic PEEP) results from incomplete exhalation. It adds an inspiratory load and can cause hemodynamic compromise. Detected by end-expiratory occlusion on the ventilator. - Harrison's Principles of Internal Medicine 22E
3c. Status Asthmaticus
Similar to COPD but more extreme obstructive physiology:
| Parameter | Setting |
|---|
| Mode | AC/VC |
| VT | 6-8 mL/kg IBW |
| RR | 8-12 breaths/min (very low) |
| I:E Ratio | 1:4 or greater |
| Inspiratory Flow | 80-100 L/min |
| PEEP | 0-5 cm H2O (minimal) |
| FiO2 | 100% initially, then wean |
| Pplat | Keep <30 cm H2O; accept hypercapnia to achieve this |
Goal: Maximize expiratory time. Accept hypercapnia (pH >7.20). Deep sedation ± paralysis often required.
3d. Cardiogenic Pulmonary Edema (ACPE)
First-line: CPAP or BiPAP (NIV)
| Mode | Settings | Effect |
|---|
| CPAP | 5-10 cm H2O | Reduces preload, improves FRC, recruits alveoli |
| BiPAP | IPAP 10-15 / EPAP 5-8 | Reduces work of breathing + preload |
If intubation required:
- AC/VC with VT 6-8 mL/kg, PEEP 8-10, FiO2 titrated to SpO2 >94%
3e. Pneumonia / Hypoxemic Respiratory Failure (without ARDS)
| Parameter | Setting |
|---|
| Mode | AC/VC |
| VT | 6-8 mL/kg IBW |
| RR | 14-18 breaths/min |
| FiO2 | Start 100%, wean to SpO2 92-96% |
| PEEP | 5-8 cm H2O |
| Pplat | <30 cm H2O |
Use intermediate VT strategy (8-10 mL/kg) for patients without ARDS who do not have obstructive physiology or acute lung injury risk. - StatPearls/NIH
3f. Neuromuscular Disease / Post-Op Apnea
| Parameter | Setting |
|---|
| Mode | AC/VC or AC/PC (full support) |
| VT | 8-10 mL/kg IBW |
| RR | 12-16 breaths/min |
| FiO2 | Start 40%, titrate |
| PEEP | 5 cm H2O |
Lungs are typically normal compliance - avoid excessive PEEP. Focus on adequate minute ventilation.
3g. TBI / Elevated ICP
| Parameter | Setting | Rationale |
|---|
| VT | 6-8 mL/kg IBW | Avoid VILI |
| RR | 14-16 (titrate to PaCO2 35-40) | Normocapnia (mild hypocapnia 30-35 briefly if herniation) |
| PEEP | 5 cm H2O (use cautiously) | High PEEP increases ICP by reducing venous return |
| FiO2 | Target PaO2 80-120 mmHg | Avoid hypoxia (worsens secondary injury) |
3h. High-Flow Nasal Cannula (HFNC)
For patients with hypoxemic respiratory failure without significant hypercarbia who may not need full intubation:
| Parameter | Initial Setting | Maximum |
|---|
| FiO2 | 50% | 100% |
| Flow Rate | 40 L/min | 60 L/min |
ROX Index = (SpO2/FiO2) / RR. If <3.85 at 2, 6, or 12 hrs → high risk of HFNC failure; proceed to intubation. - Rosen's Emergency Medicine
4. Key Pressure Limits to Monitor
| Pressure | Definition | Target | Action if Exceeded |
|---|
| Plateau (Pplat) | Alveolar pressure; measured during end-inspiratory hold | <30 cm H2O | Decrease VT by 1 mL/kg steps |
| Peak Inspiratory (PIP) | Includes airway resistance + lung compliance | Typically <40 cm H2O | Check for bronchospasm, secretions, circuit obstruction |
| Auto-PEEP | Trapped gas from incomplete exhalation | Minimize to <5 cm H2O | Increase I:E ratio, reduce RR, increase flow rate |
| Driving Pressure | Pplat - PEEP | <15 cm H2O | Strongly associated with ARDS mortality |
5. Quick Reference Table by Condition
| Condition | Mode | VT (mL/kg IBW) | RR | PEEP | FiO2 | Special Feature |
|---|
| Standard | AC/VC | 6-8 | 12-14 | 5 | 100% → wean | General post-intubation |
| ARDS | AC/VC | 6 | Up to 35 | 8-18 (table) | Titrate SaO2 88-95% | Pplat <30, driving P <15 |
| COPD | AC/VC | 8 | 10 | 5 | 88-92% | Low RR, prolong expiration |
| Asthma | AC/VC | 6-8 | 8-12 | 0-5 | 100% → wean | Max I:E 1:4; permissive hypercapnia |
| Cardiogenic pulm. edema | BiPAP/CPAP | (NIV first) | - | 5-10 | Titrate | Reduces preload |
| Pneumonia | AC/VC | 6-8 | 14-18 | 5-8 | Titrate >92% | Standard + lung-protective |
| Neuromuscular | AC/VC | 8-10 | 12-16 | 5 | 40% → wean | Normal compliance |
| TBI/ICP | AC/VC | 6-8 | 14-16 | 5 (caution) | PaO2 80-120 | Normocapnia; avoid high PEEP |
6. Weaning / Liberation
Assess readiness daily using the SBT (Spontaneous Breathing Trial):
- PEEP ≤5-8 cm H2O
- FiO2 ≤40-50%
- Adequate mental status
- Hemodynamically stable
- Resolving underlying cause
PSV trial: set pressure support 5-8 cm H2O + PEEP 5 cm H2O for 30-120 minutes. Extubate if tolerated.
Sources:
- Rosen's Emergency Medicine, 9e - Chapter: Mechanical Ventilation of the Intubated Patient
- Washington Manual of Medical Therapeutics - Ventilator Settings section
- Murray & Nadel's Textbook of Respiratory Medicine - Lung-Protective Ventilator Strategies; COPD
- Harrison's Principles of Internal Medicine 22E (2025) - COPD; ARDS management
- Roberts & Hedges' Clinical Procedures in Emergency Medicine - Modes of Ventilation