
Explain me 10 common heart disease with there characteristic ECG changes and illustrative ECG images
Reading File
Now let me run parallel searches across the medical library for ECG findings in multiple heart conditions:
Finding Sources
Finding Sources
Finding Sources
Finding Sources
Good, found key sources. Now let me read the most rich ECG content sections and search for images simultaneously:
Reading File
Reading File
Reading File
Finding Sources
Finding Sources
Excellent! Now let me fetch the key ECG images and read more content for additional conditions:
Loading Image
Loading Image
Reading File
Finding Sources
Finding Sources
Now let me search for more ECG images covering the remaining conditions:
Searching Images
STEMI ST elevation myocardial infarction ECG 12 lead
Searching Images
ventricular tachycardia ECG wide complex rhythm strip
Searching Images
Wolff-Parkinson-White WPW delta wave ECG short PR
Searching Images
pericarditis diffuse ST elevation saddle shaped ECG
Searching Images
pulmonary embolism ECG S1Q3T3 right heart strain
Excellent! Now let me search for the remaining conditions' ECG images:
Searching Images
left bundle branch block LBBB ECG QRS morphology
Searching Images
hypertrophic cardiomyopathy HCM ECG left ventricular hypertrophy deep Q waves
Searching Images
atrial flutter sawtooth P waves ECG flutter waves
Searching Images
long QT syndrome QT prolongation ECG torsades de pointes
Searching Images
ventricular fibrillation ECG chaotic waveforms cardiac arrest
I now have comprehensive content and images for all 10 conditions. Let me also fetch a few of the best images to confirm their quality, and read the atrial flutter ECG section:
Loading Image
Loading Image
Loading Image
Loading Image
Loading Image
Loading Image
Loading Image
Loading Image
I now have all the information and images needed. Here is the comprehensive guide:
10 Common Heart Diseases: ECG Changes & Illustrative Images
1. ST-Elevation Myocardial Infarction (STEMI)
ECG Hallmarks
Acute MI produces three sequential electrophysiological defects in infarcted cells (Ganong's Review of Medical Physiology):
| Defect | Current Flow | ECG Change |
|---|---|---|
| Rapid repolarization | Out of infarct | ST elevation |
| Decreased resting membrane potential | Into infarct | TQ depression (manifests as ST elevation) |
| Delayed depolarization | Out of infarct | ST elevation |
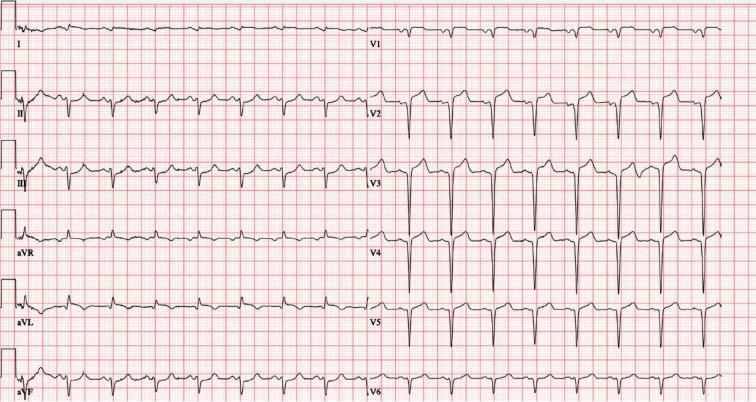
- Hyperacute T waves — earliest change (first minutes); tall, peaked, symmetric
- Convex ("tombstone") ST elevation ≥1 mm in ≥2 contiguous leads; reciprocal ST depression in opposite leads
- Pathological Q waves — appear hours–days later; indicate irreversible necrosis (>40 ms wide, >25% of R height)
- T-wave inversion — evolves as infarct matures
- R-wave loss ("failure of R-wave progression") in anterior infarcts
Localisation:
- Anterior (LAD): V1–V4 elevation
- Inferior (RCA): II, III, aVF elevation
- Lateral (Cx): I, aVL, V5–V6 elevation
2. Atrial Fibrillation (AF)
ECG Hallmarks
AF arises from chaotic multi-wavelet re-entry in the atria, producing (Guyton & Hall Textbook of Medical Physiology):
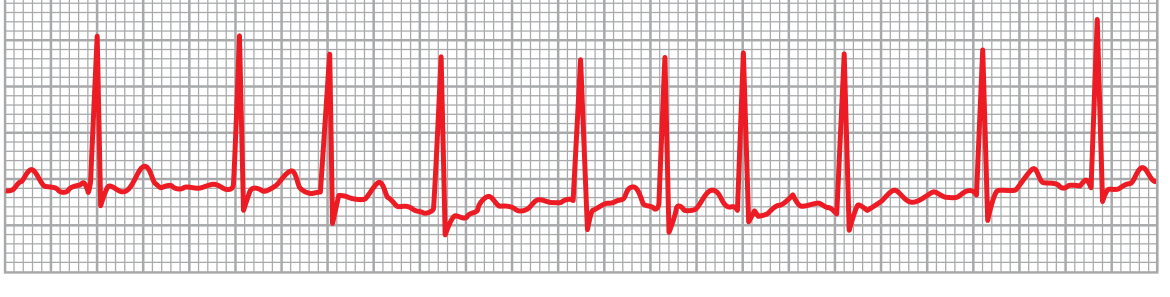
- Absence of discrete P waves — replaced by fine, irregular fibrillatory baseline ("f-waves") at 350–600/min
- Irregularly irregular ventricular rhythm — variable RR intervals; hallmark of AF
- Ventricular rate 100–160 bpm (untreated)
- Normal narrow QRS morphology (unless pre-existing aberrancy or WPW)
The variable spacing of QRS complexes on ECG is one of the primary diagnostic findings.
3. Atrioventricular (AV) Heart Block
ECG Hallmarks
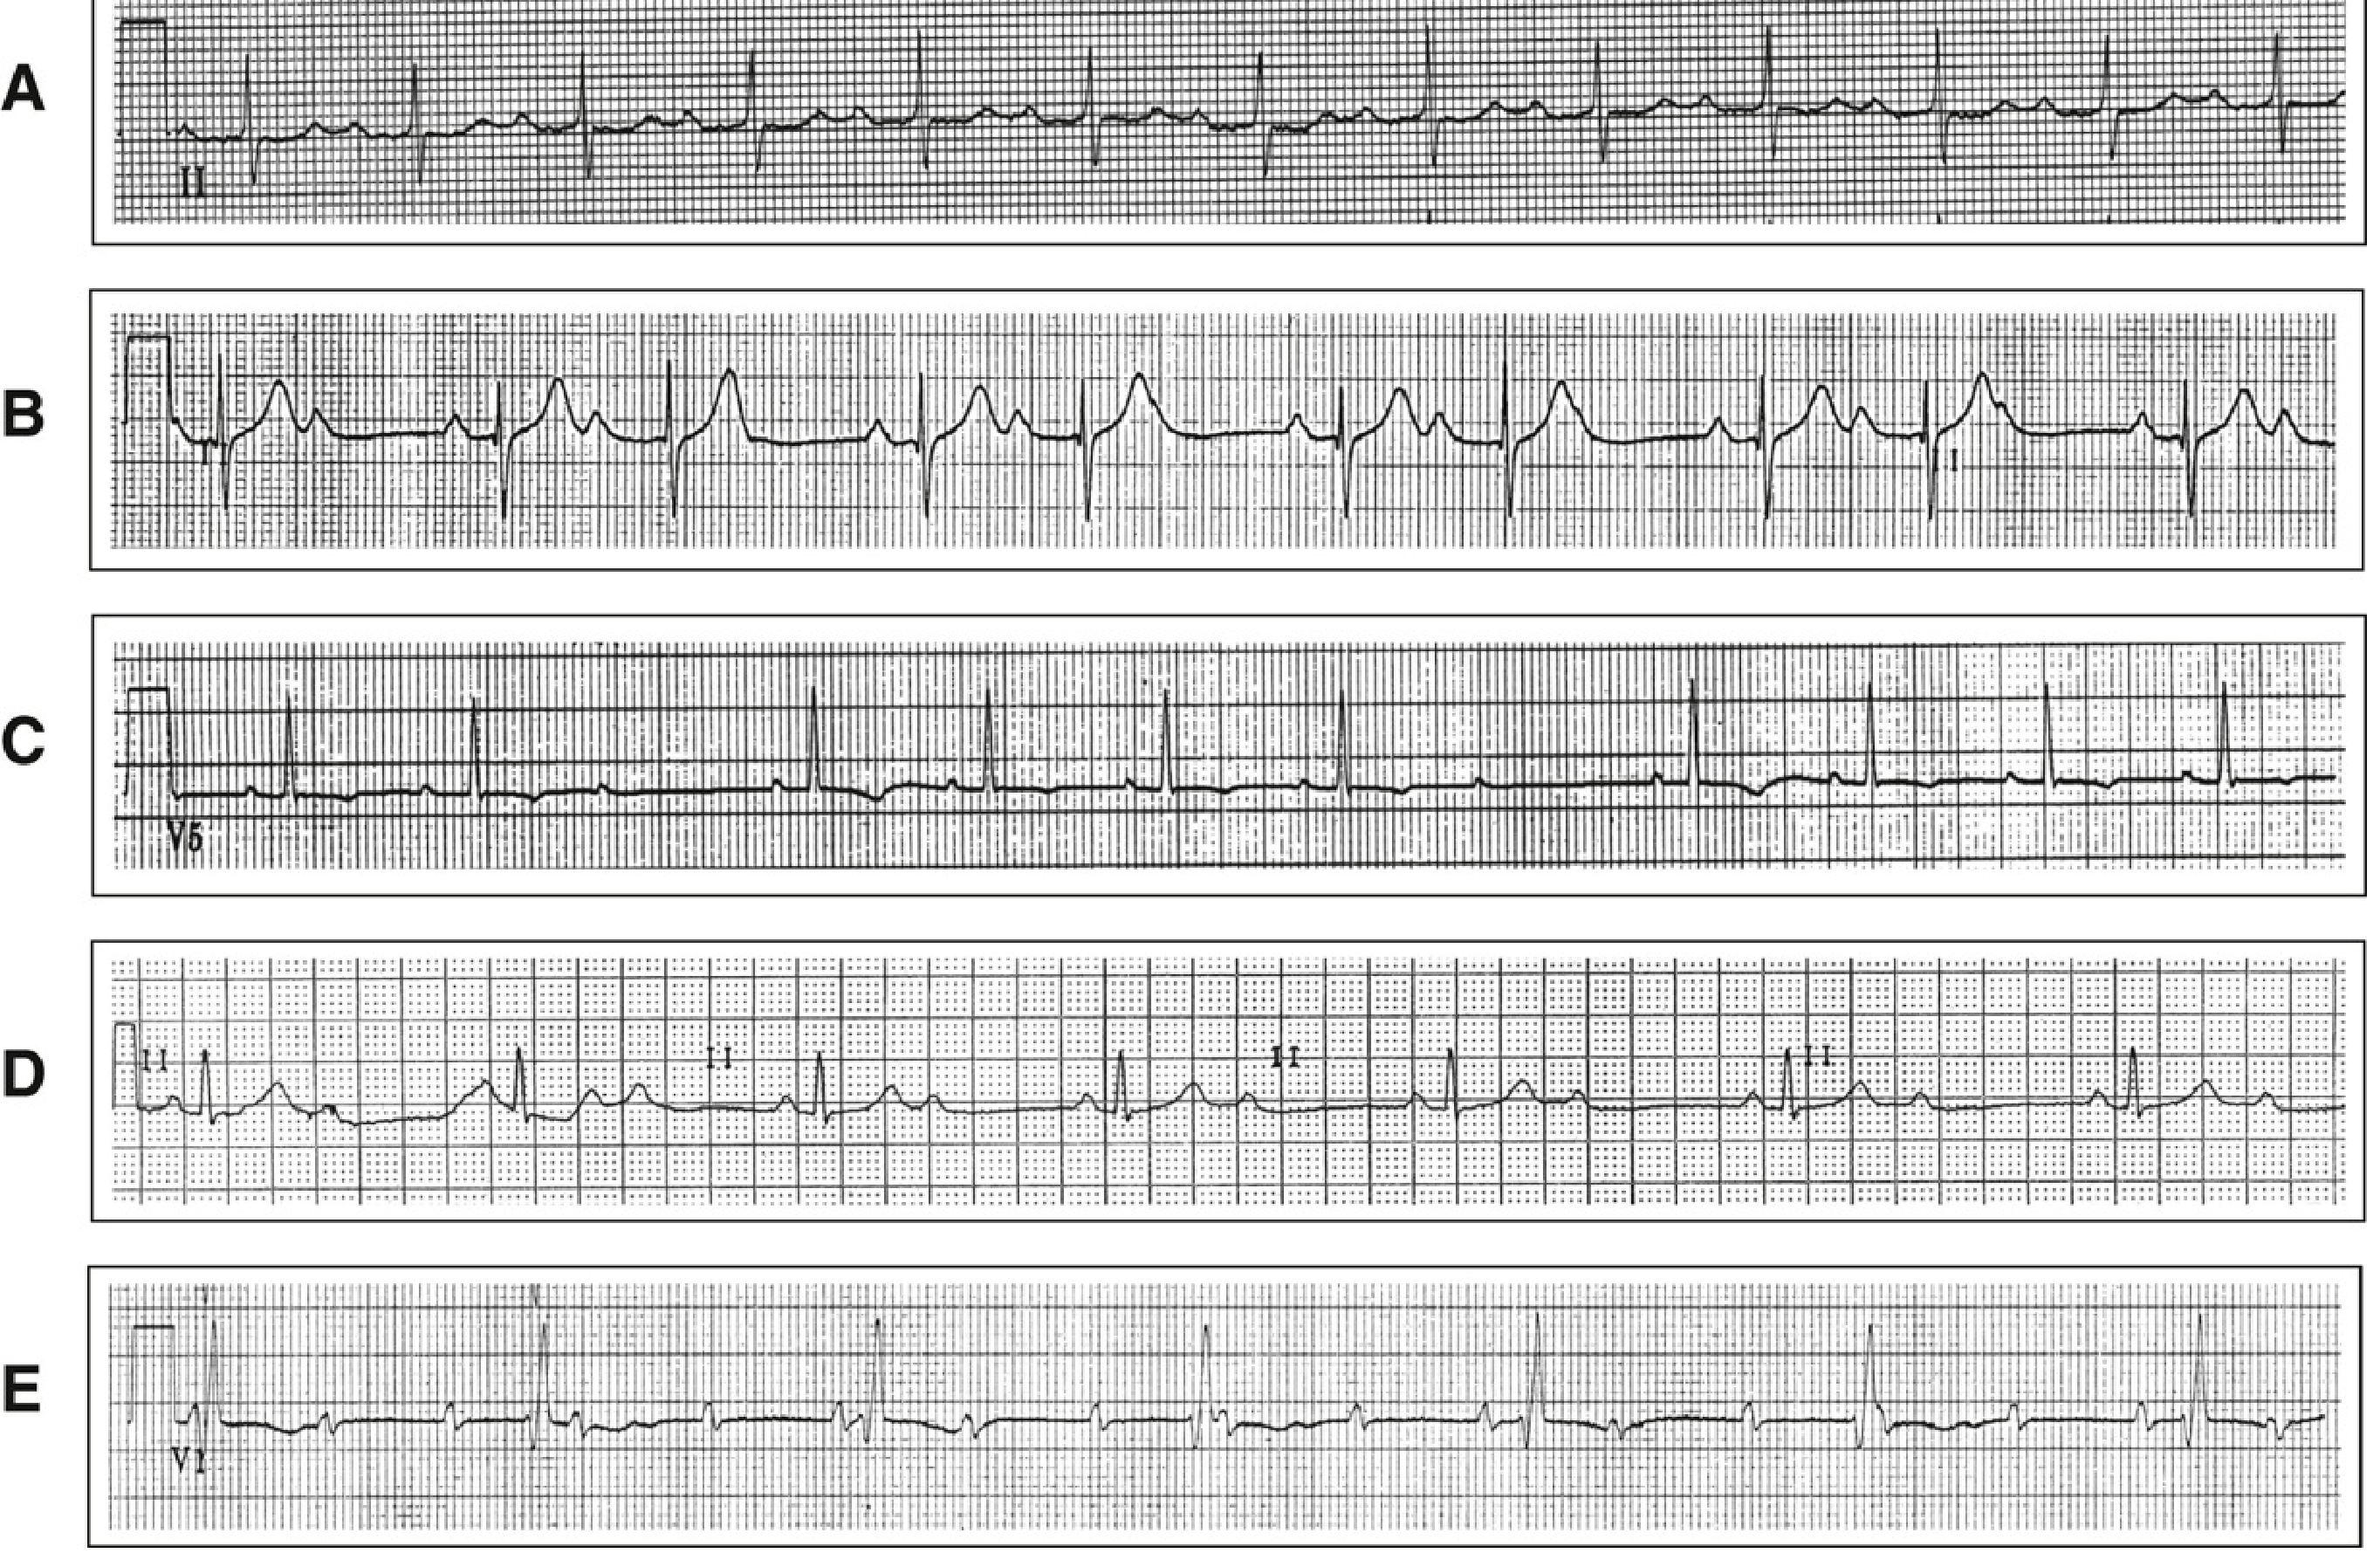
AV conduction can be delayed, periodically blocked, or completely interrupted (Washington Manual of Medical Therapeutics):
| Degree | ECG Findings |
|---|---|
| 1st degree | PR interval >200 ms; every P conducts |
| 2nd degree Mobitz I (Wenckebach) | Progressive PR lengthening → dropped QRS; "group beating"; RR intervals shorten before dropped beat |
| 2nd degree Mobitz II | Fixed PR before sudden non-conducted P wave; often with bundle branch block |
| 3rd degree (Complete) | Complete AV dissociation; atrial rate > ventricular rate; escape rhythm (junctional ~40–60 bpm or ventricular ~20–40 bpm) |
4. Left Bundle Branch Block (LBBB)
ECG Hallmarks
LBBB indicates depolarisation travels via slow cell-to-cell spread rather than the fast conduction system:
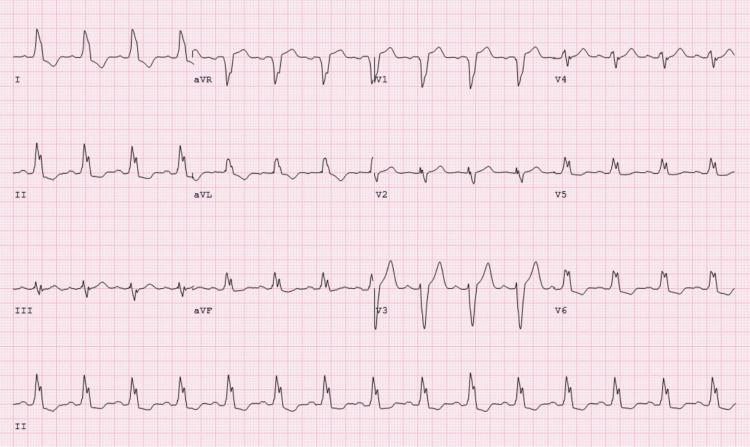
- Widened QRS ≥120 ms
- Broad, monophasic, often notched R waves in lateral leads (I, aVL, V5, V6)
- Deep, broad S waves (QS or rS pattern) in V1–V3
- Discordant ST-T changes — ST elevation in V1–V3 (opposite to QRS vector); ST depression and T-wave inversion in lateral leads
- Left axis deviation
- New LBBB can indicate acute MI (Sgarbossa criteria apply)
5. Wolff-Parkinson-White (WPW) Syndrome
ECG Hallmarks
WPW results from an accessory atrioventricular pathway (bundle of Kent) that bypasses the AV node, causing ventricular pre-excitation (Washington Manual):
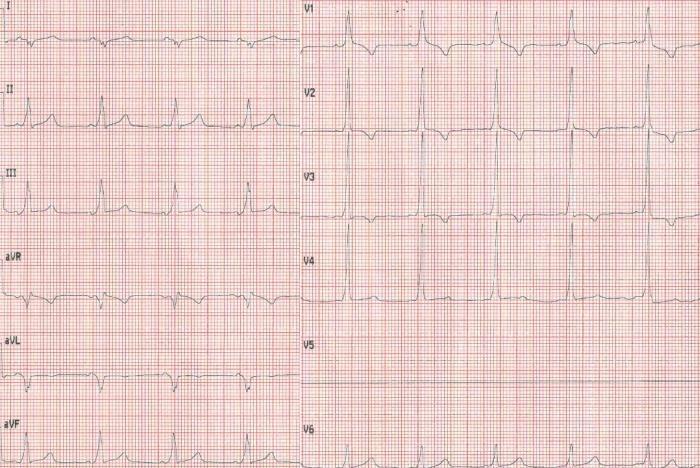
- Short PR interval (<120 ms) — impulse bypasses AV node delay
- Delta wave — slurred, slow upstroke at onset of QRS; best seen where positive
- Widened QRS (>110 ms) — due to fusion of pre-excited and normal conduction
- Secondary ST-T changes — opposite to delta/QRS vector (not ischaemic)
- Pseudo-Q waves in inferior leads (mimics inferior MI) when posterior accessory pathway
With AF, the accessory pathway can conduct rapidly → rapid, wide-complex pre-excited AF ("pre-excited AF") that mimics VT and is life-threatening if treated with AV nodal blockers.
6. Ventricular Tachycardia (VT)
ECG Hallmarks
VT originates below the bundle of His; it is potentially life-threatening and must be distinguished from SVT with aberrancy (Goldman-Cecil Medicine):
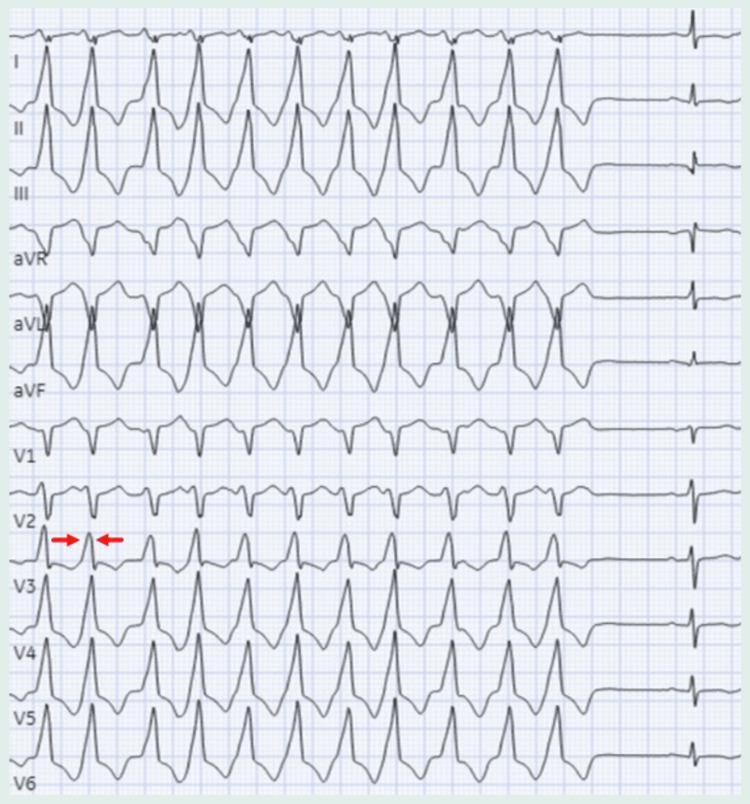
- Wide QRS tachycardia (QRS >120 ms) at rate typically 100–250 bpm
- AV dissociation — P waves march through at their own (slower) rate; pathognomonic of VT
- Fusion beats — P wave conducts simultaneously with ventricular beat; QRS is a hybrid
- Capture beats — rare sinus impulse conducts fully; produces a narrow QRS amid wide complexes
- Concordance — all precordial QRS complexes pointing in same direction (all positive or all negative)
- Monomorphic vs polymorphic (varying QRS axis/morphology)
7. Acute Pericarditis
ECG Hallmarks
Pericardial inflammation produces characteristic four-stage ECG evolution:
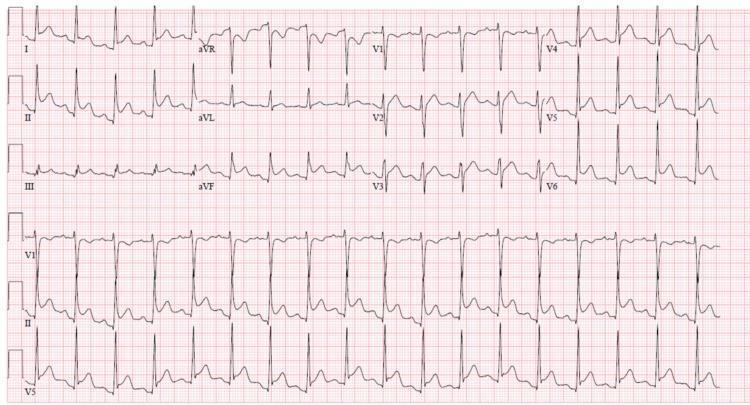
- Stage I (acute): Diffuse concave ("saddle-shaped") ST elevation in almost all leads (I, II, III, aVF, V2–V6); PR segment depression (most specific sign, due to atrial epicarditis); PR elevation in aVR (reciprocal)
- Spodick's sign — downsloping TP segment
- NO reciprocal ST depression (except in aVR/V1) — this distinguishes from STEMI, which has reciprocal changes in anatomically opposite leads
- Stage II: ST normalises; T waves flatten
- Stage III: T-wave inversion
- Stage IV: ECG normalises
8. Pulmonary Embolism (PE)
ECG Hallmarks
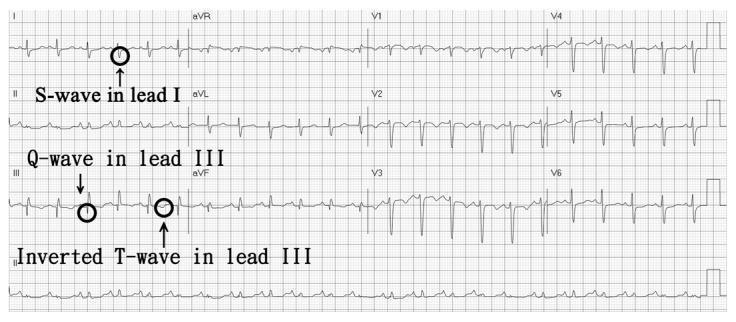
Massive PE causes acute right ventricular pressure overload; ECG changes reflect right heart strain (the S1Q3T3 pattern, or McGinn-White sign):
- Sinus tachycardia — most common finding
- S1Q3T3 pattern — deep S wave in lead I; Q wave in lead III; inverted T wave in lead III
- Right axis deviation (QRS axis >90°)
- Incomplete or complete RBBB — QRS >120 ms in V1 with rSR' (rabbit-ear) morphology
- T-wave inversions in V1–V4 — right ventricular strain pattern
- P pulmonale — peaked P wave in lead II >2.5 mm (right atrial enlargement)
- Electrical alternans — if large pericardial effusion is also present
ECG changes can be transient and are found in only ~50% of confirmed PE cases.
9. Hypertrophic Cardiomyopathy (HCM)
ECG Hallmarks
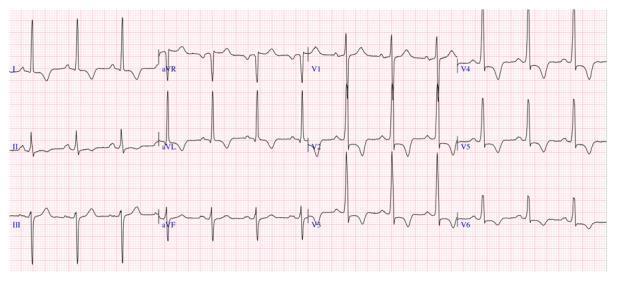
HCM (usually due to sarcomere gene mutations) produces abnormal LV mass with myofibre disarray. The ECG is abnormal in ~90% of cases (Goldman-Cecil Medicine):
- Left ventricular hypertrophy (LVH) — high QRS voltage; Sokolow-Lyon criteria: S in V1 + R in V5 >35 mm
- Deep, symmetric T-wave inversions in precordial and lateral leads — characteristic "strain pattern"
- Pathological Q waves in inferolateral leads (I, aVL, V4–V6) — due to septal hypertrophy (not infarction); can mimic old MI
- Apical HCM (Yamaguchi syndrome): "Giant" T-wave inversions (>10 mm) in V3–V5 are diagnostic
- Left axis deviation
- AF — occurs in up to 25% over time
10. Long QT Syndrome (LQTS) & Risk of Torsades de Pointes
ECG Hallmarks
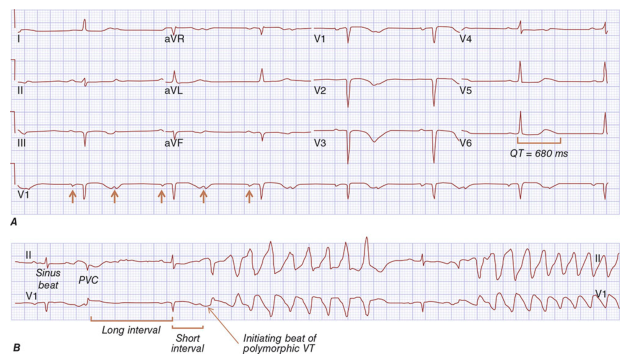
LQTS is characterised by delayed ventricular repolarisation; it may be congenital (channelopathy: KCNQ1, KCNH2, SCN5A) or acquired (drugs, electrolytes) (Harrison's Principles of Internal Medicine):
- Prolonged QTc interval:
- Males: >440 ms
- Females: >460 ms
- High risk: >500 ms
- QTc calculated by Bazett's formula: QTc = QT / √RR
- Broad, notched, or "humped" T waves — in LQT2; biphasic T waves in some subtypes
- Prominent U waves — large positive deflection after T wave; especially in LQT1/LQT2
- T-wave alternans (beat-to-beat variation in T-wave morphology) — precursor to TdP
Torsades de Pointes (TdP) — the signature dangerous arrhythmia:
- Polymorphic VT with QRS complexes that twist around the isoelectric baseline ("twisting of the points")
- Often initiated by "short-long-short" RR sequence (PVC on preceding T wave: "R-on-T")
- Self-terminating but can degenerate to VF
Quick Reference Summary Table
| # | Condition | Key ECG Findings |
|---|---|---|
| 1 | STEMI | Convex ST elevation ± reciprocal depression; Q waves; hyperacute T |
| 2 | Atrial Fibrillation | Absent P waves; irregularly irregular RR; narrow QRS |
| 3 | AV Heart Block | PR prolongation; dropped beats; AV dissociation (complete) |
| 4 | LBBB | QRS >120 ms; broad R in I/V5–V6; QS in V1–V3; discordant ST-T |
| 5 | WPW | Short PR; delta wave; wide QRS; secondary ST-T changes |
| 6 | Ventricular Tachycardia | Wide QRS tachycardia; AV dissociation; fusion/capture beats |
| 7 | Acute Pericarditis | Diffuse saddle-shaped ST elevation; PR depression; no reciprocal ST ↓ |
| 8 | Pulmonary Embolism | Sinus tachycardia; S1Q3T3; RBBB; T inversions V1–V4 |
| 9 | HCM | LVH voltage; deep T inversions; septal Q waves; strain |
| 10 | Long QT Syndrome | QTc >440–500 ms; broad/notched T; U waves → torsades de pointes |
Sources: Ganong's Review of Medical Physiology (26th ed.) • Guyton & Hall Textbook of Medical Physiology (14th ed.) • Harrison's Principles of Internal Medicine (22nd ed., 2025) • Washington Manual of Medical Therapeutics • Goldman-Cecil Medicine (International ed.) • Tintinalli's Emergency MedicineThis guide covers the 10 most clinically important heart diseases with their characteristic ECG patterns, backed by authoritative textbooks and illustrated with real ECG tracings from the medical literature. Here are a few key teaching points worth remembering:
Critical differentiators:
- STEMI vs Pericarditis: Pericarditis has diffuse saddle-shaped ST elevation with PR depression but no reciprocal ST depression (except aVR/V1). STEMI has focal convex ST elevation with reciprocal depression.
- VT vs SVT with aberrancy: Favour VT if QRS >160 ms, northwest axis, AV dissociation, or fusion/capture beats are present. When in doubt, always treat as VT.
- WPW + AF: Never give AV nodal blockers (adenosine, verapamil, digoxin) — they can accelerate accessory pathway conduction, leading to VF.
- New LBBB: Always consider acute MI (Sgarbossa criteria); new LBBB in the right clinical context should be treated as STEMI equivalent.
- QTc >500 ms: Substantially increases risk of torsades de pointes; review and remove offending drugs, correct electrolytes (K⁺, Mg²⁺).
This is a shared conversation. Sign in to Orris to start your own chat.