
i have started to read the book Kanski from chapter 1 examination technique: pshychophysical test: visual acuity
Kanski Ch. 1 - Psychophysical Tests: Visual Acuity
1. Snellen Visual Acuity
- Uses black optotypes (letters/symbols) on a white chart, read from a standard distance
- Always test with the patient's own glasses or contact lenses first (corrected VA)
- Test the worse eye first, with the other eye occluded
- Push the patient to read every possible letter
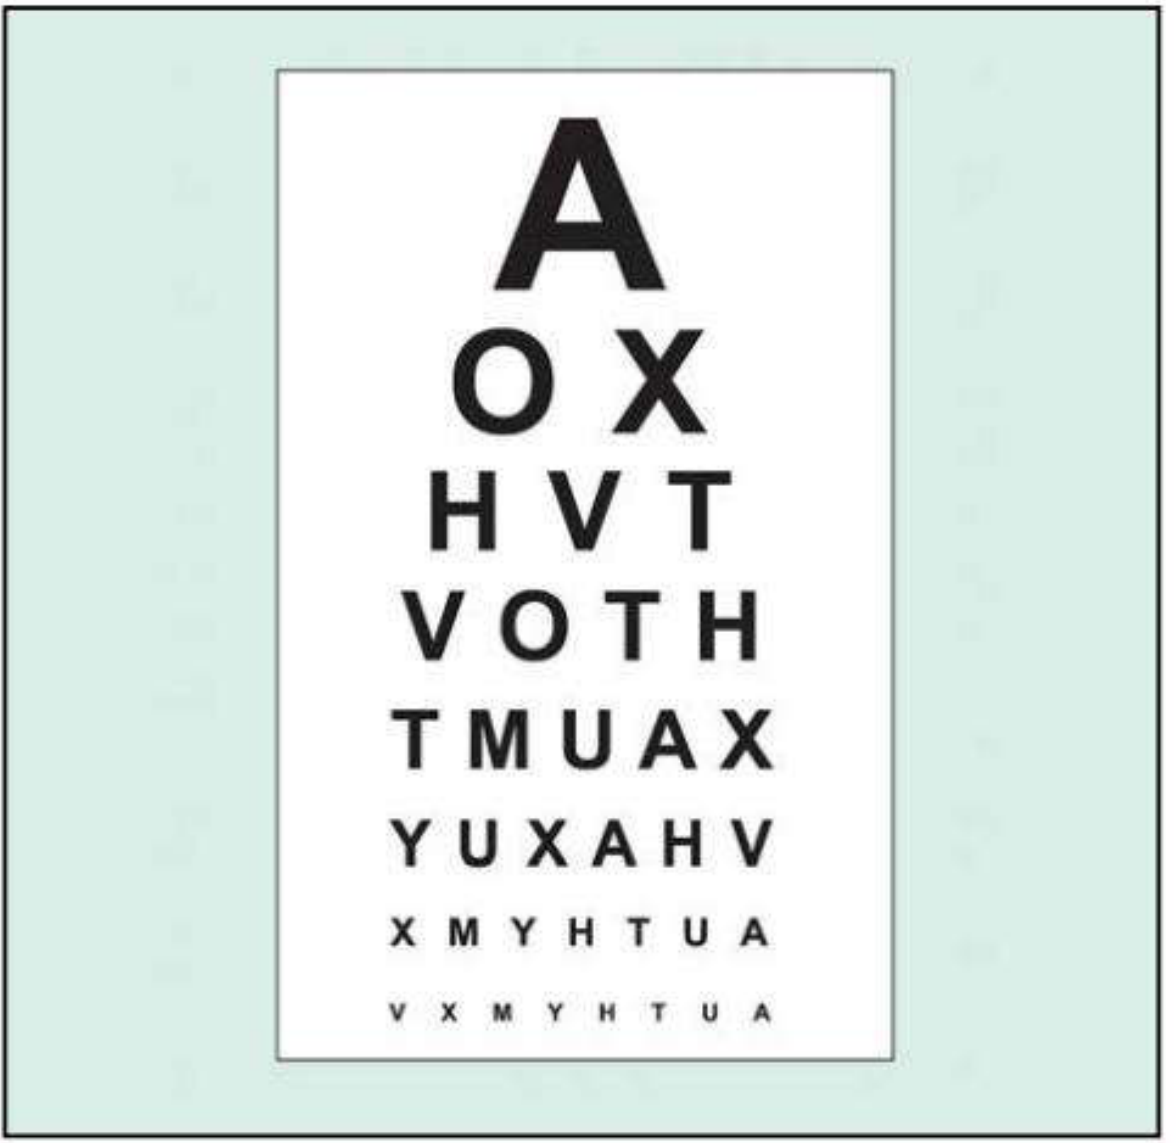
- Normal monocular VA = 6/6 (metric) = 20/20 (feet/non-metric)
- Normal corrected VA in young adults is often better than 6/6
- BCVA (Best-Corrected Visual Acuity) = VA with optimal refractive correction
- Binocular VA is usually superior to the better monocular VA
2. Pinhole VA
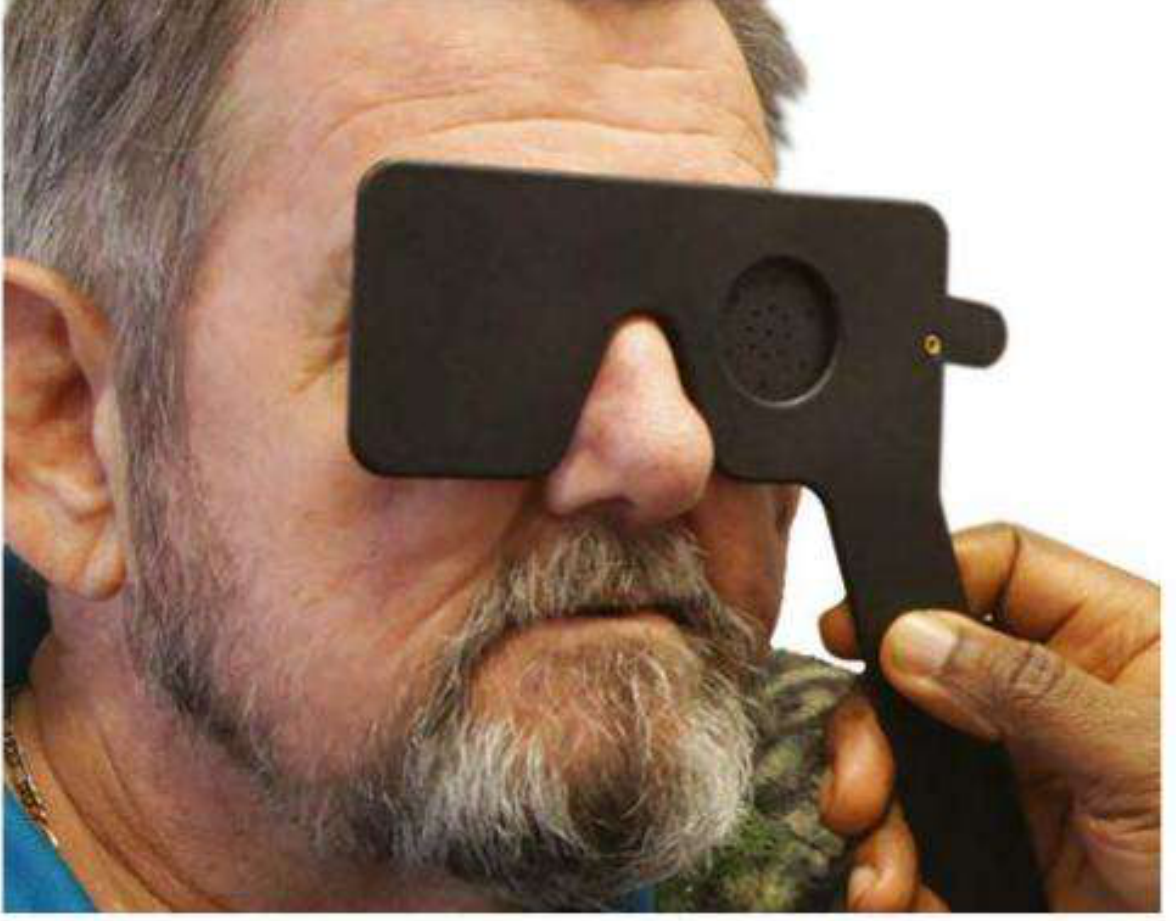
- Used whenever VA is less than 6/6
- Important caveat: In macular disease and posterior lens opacities, pinhole acuity may actually be worse than with spectacle correction (not better)
3. Very Poor Visual Acuity
| Grade | Definition |
|---|---|
| CF (Counting Fingers) | Patient can count fingers held up, stated at a given distance (usually 1 m) |
| HM (Hand Movements) | Patient can only detect whether the hand is moving |
| PL (Perception of Light) | Patient can discern only the presence of a light source |
| NPL (No Perception of Light) | Complete blindness |
- For PL: if the reduced vision is due solely to a dense media opacity (e.g. cataract), the patient should still be able to identify the direction from which light is projected (projection of light test)
- Careful occlusion of the other eye is essential when testing PL
4. LogMAR Acuity
| Snellen | LogMAR |
|---|---|
| Variable letter readability | Similar readability between letters |
| Unbalanced "crowding" (more letters on lower lines) | Equal number of letters per line (5 letters/row) - controls crowding |
| 6 m testing lane (needs mirror) | 4 m testing distance - smaller lane needed |
| Less accurate for research | Higher accuracy and consistency - standard for research |
| Simple scoring | Each letter = 0.02 units; test until >50% of a line is missed |
- 6/6 = logMAR 0.00
- 6/12 = logMAR 0.30
- 6/60 = logMAR 1.00
- Values better than 6/6 are negative
LogMAR Chart Types:
- Bailey-Lovie chart - 6 m testing distance; rectangular letter signs; 5 letters/line with spacing proportional to letter size
- ETDRS chart (Early Treatment Diabetic Retinopathy Study) - the research gold standard; 4 m testing distance; similar to Bailey-Lovie but uses square letter format
5. Near Visual Acuity
- Tested with a near VA chart (e.g. Jaeger notation or N-notation)
- Patient reads at a comfortable distance (~33 cm) with their reading correction if needed
- Also recorded as N-type (N5 = normal fine print) or Jaeger (J1 = finest)
Bonus: Amsler Grid (Related Psychophysical Test)
- 7 charts total: Chart 1 is the standard (white lines on black background)
- Charts 2-7 test specific functions (tangent lines, colour, dotted, horizontal lines for metamorphopsia)
- Technique: no pupil dilation, read at 33 cm, one eye covered, patient looks at central dot and reports any waviness or blank areas
- Macular disease → wavy/distorted lines (metamorphopsia)
- Optic neuropathy → missing/faint lines (scotoma), not distortion
- Missing corner or border → consider glaucomatous field defects or retinitis pigmentosa
C - H - P - NP Counting Fingers → Hand Movements → Perception of Light → No Perception of Light
in more detail from basic to advanced level
Visual Acuity - Complete Guide (Basic to Advanced)
Kanski's Clinical Ophthalmology: A Systematic Approach, 10th Ed.
PART 1 - THE ABSOLUTE BASICS: What IS Visual Acuity?
The concept of the "minimum angle of resolution (MAR)"
- Normal eye: MAR = 1 minute of arc (1')
- The smaller the MAR, the better the visual acuity
PART 2 - SNELLEN VISUAL ACUITY (The Bedside Standard)
What is a Snellen chart?
How to read Snellen notation: 6/X or 20/X
| Notation | Meaning |
|---|---|
| 6/6 (metric) = 20/20 (feet) | Normal VA. The patient reads at 6 m what a normal eye reads at 6 m |
| 6/12 | Patient reads at 6 m what a normal eye reads at 12 m (worse than normal) |
| 6/60 | Patient reads at 6 m what a normal eye reads at 60 m (very poor VA) |
| 6/4 | Better than normal (reads at 6 m what most people need 4 m to see) |
Key point: Normal corrected VA in young adults is often better than 6/6 (e.g. 6/5 or 6/4).
Standard testing technique (step by step)
- Use the patient's own glasses or contact lenses for the first measurement (corrected VA)
- Test the worse eye first, with the other eye fully occluded (not squinted)
- Push the patient to read every last letter they can - do not accept "I can't read any more" too easily
- Also record unaided (uncorrected) VA for completeness
- Binocular VA (both eyes open) is usually better than the better monocular VA and should also be recorded
Key VA terms you must know
| Term | Definition |
|---|---|
| Corrected VA | VA measured with the patient's own glasses/contacts |
| Unaided VA | VA without any correction |
| BCVA (Best-Corrected Visual Acuity) | VA achieved with the optimal refractive correction (not just the patient's current glasses) |
| Binocular VA | VA with both eyes open (usually superior to monocular) |
PART 3 - PINHOLE VISUAL ACUITY
What does a pinhole do?
Clinical rule:
If VA < 6/6, always repeat with the pinhole.
Why pinhole is useful - and when it misleads
| Scenario | Pinhole VA result | Interpretation |
|---|---|---|
| Refractive error (myopia, hypermetropia, astigmatism) | Improves significantly | Vision loss is correctable with glasses |
| Media opacity (mild cataract, corneal scar) | May improve slightly | Blurred image bypassed to some degree |
| Macular disease | May be WORSE than with spectacles | Maculopathy interferes with central resolution - the pinhole restricts the already-poor image |
| Posterior lens opacity | May also be worse | Dense lens scatter worsens with reduced aperture |
| Optic neuropathy | Minimal improvement | Neural deficit, not optical |
Critical exam point: Pinhole VA can be WORSE than corrected VA in macular disease and posterior lens opacities.
PART 4 - VERY POOR VISUAL ACUITY (Qualitative Grading)
CF - Counting Fingers
- Written as: CF 1m or CF at 1 metre
HM - Hand Movements
PL - Perception of Light
- Careful occlusion of the other eye is essential - ambient light from the room can give a false positive
- If poor vision is due to a dense media opacity (e.g. mature cataract), the patient should still be able to correctly identify which quadrant the light is coming from - this is the projection of light test
Projection of Light Test
- Test all 4 quadrants: superior, inferior, nasal, temporal
- If the patient has accurate projection in all directions with only a cataract = good prognosis post-surgery (retina is functioning)
- If projection is absent in one or more quadrants = retinal or optic nerve pathology may exist behind the cataract
NPL - No Perception of Light
6/6 → 6/60 → CF → HM → PL → NPL
PART 5 - LogMAR ACUITY (The Research Standard)
Why do we need a better system than Snellen?
- Different numbers of letters on different lines (unequal crowding effect)
- Letters on different lines vary in readability
- The spacing between letters and lines is not standardized
- Scoring is all-or-nothing per line (if you miss one letter on a line, you score the whole line differently)
The LogMAR concept
- 6/6 = logMAR 0.00 (normal)
- 6/12 = logMAR 0.30 (MAR = 2', log₁₀(2) = 0.30)
- 6/60 = logMAR 1.00 (MAR = 10', log₁₀(10) = 1.00)
- Better than 6/6 = negative values (e.g. 6/4 ≈ logMAR -0.18)
How logMAR scoring works
- Each correctly read letter = 0.02 logMAR units
- Score every single letter, not just the line
- Continue testing until the patient misses >50% of letters on a line
Snellen vs LogMAR: head-to-head comparison
| Feature | Snellen | LogMAR |
|---|---|---|
| Test time | Shorter | Longer |
| Crowding effect | Unbalanced (more letters on lower lines) | Balanced (5 letters on every line) |
| Letter readability | Variable between letters | Standardized across all letters |
| Line consistency | Lines not balanced for readability | Lines balanced for readability |
| Testing distance | 6 m (needs long lane or mirror) | 4 m (smaller room works) |
| Letter/row spacing | Not systematic | Set to optimize contour interaction |
| Research suitability | Low - unsuitable | High - gold standard |
| Ease of use | Easy, quick | Less user-friendly |
| Scoring | Simple, line-based | Complex but precise (per letter) |
LogMAR charts used in practice
Bailey-Lovie Chart
- Testing distance: 6 m
- 5 letters per row
- Spacing between letters and rows proportional to letter size
- Letter signs are rectangular (5' height × 4' width for the 6/6 letter)
ETDRS Chart (Early Treatment Diabetic Retinopathy Study)
- Testing distance: 4 m (standard) or 1 m (for very low VA)
- The gold standard for clinical research
- Letters are square (5' × 5' for the 6/6 equivalent at 6 m)
- Balanced use of letters with similar legibility
Kanski's clinical tip: LogMAR charts are the preferred method in clinical trials because they give the most accurate and reproducible VA measurements.
LogMAR - Snellen - Feet conversion table (key values)
| Snellen (metres) | Snellen (feet) | LogMAR |
|---|---|---|
| 6/4 | 20/13 | -0.18 |
| 6/5 | 20/16 | -0.10 |
| 6/6 | 20/20 | 0.00 |
| 6/9 | 20/30 | 0.18 |
| 6/12 | 20/40 | 0.30 |
| 6/18 | 20/60 | 0.48 |
| 6/24 | 20/80 | 0.60 |
| 6/36 | 20/120 | 0.78 |
| 6/60 | 20/200 | 1.00 |
PART 6 - NEAR VISUAL ACUITY
Technique
- Use a near VA chart (logMAR, ETDRS, Jaeger, or N-notation versions all exist)
- Held at a comfortable reading distance, which must be measured and documented (usually ~33 cm)
- Patient wears their distance correction + a presbyopic addition if applicable (usually their own reading glasses)
- Test each eye individually, then both eyes together
- Record the smallest type legible (e.g. N6, J2, or logMAR equivalent)
Near VA notation systems
| System | "Normal" reading | What it measures |
|---|---|---|
| N-notation | N6 = normal newspaper print | Point size |
| Jaeger | J1 = very fine print | Relative size scale |
| LogMAR near | 0.00 = normal | Log of MAR at near |
PART 7 - CONTRAST SENSITIVITY (Beyond Standard VA)
Why it matters
- Amblyopia
- Optic neuropathy (early)
- Certain cataracts
- Higher-order optical aberrations
Tests for contrast sensitivity
- Viewed at 1 metre
- All letters are the same size (spatial frequency ~1 cycle/degree)
- Letters are grouped in threes, each group decreasing in contrast by 0.15 log units
- Patient reads down until they can no longer resolve the letters
- Simple, practical, widely used
- Patient views gratings of varying spatial frequency and decreasing contrast
- Generates a full contrast sensitivity function (CSF) curve
- More detailed but complex, used mainly in research
- Performed on a computer with internet access
- Patient assigned an ID number and self-administers the test
- Takes 5-10 minutes per eye
- Tests contrast at different eccentricities (peripheral as well as central)
PART 8 - RELATED TESTS THAT SUPPLEMENT VA TESTING
Amsler Grid - Macular function at near
- 7 standard charts exist (Chart 1 is the default; Charts 2-7 test specific features)
- Chart 1: white lines on black background, central dot fixation
- Chart 5: horizontal lines to detect metamorphopsia along specific meridians
- Chart 7: fine central grid (half-degree squares) - most sensitive
- No pupil dilation beforehand (and avoid slit-lamp exam first - photo-stress effect)
- Hold chart at 33 cm with reading correction
- Cover one eye
- Patient fixates on the central dot at all times
- Ask: "Are any lines wavy or distorted?" (metamorphopsia = macular disease)
- Ask: "Are any areas missing, blank, or faint?" (scotoma)
- Ask: "Can you see all four corners and all four sides?"
| Finding | Likely cause |
|---|---|
| Wavy/distorted lines | Macular disease (e.g. CNVM, CSR, macular oedema) |
| Missing/faint lines (no distortion) | Optic neuropathy |
| Missing corner or border | Glaucomatous field defect or retinitis pigmentosa |
Photostress Test - Distinguishes macular disease from optic neuropathy
- Record BCVA first
- Patient fixates on a pen torch or indirect ophthalmoscope held ~3 cm away for 10 seconds
- Start the stopwatch
- Photostress Recovery Time (PSRT) = time to read any 3 letters of the pre-test VA line
- Normal PSRT: 15-30 seconds
- Repeat on the normal eye for comparison
| Result | Meaning |
|---|---|
| PSRT prolonged (sometimes >50 sec) | Macular disease |
| PSRT normal despite poor VA | Optic neuropathy (photoreceptors are fine; the problem is upstream) |
Light Brightness Comparison Test - Optic nerve asymmetry
- Shine an indirect ophthalmoscope light into one eye, then the other
- Ask: "Is the light equally bright in both eyes?"
- Ask the patient to assign a number 1-5 to the brightness in the suspect eye (with the normal eye = 5)
- If the patient reports the light is dimmer in one eye = optic neuropathy in that eye
- Usually normal in early/moderate retinal disease
MASTER SUMMARY - Visual Acuity from Basic to Advanced
LEVEL 1 - BASIC:        What is VA? → MAR concept → Snellen notation (6/6)
LEVEL 2 - CLINICAL:     Snellen technique → Pinhole → BCVA → Near VA
LEVEL 3 - GRADING:      CF → HM → PL (± projection) → NPL
LEVEL 4 - ADVANCED:     LogMAR (Bailey-Lovie, ETDRS) → per-letter scoring
LEVEL 5 - EXPERT:       Contrast sensitivity → Amsler → Photostress → Light brightness
- Pinhole VA worse than corrected VA = think macular disease or posterior lens opacity
- LogMAR 0.00 = 6/6; each letter = 0.02 logMAR units
- PSRT >50 sec = macular disease; normal PSRT with poor VA = optic neuropathy
- Amsler: wavy lines = macula; missing lines = optic nerve; missing corners = glaucoma/RP
- Near VA testing is more sensitive than distance VA for early macular disease
visual acuity testing techniques for different patient populations
Visual Acuity Testing Techniques for Different Patient Populations
Kanski's Clinical Ophthalmology, 10th Ed. - Ch. 1 & Ch. 18
OVERVIEW: Why One Test Does Not Fit All
- Read letters of the English/Roman alphabet
- Understand the task verbally
- Cooperate and sit still
- Communicate their response verbally
POPULATION 1: PREVERBAL INFANTS AND YOUNG CHILDREN
A) QUALITATIVE ASSESSMENT - Visual Behaviour
1. Fixation and Following
- Use a bright, attention-grabbing target - a face is usually best
- Check: does the infant fixate? Can they follow a moving target?
- Gives a gross indication of whether the infant is visually alert
- Most useful when you suspect complete or near-complete blindness
2. Monocular Occlusion Test
- Occlude one eye and observe the child's reaction
- Strong objection to occluding one eye = that eye is the dominant/better eye, suggesting the other (unoccluded) eye has poor VA
- Caveat: a child can have good visual attention in each eye separately but still have unequal VA - always consider amblyopia risk factors
3. Fixation Behaviour Assessment (in the presence of a squint)
- Occlude the dominant eye to force fixation with the squinting eye
- Observe the corneal light reflex - grade fixation as:
- Central or non-central
- Steady or unsteady
- Uncover the dominant eye and observe:
- Fixation immediately reverts to the uncovered eye → VA probably impaired in squinting eye
- Fixation maintained through a blink → VA probably good in squinting eye
- Child alternates fixation → two eyes probably have equal vision
4. The 10Δ Prism Test
- Can be used regardless of whether a manifest squint is present
- A 10 prism dioptre vertical prism is placed before one eye, inducing diplopia
- Alternation between the two diplopic images = equal VA in both eyes
- Unilateral suppression of one image = that eye has poorer VA
5. Rotation Test (Gross Test - for suspected blindness)
- Examiner holds the infant facing them and rotates briskly through 360°
- Normal response:
- Eyes deviate in the direction of rotation (vestibulo-ocular response)
- Eyes flick back (rotational nystagmus develops)
- On stopping rotation, brief nystagmus in the opposite direction for 1-2 seconds, which then stops (suppressed by fixation)
- Severely visually impaired:
- Post-rotatory nystagmus does not stop promptly after rotation ceases, because the vestibulo-ocular response is not blocked by visual feedback (there is no visual input to suppress it)
B) QUANTITATIVE ASSESSMENT - Preferential Looking Tests
Teller Acuity Cards / Keeler Acuity Cards
- Cards with black-and-white gratings (stripes) of varying widths on one side, plain grey on the other
- The infant is presented with the card; the examiner watches the eyes without knowing which side has the grating
- The finest grating that the infant consistently fixates = their resolution VA
- Distance: typically 55 cm or 38 cm
- Important limitation: Teller cards measure grating (resolution) acuity, not recognition acuity. Grating acuity often exceeds Snellen acuity in amblyopia, so Teller cards can overestimate VA in amblyopic eyes - this is a clinically critical caveat
- Must use a proper forced-choice staircase protocol for reliable results
Cardiff Acuity Cards
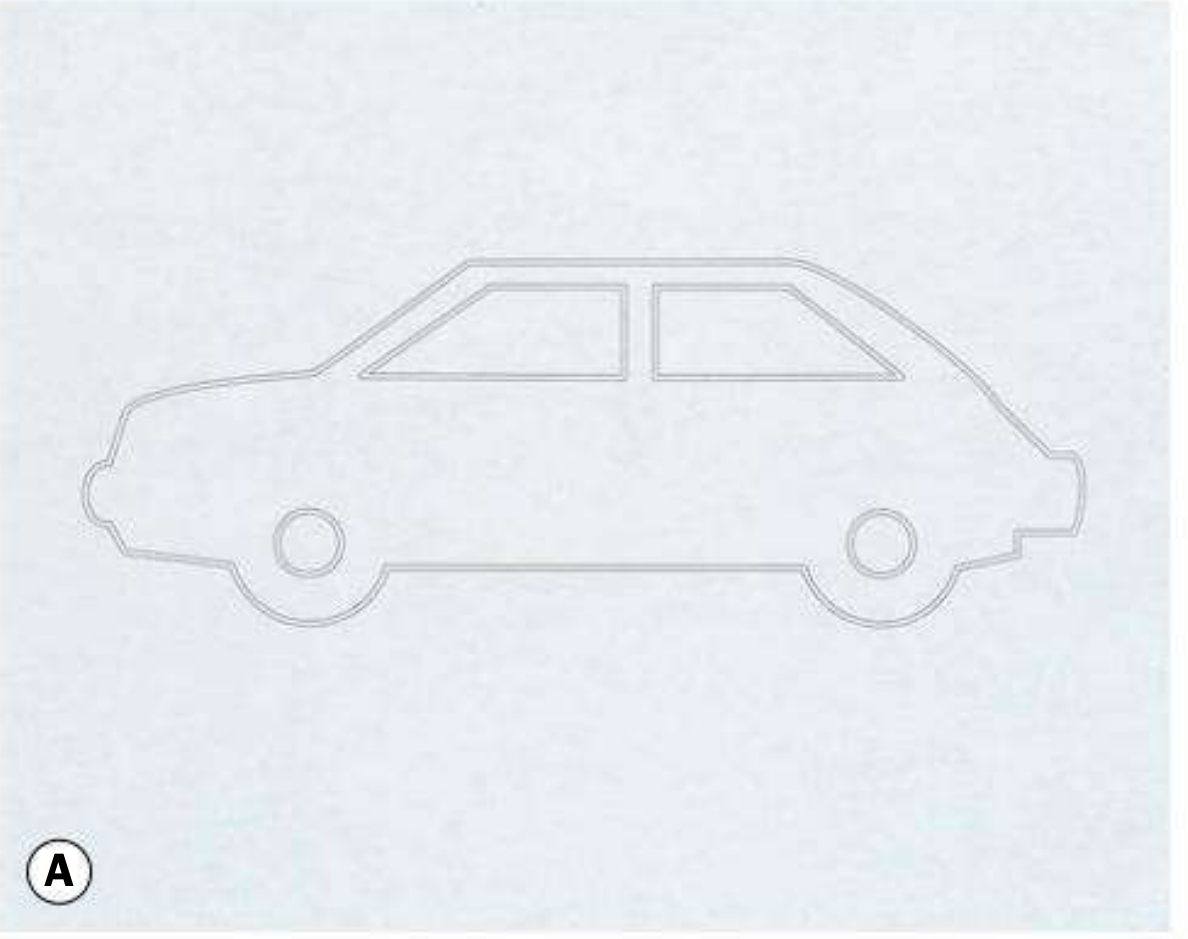
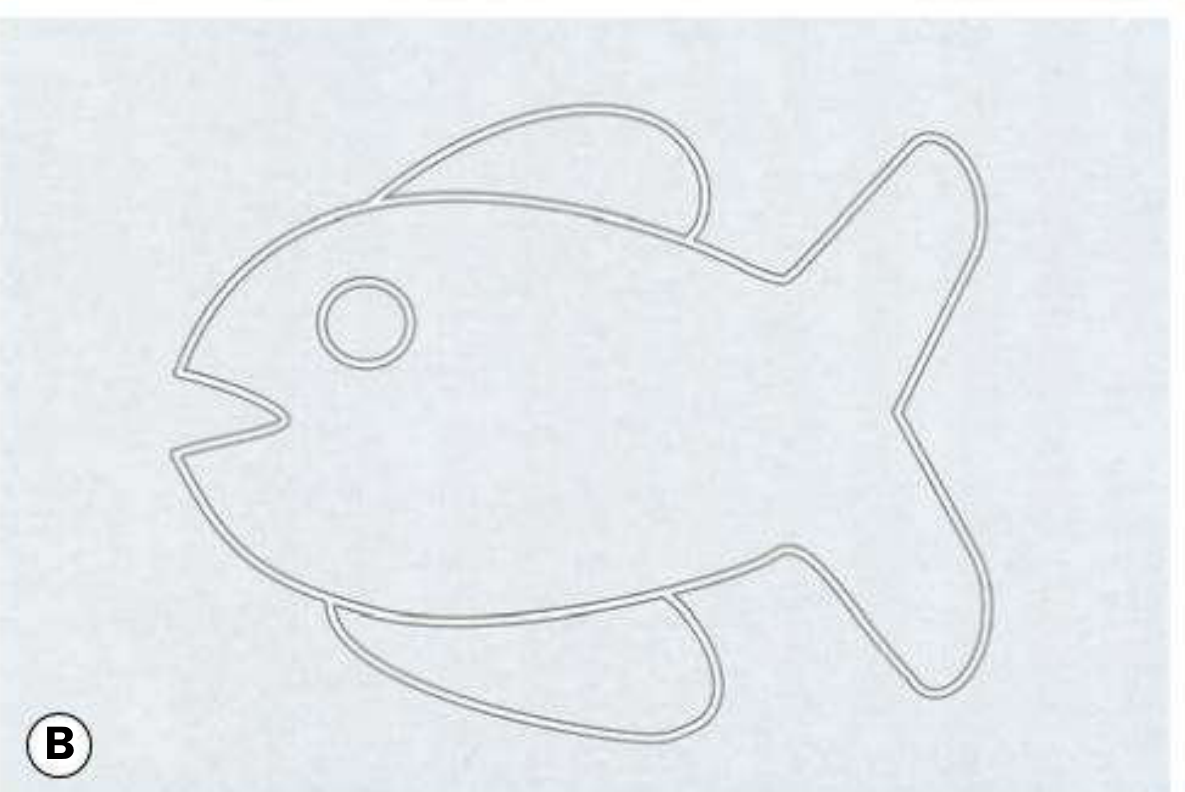
- Uses familiar picture outlines (car, fish, house, duck) instead of gratings
- Pictures vary in their outline width (thick outline = easier to see, like a coarse grating)
- Viewed at 100 cm
- More ecologically valid than gratings as it involves recognizing a shape
Pattern Visual Evoked Potentials (VEP)
- Records the visual cortex's electrical response to pattern stimuli (checkerboard or gratings)
- Gives an objective representation of spatial acuity - requires no behavioural response
- Useful when preferential looking results are equivocal or unreliable
- More commonly used to diagnose optic neuropathy rather than routine VA screening
POPULATION 2: VERBAL TODDLERS (approximately 2 years)
Crowded Kay Pictures Test
- Pictures of common objects presented in a "crowded" format (surrounded by other pictures - simulating the crowding/contour interaction seen in amblyopia)
- Child names or points to the picture matching a hand-held card
- Testing distance: 3-4 metres (easier compliance than 6 metres, with minimal clinical detriment)
- Why "crowded"? Amblyopia selectively impairs vision when targets are surrounded by nearby contours. A single isolated letter/picture can give falsely good VA in amblyopia. Crowded tests are mandatory for accurate amblyopia detection.
Kanski rule: Amblyopia can only be accurately diagnosed using a crowded test requiring target recognition. If crowded letters are too difficult, use crowded pictures - do NOT fall back to single optotype letters.
POPULATION 3: PRESCHOOL CHILDREN (approximately 3-4 years)
Keeler LogMAR Crowded Test
- logMAR-based crowded letter matching test
- Can be used from ~3 years
- Preferred over Snellen for all children at risk of amblyopia
Sonksen Crowded Letters Test / Otago Crowded Test
- Similar principle - crowded letter matching
- Testing at 3-4 metres for compliance
Sheridan-Gardiner / STYCAR Letters
- Single letters presented on a card matched against a hand-held key card
- Simple matching, no reading required
- However - single optotype testing is inadequate for amblyopia because the crowding effect is absent
For all children at risk of amblyopia, use logMAR crowded tests over Snellen.
POPULATION 4: SCHOOL-AGE CHILDREN (5 years+)
- Standard Snellen chart (acceptable for general screening)
- Crowded logMAR charts (preferred for amblyopia monitoring and research)
- Testing distance: 3-4 m (for compliance) or 6 m
- Push them to name every letter - children often stop early
POPULATION 5: ILLITERATE ADULTS AND NON-ENGLISH SPEAKERS
Tumbling E Chart (Illiterate E Chart)
- A single letter "E" presented in 4 orientations (up, down, left, right) at various sizes
- Patient points in the direction the "prongs" of the E are pointing, or uses a hand to indicate direction
- No literacy required - universal language
- Available in Snellen and logMAR formats
Landolt C (Broken Ring) Chart
- A ring with a gap that appears at different positions (up, down, left, right, diagonal)
- Patient indicates where the gap is
- Considered the international gold standard optotype for research because letter recognition biases are eliminated entirely
- Tests pure resolution, not recognition
Picture Charts (Lea Symbols, Kay Pictures)
- Used for children but equally valid for adults who cannot read
- Patient names or matches simple shapes (house, circle, square, apple)
POPULATION 6: PATIENTS WITH VERY LOW VISION
| Grade | Test | Distance |
|---|---|---|
| CF | Counting fingers | Stated (usually 1 m) |
| HM | Hand movements | Just in front of patient |
| PL | Perception of light | Pen torch |
| PL + Projection | Direction of light source | All 4 quadrants tested |
| NPL | No perception of light | Complete blindness |
Special consideration - the projection of light test
- Test all 4 quadrants: superior, inferior, nasal, temporal
- Accurate projection in all quadrants = retina and optic nerve likely intact → good prognosis for visual recovery after cataract surgery
- Absent projection in any quadrant = suggests a posterior segment or optic nerve problem even if the cataract is the apparent cause
POPULATION 7: PATIENTS WITH NYSTAGMUS
- Always test VA in the patient's natural head position first (with their adopted head posture)
- Also test in primary gaze separately
- The two values may differ significantly
- Use a larger testing distance if possible - nystagmus amplitude is often less at distance
- Allow longer response time - the patient uses brief moments of relative stillness to resolve letters
- Avoid patching for monocular testing where possible - patching can worsen nystagmus (latent nystagmus component) and give falsely poor monocular VA
POPULATION 8: ELDERLY PATIENTS AND THOSE WITH COGNITIVE IMPAIRMENT
- Allow more time - processing speed slows with age
- Use larger, high-contrast optotypes
- Consider near VA as a complement - elderly patients often experience near vision symptoms (presbyopia, macular degeneration) before distance VA drops
- For mild dementia: picture charts or matching tests may be more reliable than letter naming
- Check for and correct media opacities (cataract is ubiquitous in the elderly) before drawing conclusions about neural VA loss
- Photostress test is particularly useful in elderly patients when distinguishing early macular degeneration from optic neuropathy
MASTER SUMMARY TABLE
| Population | Test(s) of Choice | Key Consideration |
|---|---|---|
| Preverbal infant | Fixation/following, Teller/Cardiff cards, VEP | Teller overestimates VA in amblyopia |
| Age ~2 years | Crowded Kay pictures | Crowded format mandatory for amblyopia |
| Age ~3 years | Keeler logMAR, Sonksen, Otago crowded | Matching, not naming |
| School-age child | Crowded logMAR (preferred), Snellen | LogMAR for amblyopia monitoring |
| Illiterate adult | Tumbling E, Landolt C, picture charts | No literacy needed |
| Non-English speaker | Tumbling E, Landolt C, numbers | Universal tests |
| Very low vision | CF / HM / PL / Projection / NPL | Projection tests retinal function behind opaque media |
| Nystagmus | Natural head posture first, no patching | Latent nystagmus worsens with occlusion |
| Elderly | Standard Snellen + near VA, photostress | Cataract very common - check media before assuming neural loss |
| Research / clinical trial | ETDRS logMAR | Most accurate, reproducible |
Create a comparison poster: Snellen vs logMAR vs Cardiff vs Teller cards
A clean, professional medical education comparison poster titled "Visual Acuity Testing: A Comparison" with four side-by-side panels comparing Snellen Chart, LogMAR Chart, Cardiff Acuity Cards, and Teller Acuity Cards. Each panel has a distinct color header (deep blue for Snellen, teal for LogMAR, purple for Cardiff, orange for Teller). Each panel contains: a small illustration of the test (Snellen: classic letter chart with decreasing letters A O X H V T; LogMAR: chart with 5 equal letters per row; Cardiff: outline drawing of a fish and car; Teller: black and white striped grating card), followed by key facts in bullet points covering: Type of test, Age group, Testing distance, What it measures, Key advantage, Key limitation. At the bottom a summary row comparing all four on: Literacy needed, Age suitability, Amblyopia detection, Research use. Clean white background, modern sans-serif font, color-coded icons, ophthalmology clinical style.
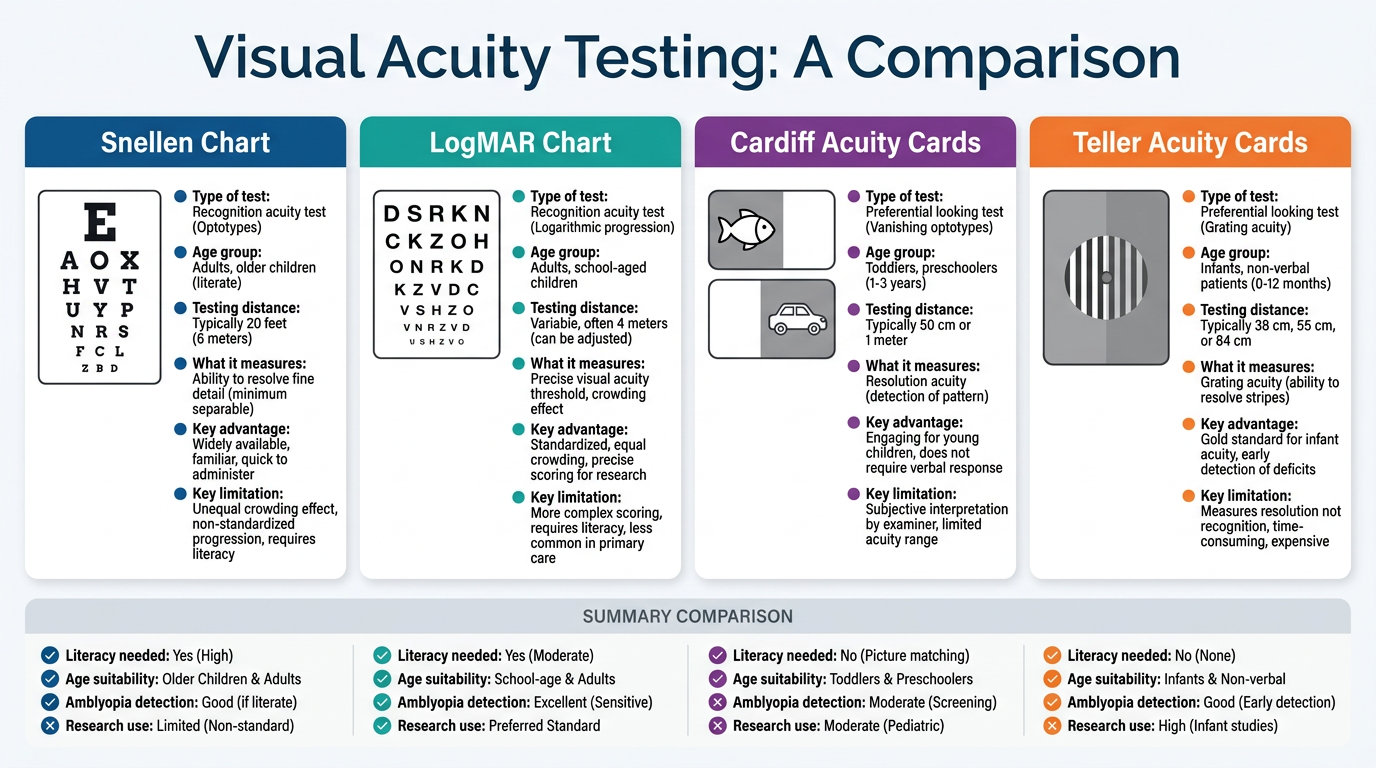
| Feature | Snellen | LogMAR | Cardiff Cards | Teller Cards |
|---|---|---|---|---|
| Type | Letter recognition | Letter recognition | Picture resolution | Grating resolution |
| Age group | 5 years+ | 3 years+ | 6 months - 3 years | Birth onwards |
| Testing distance | 6 m | 4 or 6 m | 100 cm | 38 or 55 cm |
| Measures | Recognition acuity | Recognition acuity | Resolution acuity | Resolution acuity (gratings) |
| Literacy needed? | Yes | Yes | No | No |
| Amblyopia detection | Poor (no crowding) | Good (crowded versions) | Moderate | Poor - overestimates VA |
| Research standard? | No | Yes (ETDRS) | No | Limited |
| Key advantage | Fast, familiar, universal clinic use | Precise per-letter scoring, reproducible | Works pre-verbally, ecologically valid | Objective, usable from birth |
| Key limitation | Unequal crowding, letter variability | Longer, more complex | Tests resolution not recognition | Grating acuity > Snellen acuity in amblyopia = overestimates |
write a note about everything that need to known about psychophysical test from basic to advanced level. what are the questions that can be asked in viva as well
PSYCHOPHYSICAL TESTS - Complete Study Note
Kanski's Clinical Ophthalmology, 10th Ed. - Chapter 1
Basic → Advanced + Full Viva Question Bank
WHAT ARE PSYCHOPHYSICAL TESTS?
- Visual Acuity (Snellen, LogMAR, Near VA, Very Poor VA)
- Contrast Sensitivity
- Amsler Grid
- Light Brightness Comparison Test
- Photostress Test
- Colour Vision Testing
- Plus Lens Test
- Perimetry (Visual Fields)
TEST 1: VISUAL ACUITY
Core Principle
Snellen VA
- Tests at 6 m (or 3 m with mirror)
- Notation: distance tested / distance at which letter subtends 5'
- Normal = 6/6 (metric) = 20/20 (feet)
- Each letter limb subtends 1 minute of arc
- Test worse eye first; with correction; push to last letter
- BCVA = best achievable with optimal refraction
- Pinhole VA = compensates for refractive error (1 mm holes)
- Worse with macular disease and posterior lens opacities
Very Poor VA Grading (best → worst)
- Projection of light test: Tests all 4 quadrants (sup, inf, nasal, temporal)
- Good projection = intact retina/optic nerve behind media opacity
- Failed projection = posterior segment disease
LogMAR VA
- Log of the Minimum Angle of Resolution
- 6/6 = 0.00; 6/12 = 0.30; 6/60 = 1.00; better than 6/6 = negative values
- 5 letters per row; each letter = 0.02 logMAR units
- Row decreases by 0.1 logMAR per line
- Stop when >50% of letters on a line are missed
- ETDRS chart = gold standard for research (4 m, square letters)
- Bailey-Lovie = 6 m, rectangular letters
TEST 2: CONTRAST SENSITIVITY
Basic Concept
Why It Matters Clinically
- Amblyopia
- Early optic neuropathy
- Certain cataracts (especially posterior subcapsular)
- Higher-order aberrations (e.g. post-refractive surgery)
Tests for Contrast Sensitivity
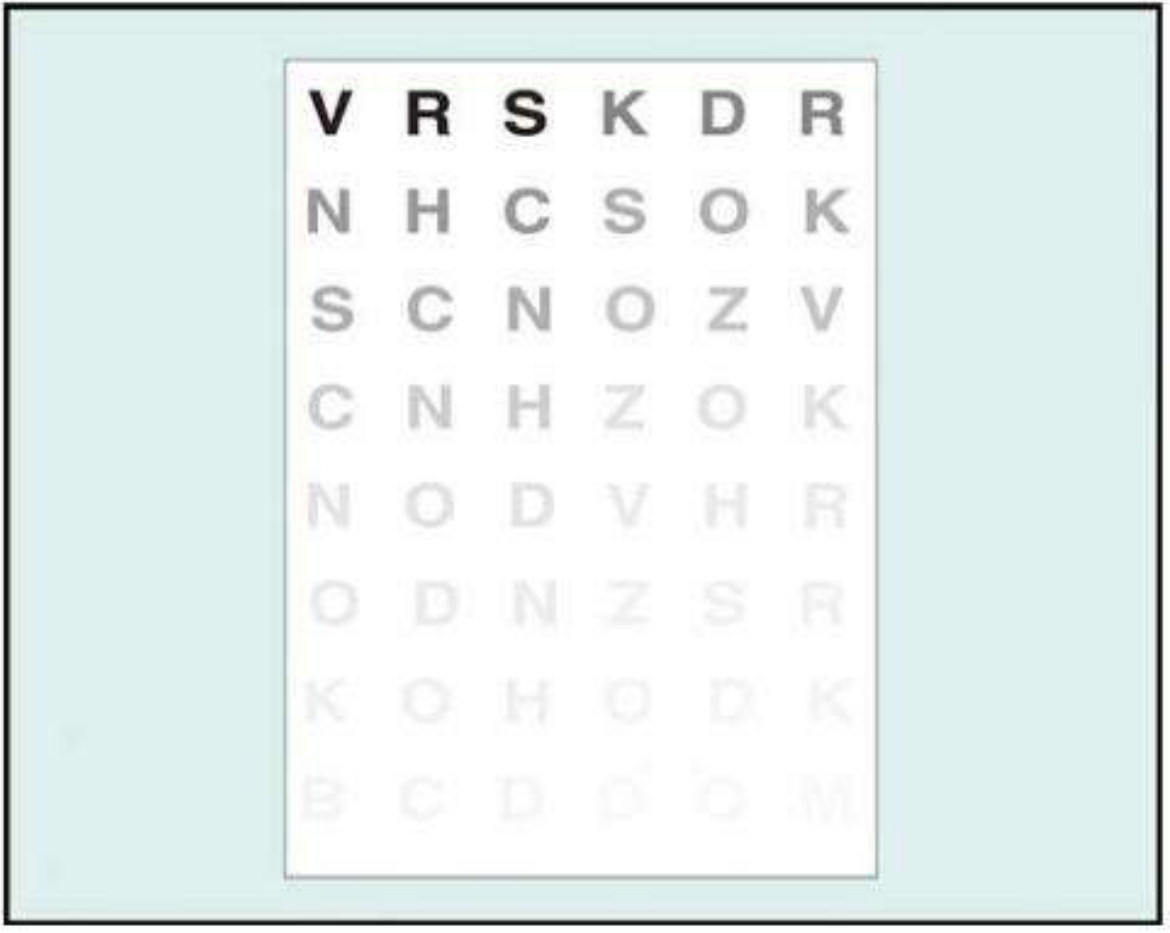
1. Pelli-Robson Chart
- Viewed at 1 metre
- All letters same size (spatial frequency = 1 cycle per degree)
- Letters grouped in threes - each group is 0.15 log units lower in contrast than the previous
- Patient reads until the lowest-contrast triplet they can resolve
- Simple, fast, widely used clinically
2. Sinusoidal (Sine-wave) Grating Charts
- Patient views gratings of varying spatial frequencies at decreasing contrast
- Generates a full Contrast Sensitivity Function (CSF) curve
- More detailed, mainly research use
- Can be used in illiterate patients
3. SPARCS (Spaeth-Richman Contrast Sensitivity Test)
- Computer-based, internet access required
- Patient self-administers with an ID number
- Takes 5-10 minutes per eye
- Tests both central AND peripheral contrast sensitivity
- Based on gratings - usable in illiterate patients
TEST 3: AMSLER GRID
What It Tests
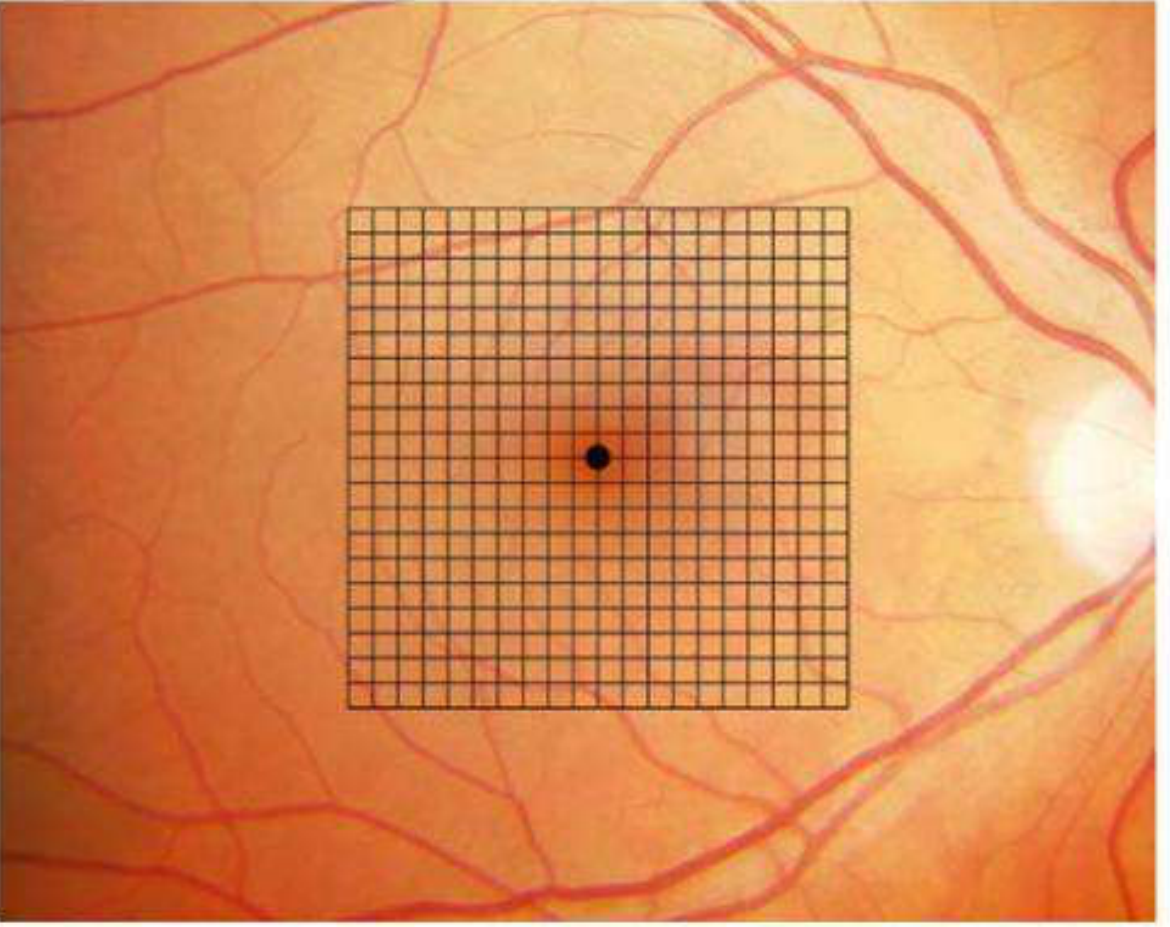
The 7 Charts
| Chart | Description | Use |
|---|---|---|
| 1 | White grid on black background, central dot | Default - standard screening |
| 2 | White grid on black background, no central dot | Detects central scotoma (patient cannot see the dot) |
| 3 | Red lines on black background | Detects subtle central/paracentral scotoma |
| 4 | White dots on black background | Scotoma detection |
| 5 | Horizontal lines only | Detects metamorphopsia along specific meridians; useful for reading difficulty |
| 6 | White background, central lines closer together | Detailed metamorphopsia evaluation |
| 7 | Fine central grid (each square = half a degree) | Most sensitive - fine macular changes |
Testing Technique (step by step)
- Do not dilate pupils beforehand
- Do not perform slit-lamp exam first (photostress effect on macula would give false result)
- Use a reading correction if presbyopic
- Chart held at comfortable reading distance, optimally ~33 cm, well illuminated
- Cover one eye
- Patient fixates on central dot - must maintain this throughout
- Ask: "Do you see any wavy or distorted lines?"
- Ask: "Are there any blurred areas or blank spots?"
- Ask: "Can you see all four corners and all four sides of the square?"
- Patient may draw any anomalies on a recording sheet
Interpretation
| Finding | Likely Diagnosis |
|---|---|
| Wavy/distorted lines (metamorphopsia) | Macular disease (CNVM, CSR, cystoid macular oedema, macular hole) |
| Missing/faint lines (scotoma), no distortion | Optic neuropathy |
| Missing corner or border | Glaucomatous field defect or retinitis pigmentosa |
| Cannot see central dot (Chart 1) | Central scotoma (Chart 2 then used to confirm) |
Clinical tip
TEST 4: LIGHT BRIGHTNESS COMPARISON TEST
Purpose
Technique
- Shine an indirect ophthalmoscope light into the normal eye
- Shine the same light into the suspect eye
- Ask: "Is the light equally bright in both eyes?"
- Ask patient to rate brightness of the suspect eye: assign a number 1-5 (normal eye = 5)
Interpretation
- Light dimmer in one eye = optic neuropathy in that eye (demyelination, compression, ischaemia)
- Normal symmetrical brightness = retinal disease likely (or mild/early optic nerve disease)
Mechanism
TEST 5: PHOTOSTRESS TEST
Principle (the most testable concept in this section)
- Intact photoreceptor function
- Intact retinal pigment epithelium (RPE)
Key Clinical Uses
- Detecting maculopathy when ophthalmoscopy is equivocal (e.g. mild cystoid macular oedema, early central serous retinopathy)
- Differentiating macular disease from optic neuropathy as the cause of visual loss
Technique (step by step)
- Determine and record BCVA first
- Patient fixates on a pen torch or indirect ophthalmoscope held ~3 cm from the eye for ~10 seconds
- Start stopwatch immediately when light is removed
- Photostress Recovery Time (PSRT) = time taken to read any 3 letters of the pre-test VA line
- Normal PSRT = 15-30 seconds
- Repeat on the other (normal) eye for comparison
Interpretation
| PSRT Result | Interpretation |
|---|---|
| Prolonged (>50 seconds), worse than fellow eye | Macular disease (RPE or photoreceptor dysfunction) |
| Normal PSRT despite poor VA | Optic neuropathy (photoreceptors and RPE are fine; the problem is neural transmission) |
Why this logic works
- In macular disease: photoreceptors or RPE are damaged → visual pigment re-synthesis is slow → prolonged recovery
- In optic neuropathy: the retina is structurally normal → visual pigment re-synthesis is normal speed → PSRT is normal, even though VA is poor (because the problem is upstream in the nerve)
TEST 6: COLOUR VISION TESTING
Why Colour Vision Matters
- Useful in evaluating optic nerve disease (acquired dyschromatopsia)
- Detecting congenital colour vision deficiency (CVD)
- Monitoring retinal dystrophies (colour vision can deteriorate before VA)
Colour Vision Physiology
- Blue (tritan/S-cones): 414-424 nm
- Green (deuteran/M-cones): 522-539 nm
- Red (protan/L-cones): 549-570 nm
Types of Congenital Colour Vision Deficiency
| Type | Cone affected | Name | Prevalence |
|---|---|---|---|
| Red weakness | Red cones (L) reduced | Protanomaly | 2% of men |
| Red blindness | Red cones absent | Protanopia | - |
| Green weakness | Green cones (M) reduced | Deuteranomaly | 6% of men |
| Green blindness | Green cones absent | Deuteranopia | - |
| Blue-green deficiency | Blue cones (S) | Tritanomaly/Tritanopia | Rare |
Acquired Colour Defects - The Clinical Rule
- Macular/retinal disease → predominantly blue-yellow (tritan) defects
- Optic nerve disease → predominantly red-green (protan/deuteran) defects
Colour Vision Tests
1. Ishihara Test
- Screens for congenital protan and deuteran (red-green) defects only
- Does NOT detect tritan (blue-yellow) defects
- Consists of a test plate + 16 plates with dots arranged to show numbers/shapes
- A normal person sees one number; a colour-deficient person sees another or nothing
- If the test plate cannot be identified (despite adequate VA) = non-organic visual loss (malingering)
2. City University Test
- 10 plates, each with a central colour + 4 peripheral colours
- Patient chooses which peripheral colour most closely matches the central one
- Tests all three axes of colour vision (not just red-green)
3. Hardy-Rand-Rittler (HRR) Test
- Similar format to Ishihara
- Can detect all three types of congenital colour defects (protan, deuteran, AND tritan)
4. Farnsworth-Munsell 100-Hue Test
- Most sensitive test for both congenital AND acquired colour defects
- Despite the name, consists of 85 caps of different but closely related hues
- Patient arranges caps in colour order - any errors reveal the axis of deficiency
- Results plotted on a circular diagram with characteristic patterns for each deficiency type:
- Protanopia: errors at red end
- Deuteranopia: errors at green end
- Tritanopia: errors at blue end (tritanopia pattern)
- Longer test, mainly used in specialist practice and research
TEST 7: PLUS LENS TEST
Principle
Classic Application
- Fluid accumulates under the retina → sensory retina is elevated → creates a temporary hypermetropic shift
- A +1.00 D lens corrects this shift
- Improvement in VA with +1.00 D in a young patient with sudden visual disturbance = suggests CSR
Summary rule
TEST 8: PERIMETRY (VISUAL FIELDS)
What Is the Visual Field?
- Superior: ~50°
- Nasal: ~60°
- Inferior: ~70°
- Temporal: ~90°
Essential Definitions
| Term | Definition |
|---|---|
| Isopter | Line connecting points of equal sensitivity; on a 2D plot, encloses the area where a given stimulus is visible |
| Scotoma | Area of reduced (relative) or absent (absolute) vision surrounded by seeing area |
| Differential light sensitivity | Degree by which a target's luminance must exceed background luminance to be perceived |
| Threshold | Luminance of a stimulus at which it is seen on 50% of occasions it is presented |
| Decibel (dB) | Unit used in automated perimetry; 10 dB = 1 log unit; higher dB = more sensitive retina |
| Apostilb (asb) | Unit of luminance (stimulus intensity); higher asb = brighter |
Key threshold facts
- Normal threshold decreases by approximately 1 dB per 10 years after age 20
- The blind spot has sensitivity = 0 dB
- HFA background luminance = 31.5 asb (photopic - tests cones preferentially)
Types of Perimetry
Static Perimetry
- Stimulus location is fixed; intensity is varied until the threshold is reached
- More commonly used, forms the basis of automated perimetry
Kinetic Perimetry
- Stimulus intensity is fixed; it is moved from a non-seeing to a seeing area
- The point where it is first perceived = threshold at that meridian
- Multiple intensities used to build isopter contours (like a topographic map)
- Performed with Goldmann perimeter (manual) or automated equivalent
- Better for peripheral field mapping and patients who cannot do automated testing
Automated Perimetry (SAP - Standard Automated Perimetry)
Humphrey Field Analyser (HFA)
- Most widely used automated perimeter globally
- Uses SITA (Swedish Interactive Thresholding Algorithm) strategies - most common in clinical practice
- SITA Standard: most accurate
- SITA Fast: quicker, slightly less accurate
- SITA Faster: newest, fastest
Octopus Perimeter
- Similar automated system, used in some centres
Testing Algorithms
- Full threshold: tests every point from a starter intensity; most thorough but longest
- SITA: uses prior probability models to estimate threshold more efficiently
- Suprathreshold screening: presents one bright stimulus; pass/fail for each point (screening only, not quantitative)
HFA Printout - What to Analyse (in order)
- Fixation losses: Should be <20% (SITA: <20%)
- False positives: Should be <15% (SITA) - high = "trigger-happy" patient; grey scale looks pale (washed out)
- False negatives: Should be <15% - high = inattentive/tired patient; grey scale shows "cloverleaf" pattern
- If reliability is poor → do not interpret the field
- Raw dB values at each tested location
- Rechecked values shown in brackets if unexpectedly low (>5 dB from expected)
- Visual representation of the numerical data
- Darker = less sensitive = worse
- First impression of the field - but never interpret in isolation
- Compares each point to the age-corrected normal database
- Shows dB deviation from normal at each point
- Corrects for overall sensitivity depression (e.g. due to cataract)
- More specific for glaucomatous field loss
- If PD is normal but TD is abnormal → diffuse depression (cataract, media opacity, small pupil)
- MD (Mean Deviation): average deviation from normal across the field
- Negative value = worse than normal (e.g. -6 dB = moderately depressed field)
- PSD (Pattern Standard Deviation): measure of field irregularity; elevated in focal loss
- VFI (Visual Field Index): percentage of normal visual field remaining
Sources of Error in Perimetry
| Source | Effect | Solution |
|---|---|---|
| Uncorrected refractive error | Reduces central sensitivity | Use near correction for presbyopes |
| Miosis (<3 mm pupil) | Reduces peripheral sensitivity, increases variability | Dilate pupil before testing |
| Media opacity (cataract) | Diffuse sensitivity depression, exaggerated by miosis | Note in report; dilate |
| Spectacle rim artefact | Scotoma at periphery matching lens rim | Use trial frame lenses with large apertures |
| Ptosis or dermatochalasis | Suppresses superior field | Tape lid, document |
| Post-ophthalmoscopy | Inadequate retinal adaptation | Do perimetry before fundoscopy |
Microperimetry
- Measures retinal sensitivity and fixation behaviour in macular disease
- Uses a scanning laser ophthalmoscope (SLO) to image the fundus simultaneously with perimetry - allows exact correlation of structure and function
- MAIA perimeter: normal sensitivity = 18 dB; tests central 9°; 4-2 staircase threshold
- More sensitive than SAP for subtle macular abnormality
- Useful in: macular degeneration, macular surgery outcomes, early glaucoma near fixation
VIVA QUESTION BANK - Complete (Basic to Advanced)
SECTION A: BASIC / OPENER QUESTIONS
VA is the ability of the eye to resolve the minimum angle of separation between two objects at the nodal point of the eye, such that they are perceived as distinct. Normally this equals 1 minute of arc (MAR = 1').
The patient reads at 6 m the letters that a normal eye can read at 6 m. Each letter on the 6/6 line subtends 5 minutes of arc, with each limb of the letter subtending 1 minute of arc.
Best-corrected visual acuity - the best VA achievable with optimal refractive correction.
Test with correction first; test the worse eye first with the other fully occluded; push the patient to read every last letter; record unaided VA as well for completeness.
An area of reduced (relative) or absent (absolute) vision surrounded by a seeing field.
SECTION B: INTERMEDIATE / CLINICAL REASONING
When VA is less than 6/6. It eliminates the effect of refractive error by blocking peripheral rays. If VA improves with pinhole, the deficit is likely refractive.
In macular disease and posterior lens opacities. In maculopathy, the already degraded central resolution is further compromised by restricting the image through a small aperture. In posterior lens opacity, the dense opacity scatters light worse through a small aperture.
LogMAR = log₁₀ of the minimum angle of resolution. For 6/6, MAR = 1', log(1) = 0.00. For 6/60, MAR = 10', log(10) = 1.00. For 6/12, MAR = 2', log(2) = 0.30.
LogMAR charts have equal numbers of letters per line (5), equal spacing, similar inter-letter readability, and allow per-letter scoring (0.02 units each). This gives higher accuracy, reproducibility and avoids the unequal crowding effect of Snellen charts.
Tests central 20° of vision centred on fixation. Chart 1 = white grid on black (standard); 2 = no central dot (central scotoma); 3 = red lines; 4 = white dots; 5 = horizontal lines (metamorphopsia along specific meridians); 6 = white background, closer lines; 7 = fine grid (half-degree squares, most sensitive).
Do not dilate the pupil. Do not perform slit-lamp examination beforehand (photo-stress effect on macula). Use near reading correction if presbyopic.
Wavy/distorted lines = metamorphopsia = macular disease (retina is physically distorted). Missing/faint lines without distortion = scotoma = optic neuropathy (neural deficit, not structural distortion).
Bleaches retinal visual pigments with a bright light for 10 seconds, then measures the time for VA to recover to pre-test level (read any 3 letters of the pre-test acuity line). Normal PSRT = 15-30 seconds.
In macular disease: photoreceptors/RPE are damaged → visual pigment re-synthesis is slow → PSRT >50 seconds. In optic neuropathy: the retina and RPE are intact → visual pigment re-synthesis is normal → PSRT is normal despite poor VA (the problem is neural, not photoreceptor).
An indirect ophthalmoscope light is shone into each eye sequentially. The patient rates relative brightness. Dimness in one eye = optic neuropathy in that eye (reduced afferent neural transmission). Normal in retinal disease (early/moderate).
SECTION C: ADVANCED / EXAMINER FAVOURITE QUESTIONS
The CSF is a curve plotting the minimum contrast needed to detect gratings at different spatial frequencies. It is useful when patients complain of visual symptoms (especially in dim light) despite normal Snellen VA. Conditions: amblyopia, optic neuropathy, PSC cataract, higher-order aberrations.
Viewed at 1 metre. All letters the same size (1 cycle/degree spatial frequency). Letters grouped in triplets, each triplet decreasing by 0.15 log units of contrast. Patient reads until they cannot resolve a group. Tests contrast sensitivity at a single spatial frequency.
A +1.00 D lens is placed before the eye. In conditions with localised elevation of the sensory retina (e.g. central serous retinopathy), the retina is pushed forward creating a hypermetropic shift. The +1.00 D lens corrects this shift and VA improves. Classical condition: CSR in a young patient.
Protan = red (L-cone) defect; deuteran = green (M-cone) defect; tritan = blue (S-cone) defect. Protanomaly/deuteranomaly = cone weakness; protanopia/deuteranopia = cone absence. Anomalous trichromats use abnormal proportions of all three primaries. Dichromats are missing one cone type entirely.
Macular disease → blue-yellow (tritan) defects. Optic nerve disease → red-green (protan/deuteran) defects.
Screens for congenital protan and deuteran defects only. Does NOT detect tritan defects. The test plate (plate 1): if a patient cannot identify it despite adequate VA = suggests non-organic (functional) visual loss.
Hardy-Rand-Rittler (HRR) test. (Also the Farnsworth-Munsell 100-hue test for acquired defects.)
A three-dimensional representation of differential light sensitivity across the visual field. The fovea is the peak of the hill (highest sensitivity). Sensitivity declines toward the periphery. The blind spot is a "bottomless pit" temporally between 10-20° below the horizontal.
Fixation losses (<20%), false positives (<15% for SITA - grey scale appears pale/washed out if high), false negatives (<15% for SITA - grey scale shows cloverleaf pattern if high). If indices are significantly abnormal, the field is unreliable and should not be interpreted.
Total deviation (TD): compares each point to the age-corrected normal database - shows absolute deviation. Pattern deviation (PD): corrects for overall sensitivity depression (e.g. from cataract) and reveals focal defects. If TD is abnormal but PD is normal = diffuse depression (cataract, miosis, media opacity). If both are abnormal = focal field loss (glaucoma, neuro).
MD (Mean Deviation) = average deviation from the normal field (negative = depressed). PSD (Pattern Standard Deviation) = measure of field irregularity (elevated in focal loss like glaucoma). VFI (Visual Field Index) = percentage of normal visual field remaining (100% = normal, 0% = blind).
Reduces peripheral field sensitivity and increases variability in the central field in both normal and glaucomatous eyes. Pupils < 3 mm should be dilated before testing. The same mydriatic should be used for all serial tests for consistency.
Microperimetry measures retinal sensitivity and fixation behaviour by projecting stimuli onto the retina while simultaneously imaging the fundus with an SLO, allowing exact structure-function correlation. It is more sensitive than SAP for subtle macular abnormalities. Tests the central 9°. The MAIA perimeter uses Goldmann size 3 stimuli, 4-2 staircase thresholding, normal sensitivity = 18 dB.
Static: stimulus location fixed, intensity varied until threshold reached. Kinetic: stimulus intensity fixed, moved from non-seeing to seeing area; point of detection recorded. Multiple kinetic tests build isopter contours. Goldmann perimeter = standard kinetic device.
At low (scotopic) luminance, rods predominate in the periphery → peripheral retina becomes relatively more sensitive → hill of vision flattens, with a central crater (not peak) at the fovea because cones are insensitive in low light. Some diseases (e.g. retinitis pigmentosa) show markedly worse fields at low background luminance.
BONUS VIVA TRAPS
| Trap Question | Correct Answer |
|---|---|
| "Pinhole always improves VA" | FALSE - worsens in macular disease and posterior lens opacities |
| "Ishihara detects all colour defects" | FALSE - only detects protan and deuteran (not tritan) |
| "Wavy Amsler lines = optic neuritis" | FALSE - wavy lines = macular disease; optic neuritis = missing lines, no distortion |
| "High false negatives always = malingering" | FALSE - occasionally indicates disease severity |
| "Teller cards are reliable in amblyopia" | FALSE - grating acuity often exceeds Snellen acuity in amblyopia → overestimates VA |
| "Photostress prolonged = optic neuropathy" | FALSE - prolonged PSRT = macular disease; normal PSRT with poor VA = optic neuropathy |
| "Pattern deviation normal but total deviation abnormal" | Diffuse depression - think cataract, miosis, media opacity - NOT glaucoma |
don't only take notes from kanski, also take it from other standard textbook and make a note in chat, each and every detail, how does it happen, why does it happen, its mechanism, everything
PSYCHOPHYSICAL TESTS - The Complete Master Note
Sources: Kanski (10th Ed.) · Guyton & Hall (Medical Physiology) · Ganong's (26th Ed.) · Kandel's Principles of Neural Science (6th Ed.) · Localization in Clinical Neurology (8th Ed.) · Bradley & Daroff's Neurology in Clinical Practice
PART 0: PHYSIOLOGICAL FOUNDATION - HOW VISION WORKS
0.1 THE PHOTORECEPTORS: RODS AND CONES
Rods
- ~120 million per retina
- Located predominantly in the peripheral retina (absent from the fovea)
- Respond to dim/scotopic light - night vision
- One type of photopigment: rhodopsin (absorbs maximally at ~500 nm)
- High convergence: up to 100-200 rods synapse on a single ganglion cell → high sensitivity, low acuity
- Cannot distinguish colour (only one pigment = one type of signal)
Cones
- ~6 million per retina
- Concentrated in the fovea (densely packed, ~150,000/mm²)
- Respond to bright/photopic light - day vision and colour
- Three types of cone pigment (opsins), each with a different absorption peak:
- S-cones (short/blue): peak ~414-424 nm
- M-cones (medium/green): peak ~522-539 nm
- L-cones (long/red): peak ~549-570 nm
- Low convergence in fovea: 1 cone → 1 bipolar → 1 ganglion cell (private line) → high acuity
- Can distinguish colour because brain compares signals from three different cone types
| Property | Rods | Cones |
|---|---|---|
| Number | ~120 million | ~6 million |
| Location | Peripheral retina | Concentrated at fovea |
| Light threshold | Low (scotopic) | High (photopic) |
| Convergence | 100-200:1 | 1:1 (fovea) |
| Colour | No | Yes (3 types) |
| Acuity | Low | High |
| Dark adaptation | Slow (40 min, 25,000x) | Fast (few min, limited) |
0.2 PHOTOTRANSDUCTION - HOW LIGHT BECOMES A NERVE SIGNAL
Step-by-step phototransduction in rods:
-
At rest (dark): The rod outer segment discs contain rhodopsin = opsin protein + 11-cis retinal (a vitamin A derivative). The photoreceptor is depolarised in the dark - sodium and calcium ions continuously flow in through cGMP-gated channels (the "dark current"), causing continuous release of glutamate onto bipolar cells.
-
Light hits the photoreceptor:
- A photon is absorbed by 11-cis retinal
- The retinal undergoes isomerization: 11-cis retinal → all-trans retinal (a conformational change/rotation around a double bond)
- This change in shape forces a conformational change in opsin → creating metarhodopsin II (the active form)
-
G-protein cascade:
- Metarhodopsin II activates transducin (a G-protein, Gαt subunit)
- Transducin activates phosphodiesterase (PDE)
- PDE hydrolyses cGMP → 5'-GMP (reducing cGMP levels)
- Falling cGMP → cGMP-gated channels close
- Less Na⁺/Ca²⁺ enters → hyperpolarisation of the photoreceptor
- Hyperpolarisation → reduced glutamate release onto bipolar cells → signal to the brain
-
Recovery (bleaching and regeneration):
- Metarhodopsin II is unstable → splits into opsin + all-trans retinal
- All-trans retinal is transported to the RPE (retinal pigment epithelium)
- RPE converts it back to 11-cis retinal (via vitamin A/retinol intermediates)
- 11-cis retinal is transported back to the rod to reform rhodopsin
- This regeneration cycle is the basis of the photostress test
Why the RPE matters so much: If the RPE is damaged (as in macular disease), the entire regeneration cycle is slowed or fails. This is why photostress recovery time is prolonged in maculopathy.
Cone phototransduction
0.3 DARK AND LIGHT ADAPTATION - THE MECHANISM
Dark adaptation:
- Visual pigments are bleached in bright light (all-trans retinal is formed faster than it can be regenerated)
- In darkness, regeneration proceeds: rhodopsin is slowly rebuilt
- Sensitivity increases over time as more unbleached pigment becomes available
- Phase 1 (0-5 minutes): Rapid, limited improvement → cone adaptation (cones adapt ~4x faster than rods but achieve less total gain)
- Phase 2 (5-40 minutes): Slow, large improvement → rod adaptation (rods regenerate rhodopsin slowly but achieve enormous sensitivity gain)
- After 40 minutes in total darkness: sensitivity increases ~25,000x
- Total range from brightest to darkest adaptation: 500,000 to 1 million times
- Pupillary response - fast (~fraction of a second), ~30-fold change
- Neural adaptation - bipolar, amacrine, horizontal, and ganglion cells all show rapid adaptation at circuit level (seconds), but less magnitude (~few-fold)
- Photopigment concentration - the primary mechanism (minutes to hours), greatest magnitude
Why this matters clinically: The photostress test exploits the photopigment regeneration mechanism. Background luminance during perimetry (31.5 asb in HFA) affects whether rods or cones are tested. Testing in dim light (scotopic) activates rods; bright light (photopic) tests cones.
0.4 THE FOVEA AND WHY IT IS THE SEAT OF VISUAL ACUITY
- Densely packed small cones (~1.5 µm diameter) - the finest grain of any part of the retina
- One-to-one neural wiring: 1 cone → 1 bipolar cell → 1 ganglion cell - no convergence means spatial resolution is preserved
- Absent overlying cells and blood vessels - no scattering of incoming light
- Absent rods - rods would add noise at the fovea; they are excluded entirely
- Yellow macular pigment (lutein, zeaxanthin) - filters blue light and reduces chromatic aberration
0.5 THE VISUAL PATHWAY - WHY LESION LOCATION MATTERS
Cornea → Lens → Vitreous → Retina (fovea) →
Optic nerve → Optic chiasm → Optic tract →
Lateral Geniculate Nucleus (LGN) → Optic radiations →
Primary visual cortex (V1, striate cortex, occipital lobe)
Critical localisation rules (Localization in Clinical Neurology):
- Lesions at or anterior to the chiasm (optic nerve, retina, media) → can reduce VA
- Unilateral retrochiasmal lesions (optic tract, LGN, radiations, cortex) → do NOT impair VA (because both hemifields still receive input from the intact hemisphere)
- Bilateral retrochiasmal lesions → VA reduces equally in both eyes
- Medial chiasmal lesions → reduce VA because they affect the crossing macular fibres
- Lateral chiasmal lesions → impair VA in the ipsilateral eye only
- Optic nerve lesions → cause VA loss often before a field defect is detected (very early sign)
Key principle (Frisen's rule): Acuity will remain normal if either the crossing OR the non-crossing set of fibres from the fovea remains intact.
PART 1: VISUAL ACUITY - FULL MECHANISM
1.1 The Resolution Limit of the Eye
- Optical diffraction - the wave nature of light limits how small a point image can be focused (Airy disc)
- Optical aberrations - imperfect lens and cornea produce blur circles; even the perfect eye has a focused spot ~11 µm in diameter (Guyton)
- Photoreceptor density - the finest resolvable detail cannot be smaller than the space between individual photoreceptors (Nyquist sampling theorem)
- Neural factors - the wiring pattern (convergence) determines how much of that retinal resolution is preserved in the signal to the brain
1.2 Snellen Notation - Full Understanding
- Each letter subtends 5 minutes of arc at the stated denominator distance
- Each limb (stroke) of the letter subtends exactly 1 minute of arc - the MAR of the normal eye
- So a 6/6 letter at 6 m: the limb is 1.75 mm tall (subtending 1' at 6 m)
1.3 Pinhole - Full Mechanism
1.4 LogMAR - Why It Is Scientifically Superior
1.5 Distance-Near VA Discrepancy - Clinical Significance
- In congenital nystagmus: convergence for near vision damps the nystagmus → near acuity appears better
PART 2: CONTRAST SENSITIVITY - FULL MECHANISM
2.1 The Physics: Spatial Frequency
- Spatial frequency (cycles per degree) - how fine the stripes are
- Contrast = (Lmax - Lmin) / (Lmax + Lmin) - the Michelson contrast
- At very low spatial frequencies: sensitivity falls (because the inhibitory surround of ganglion cells subtracts from the centre response)
- At intermediate spatial frequencies (~3-5 cycles/degree): sensitivity is maximal
- At high spatial frequencies: sensitivity falls (because the blur circle of the optical system limits resolution)
2.2 The Neural Mechanism
- Excitatory centre: responds to light in a small central region
- Inhibitory surround: responds when light is removed from a surrounding annular zone (ON-centre/OFF-surround cells) or vice versa
- At high spatial frequencies (very fine stripes): both the centre and the surround receive the same average illumination → no contrast response
- At intermediate frequencies: the grating is just the right size to maximally stimulate the centre while the surround receives the opposing phase → maximal response
- At low spatial frequencies: the grating is so coarse that both centre and surround receive the same average light → the surround cancels the centre → low response
2.3 Why Contrast Sensitivity Falls Before VA in Optic Neuropathy
- M-cells (magnocellular/parasol): large cells, low contrast threshold, fast, motion/temporal processing
- P-cells (parvocellular/midget): small cells, high contrast threshold, colour, fine spatial detail
- K-cells (koniocellular): diffuse; blue-yellow colour
PART 3: COLOUR VISION - FULL MECHANISM
3.1 Trichromatic Theory (Young-Helmholtz)
3.2 Molecular Basis of Colour Vision
- All four visual pigments (rhodopsin + 3 cone opsins) share the same light-absorbing molecule: retinal (a vitamin A derivative)
- The difference in peak absorption comes from the protein (opsin) surrounding the retinal
- Different amino acid sequences in the binding pocket alter the electron environment around retinal → shift the absorption peak
- L and M opsins share 96% amino acid identity - they diverged ~30 million years ago
- S opsin diverged much earlier
- All four evolved from a common ancestral opsin by gene duplication and divergence
3.3 Opponent Process Theory
- Red-green channel: L-cone signal minus M-cone signal (or vice versa)
- Blue-yellow channel: S-cone signal minus (L+M) cone signals
- Luminance channel: L+M cone signals combined
3.4 Types of Colour Deficiency - Exact Mechanisms
- Protan defects: Abnormal or absent L-cones (red). Gene on X chromosome.
- Protanomaly: abnormal L-opsin with shifted peak → reduced red discrimination (2% of men)
- Protanopia: complete absence of L-cones → dichromacy (cannot distinguish red from green by hue)
- Deuteran defects: Abnormal or absent M-cones (green). Gene on X chromosome, adjacent to L-opsin gene.
- Deuteranomaly: abnormal M-opsin → reduced green discrimination (6% of men, most common)
- Deuteranopia: complete absence of M-cones
- Tritan defects: Abnormal or absent S-cones (blue). Gene on chromosome 7 (autosomal, not X-linked), hence equal prevalence in men and women, and rare (~1 in 10,000)
- Tritanomaly / tritanopia: blue-yellow axis defect
3.5 Acquired Colour Defects - Why the Pattern Differs
-
Macular/retinal disease → blue-yellow (tritan-type) defects
- The macula is rich in M and L cones. The fovea is virtually devoid of S-cones. So macular damage that is diffuse tends to preferentially affect the blue-yellow discrimination channel (which already has limited foveal input). Also, macular oedema and drusen preferentially affect S-cone pathways.
-
Optic nerve disease → red-green (protan/deuteran-type) defects
- The P-cell pathway (which carries colour information, especially red-green) travels predominantly through the papillomacular bundle - the dense group of nerve fibres connecting the fovea to the optic disc. This bundle is very vulnerable to optic nerve compression and inflammation because it occupies a large portion of the central nerve. Early optic neuropathy damages the P-pathway and disrupts red-green colour discrimination.
This rule (retinal = blue-yellow; optic nerve = red-green) is one of the most tested distinctions in ophthalmology viva exams.
3.6 Colour Vision Tests - Mechanism of Each
Pseudoisochromatic plates (Ishihara, HRR)
- Mechanism: Numbers/shapes are formed from dots that differ in hue but are equal in luminance (brightness) compared to the background
- A normal trichromat sees the hue difference → reads the number
- A colour-deficient person sees no hue difference (dots are "isochromatic" to them) → sees nothing or sees a different number
- Why can't Ishihara detect tritan defects? Because the Ishihara plates are designed along the red-green confusion axis - the dots are isochromatic for protan/deuteran confusion lines only. The plate design does not include confusion lines for the blue-yellow axis.
- Why does failure to see the test plate suggest malingering? The test plate is designed so that even a completely colour-blind person should be able to see it (it contains cues beyond just hue). Inability to see it with adequate VA suggests the patient is not cooperating.
Farnsworth-Munsell 100-Hue test
- Mechanism: Patient arranges 85 colour caps in hue order. Errors cluster at a specific region of the hue circle depending on the type and axis of deficiency
- Protanopia errors cluster at the red end; deuteranopia at the green end; tritanopia at the blue end
- The pattern of errors is plotted on a circular diagram → the error score quantifies severity and the axis identifies type
PART 4: PHOTOSTRESS TEST - FULL MECHANISM
4.1 Visual Pigment Bleaching
- Massive photon flux hits the photoreceptors
- Almost all available 11-cis retinal is isomerized to all-trans retinal
- Most of the rhodopsin (and cone photopigments) is bleached (converted to inactive metarhodopsin II then to opsin + all-trans retinal)
- The eye experiences a dramatic temporary reduction in sensitivity - this is the bleach scotoma the patient perceives as a bright afterimage
4.2 Recovery - The Regeneration Cycle
- All-trans retinal is released from the photoreceptor outer segment
- All-trans retinal → transported to RPE cells via interphotoreceptor retinoid-binding protein (IRBP)
- In the RPE: all-trans retinal → all-trans retinol (vitamin A₁) (via retinol dehydrogenase)
- All-trans retinol → 11-cis retinol (via RPE65 isomerase - the rate-limiting enzyme)
- 11-cis retinol → 11-cis retinal (via 11-cis retinol dehydrogenase)
- 11-cis retinal transported back to photoreceptor → recombines with opsin → rhodopsin restored
- Vision recovers
4.3 Why Optic Neuropathy Does NOT Prolong Recovery
- Prolonged PSRT + poor VA = macular/retinal disease
- Normal PSRT + poor VA = optic neuropathy (or other pre/retinal neural cause)
4.4 Normal Values and Technique Precision
- PSRT = time to read any 3 letters on the pre-test VA line
- Normal: 15-30 seconds (Kanski) / upper limit 50 seconds (Bradley & Daroff)
- Macular disease: often >50 seconds, sometimes several minutes
- Always test the normal fellow eye first for comparison (because PSRT varies between individuals)
- The fellow eye comparison is essential - an individual with bilateral macular disease would have prolonged PSRT bilaterally but not know without comparing to a known normal
PART 5: AMSLER GRID - MECHANISM
5.1 Why the Grid Works
- The foveal and parafoveal photoreceptors are arranged in a precise mosaic
- The visual cortex uses this regular mosaic to interpret straight lines as straight
- When the retina is distorted (lifted up by subretinal fluid, pressed down by drusen, or pulled by epiretinal membrane), the photoreceptor mosaic is physically deformed
- Straight lines in the visual world fall on photoreceptors that are no longer in their normal positions
- The visual cortex still interprets signal location based on the photoreceptor's "expected" position → the line appears bent/wavy where it is not
- This is metamorphopsia
- When photoreceptors are destroyed (by atrophy, neovascular scar, infarction), no signal is generated from that part of the visual field
- The visual cortex receives no input from those spatial locations → perceived as a blank/missing area
5.2 Why You Must Not Examine with the Slit Lamp First
5.3 Amsler vs Optic Nerve - Why the Pattern Differs
- Physical distortion of the retina → distorted spatial mapping of light → wavy appearance of what should be straight lines
- The visual cortex is receiving signals from displaced photoreceptors
- The retina and photoreceptors are intact and in their normal positions → no spatial distortion → no metamorphopsia
- The optic nerve fibres are damaged → signals simply fail to arrive at the cortex from certain regions → those areas appear blank or missing, but not distorted
PART 6: LIGHT BRIGHTNESS COMPARISON TEST - MECHANISM
6.1 The Afferent Visual Pathway and Subjective Brightness
- Axons of retinal ganglion cells are demyelinated or damaged
- The conduction velocity slows and fewer action potentials arrive at the LGN and cortex per unit time
- The cortex receives a weaker/reduced signal from that eye
- This is perceived as a reduction in brightness/luminance - the light looks less intense
6.2 Why Retinal Disease Usually Preserves Light Brightness
- Only part of the retina is affected (e.g. one quadrant in BRVO, the periphery in RP)
- The macular/foveal ganglion cells that project most strongly to the LGN are often relatively preserved
- The overall density of signals reaching the visual cortex from the affected eye is still close to normal
- Hence, subjective brightness is similar in both eyes
6.3 The Numerical Rating System
PART 7: PERIMETRY - DEEP MECHANISM
7.1 The Hill of Vision - Why This Shape?
- The fovea has the highest density of cones with 1:1 neural wiring → highest sensitivity at the apex
- Moving peripherally: photoreceptors are sparser and convergence increases → sensitivity falls
- The nasal slope is steeper than the temporal because the nasal retina (which sees temporal visual field) has lower cone density than the temporal retina
- The blind spot is where the optic disc is located - no photoreceptors → absolute scotoma → "bottomless pit"
7.2 Decibels in Perimetry - The Logic
- 10 dB = 1 log unit of stimulus intensity
- The scale is inverted from conventional acoustics - a higher dB number = MORE sensitive retina (can detect a dimmer stimulus)
- The relationship: if a point needs a very bright stimulus to be detected, it is insensitive (low dB). If it detects a dim stimulus, it is sensitive (high dB)
- Blind spot = 0 dB (no sensitivity - requires infinitely bright stimulus)
- Normal fovea: ~33-35 dB on HFA
7.3 Static vs Kinetic: Why Each Exists
- Tests sensitivity at fixed known locations by varying the brightness
- Gives an exact threshold at each test point
- Allows statistical comparison to age-matched normal databases
- Best for following progression over time (glaucoma monitoring)
- Maps isopters (boundaries of where a given stimulus is visible)
- Better for mapping large peripheral defects and visual field extent
- Less time-efficient but excellent for patients who cannot do automated testing (low vision, nystagmus, poor fixation)
- Goldmann perimeter: a fixed bowl with adjustable stimulus size (I-V) and brightness (1-4)
7.4 SITA Algorithm - How It Works
- A prior probability distribution of expected thresholds is established from a large normal database (age-matched)
- At each test location, the algorithm starts with a stimulus near the expected threshold
- Based on the patient's response (seen/not seen), the algorithm updates its estimate of the true threshold using Bayesian inference
- The test continues until the algorithm's estimate converges on a precise threshold value
- SITA is significantly faster than the older full-threshold strategy because it uses information from previous responses and neighbouring points to update estimates simultaneously
7.5 Sources of Perimetric Error - Mechanisms
- A small pupil (<3 mm) acts like a pinhole - reduces total light entering the eye
- In perimetry, this reduces the effective luminance of the test stimuli
- Results in apparently reduced retinal sensitivity, especially peripherally
- Mechanical constriction of the pupil also creates directional sensitivity differences (Stiles-Crawford effect)
- Solution: dilate to standardize pupil size; use consistent mydriatic for serial tests
- A blur circle on the retina spreads the stimulus light over a larger retinal area → reduces local contrast of the stimulus → stimulus needs to be brighter to be detected → apparent central sensitivity reduction
- A hypermetropic patient tested without near correction will appear to have central field depression
- Scatter light within the eye → reduces effective contrast of stimuli → apparent diffuse field depression
- In the pattern deviation plot, this diffuse depression is mathematically removed, revealing any focal defects
- Trial frame spectacle lenses block peripheral rays from reaching the eye
- Creates a sharply bounded peripheral scotoma in the temporal field that exactly matches the spectacle rim position - this is an artefact, not disease
- HFA uses 31.5 asb (photopic) - tests cones
- Some diseases (RP, scotopic dysfunction) may show much worse fields at lower background luminance
- Doing perimetry immediately after ophthalmoscopy can affect results due to inadequate dark adaptation
7.6 Reliability Indices - Why They Matter Mechanically
- Assessed by periodically presenting a stimulus to the known blind spot location
- If the patient responds → they were not fixating (the image was falling outside the blind spot)
- High fixation loss: the entire field map may be spatially inaccurate
- Machine decouples the stimulus presentation from its accompanying sound
- If patient presses the button when only the sound plays (no light) → false positive
- High false positives: patient is "trigger happy" → artificially elevated sensitivity → grey scale looks unrealistically pale/white
- Machine re-presents a stimulus much brighter than the previously established threshold at a location that should be easily seen
- If patient fails to respond → false negative
- High false negatives: patient is inattentive/fatigued → grey scale shows characteristic cloverleaf pattern (peripheral points tend to be missed while central fixated areas are tested correctly)
PART 8: PLUS LENS TEST - FULL MECHANISM
8.1 Central Serous Chorioretinopathy - The Pathophysiology
- Hyperpermeability of the choriocapillaris (choroidal capillaries) → fluid leaks into the subretinal space
- The RPE normally pumps fluid out actively; in CSR, a focal RPE defect allows fluid to accumulate
- This fluid lifts the sensory retina (the neurosensory layer) away from the RPE
- The foveal cones are now physically elevated - they are closer to the lens than normal
8.2 How This Creates a Hypermetropic Shift
PART 9: COMPLETE VIVA QUESTION BANK (Expanded)
LEVEL 1: BASIC SCIENCE
Light hits rhodopsin (opsin + 11-cis retinal) → 11-cis retinal isomerizes to all-trans retinal → conformational change in opsin → activates transducin (G-protein) → activates phosphodiesterase → hydrolyses cGMP → cGMP-gated channels close → hyperpolarization of photoreceptor → reduced glutamate release.
Densely packed small cones (~1.5 µm), 1:1 wiring (cone:bipolar:ganglion), no overlying cells/vessels, no rods, and yellow macular pigment filtering chromatic aberration.
Regeneration of visual pigment after light exposure. The curve has two phases: early fast cone adaptation (few minutes, limited gain) and late slow rod adaptation (up to 40 minutes, ~25,000x sensitivity gain). The inflection between phases is the rod-cone break.
Three types of cone cells with different spectral sensitivities (S, M, L) generate signals that the brain combines to produce colour perception. Any colour can be matched by three primary lights in appropriate proportions.
L and M opsin genes are on the X chromosome. Men (XY) have only one X chromosome - a single defective allele is sufficient to produce the defect. Women (XX) need defective alleles on both X chromosomes (X-linked recessive), so the carrier female has normal colour vision.
LEVEL 2: CLINICAL MECHANISMS
Macular disease: photoreceptors are structurally damaged, not an optical problem - restricting aperture reduces light and provides no benefit while further degrading the already poor macular signal. PSC: the opacity is on the visual axis - a small aperture forces all light through the densest part of the cataract, worsening scatter.
Contrast sensitivity testing (Pelli-Robson chart) - this can detect reduced contrast sensitivity in the intermediate spatial frequency range even when high-contrast VA is normal. Conditions: optic neuropathy, amblyopia, PSC cataract.
Bright light bleaches photopigments (isomerises 11-cis retinal to all-trans retinal). Recovery depends on RPE65 isomerase activity in the RPE regenerating 11-cis retinal. Damaged RPE (macular disease) = slow regeneration = prolonged PSRT. Intact RPE (optic neuropathy) = normal regeneration = normal PSRT.
Metamorphopsia = physical distortion of the retinal photoreceptor mosaic (e.g. by subretinal fluid, epiretinal membrane) → distorted spatial mapping → straight lines appear wavy. Scotoma = photoreceptor destruction → absent signal from that area → blank spot. Metamorphopsia = retinal disease with physical distortion. Scotoma without metamorphopsia = optic nerve or retinal damage without physical displacement.
Macular disease preferentially affects S-cone input (fovea is relatively S-cone poor; diffuse macular damage disrupts blue-yellow opponent channel). Optic nerve disease damages the papillomacular bundle which carries P-cell fibres (parvocellular) that predominantly carry red-green opponent colour signals.
Reduces effective stimulus luminance reaching the retina → apparent reduction in retinal sensitivity especially peripherally → may falsely indicate field loss. Pupils <3 mm should be dilated before perimetry.
LEVEL 3: ADVANCED / MECHANISM TRAPS
VA (Snellen) uses maximum contrast (black/white) high-spatial-frequency targets - primarily testing the P-cell pathway and foveal cone resolution. Contrast sensitivity tests a range of spatial frequencies at varying contrast - also probes the M-cell pathway and intermediate spatial frequency channels. These pathways have separate fibres and can be differentially affected by disease.
SITA uses Bayesian probability estimation. It begins with a prior probability distribution of expected thresholds from age-matched normals. Responses update the probability estimate, and information from neighbouring test points simultaneously updates estimates across the field. This allows fewer stimulus presentations to reach a sufficiently precise threshold at each point, compared to full-threshold which starts blind at each point and uses a fixed staircase regardless of prior information.
False negatives are measured by presenting a bright stimulus at previously-established threshold locations. An inattentive patient misses these. Inattention tends to develop for peripheral locations as the test progresses - the patient starts well (fixating on central targets) but as fatigue sets in, peripheral targets are missed. The central points tend to be retested last and are still answered → the printout shows preserved central sensitivity with peripheral defects = cloverleaf.
- Projection of light test: test all 4 quadrants - accurate projection suggests intact retinal function. 2. Ultrasound B-scan: assess retinal detachment/gross retinal integrity. 3. Pupillary response to light: an intact direct and consensual response suggests the afferent pathway to the brainstem is functioning. 4. Pattern VEP: if possible. 5. Electroretinogram (ERG): gold standard for photoreceptor function assessment.
Based on Frisen's principle: VA requires only that either the crossing or the non-crossing macular fibres reach the cortex intact. A unilateral lesion posterior to the chiasm affects only one optic radiation (e.g. left optic radiation). The right eye's nasal fibres still cross at the chiasm and project to the right cortex intact. The left eye's temporal fibres also reach the right cortex intact. So one hemisphere retains input from both foveae - VA is preserved (though there is a field defect).
The slit lamp beam (especially with the central beam used for fundoscopy with a contact lens) delivers intense light to the macula, bleaching macular photopigments. The macula then enters a photostress recovery period of 15-50+ seconds. Testing the Amsler grid immediately produces a temporary reduction in macular sensitivity (artificial scotoma) and possible apparent distortion from the uneven bleach pattern across the macula - this is a test artefact, not pathology.
In CSR, subretinal fluid elevates the sensory retina anteriorly. This moves the retinal photoreceptors forward of their normal focal plane. Parallel rays from infinity now focus behind the elevated retina - creating functional hypermetropia. A +1.00 D plus lens converges these rays earlier, moving the focal point forward to meet the elevated retina. Vision sharpens as the focus is restored to the photoreceptor layer.
RAPID-FIRE HIGH-YIELD FACTS
| Point | Answer |
|---|---|
| Minimum angle of resolution (normal) | 1 minute of arc |
| Each foveal cone diameter | ~1.5 µm |
| Minimum retinal separation for 2 points | ~2 µm |
| 25 seconds of arc | exact minimum angle for point source discrimination (Guyton) |
| Rhodopsin peak absorption | ~500 nm |
| S, M, L cone peaks | 414-424, 522-539, 549-570 nm |
| Dark adaptation - cone phase | 0-5 minutes |
| Dark adaptation - rod phase | 5-40 minutes |
| Total sensitivity range eye | 500,000 to 1 million times |
| Decibel in perimetry | Higher dB = more sensitive retina |
| Normal foveal threshold (HFA) | ~33-35 dB |
| Blind spot dB | 0 dB |
| HFA background luminance | 31.5 asb (photopic) |
| Normal PSRT | 15-30 sec (Kanski); up to 50 sec (Bradley & Daroff) |
| Pelli-Robson chart distance | 1 metre |
| Pelli-Robson contrast steps | 0.15 log units per triplet |
| Ishihara plates: what does it test | Protan + deuteran (red-green only) |
| Which colour test detects all 3 types | Hardy-Rand-Rittler |
| Most sensitive colour test | Farnsworth-Munsell 100-hue (85 caps) |
| Tritan defects - chromosome | Chromosome 7 (autosomal) |
| Macular disease - colour axis | Blue-yellow (tritan) |
| Optic nerve disease - colour axis | Red-green (protan/deuteran) |
explain THE RESOLUTION LIMIT OF THE EYE in more simple language
The Resolution Limit of the Eye - Simply Explained
Start with a simple question: Why can't you read tiny text from far away?
Step 1: Think of your eye like a camera
- The cornea + lens = the camera lens (focuses the image)
- The retina = the camera sensor (captures the image)
- The cones in the fovea = the individual pixels of that sensor
- How sharply the lens can focus
- How small the "pixels" (cones) are
Step 2: The "pixel" problem - Cone spacing
- If both dots fall on the same cone → your brain gets ONE signal → you see ONE dot
- If the two dots fall on two different cones with a gap (an unstimulated cone) between them → your brain gets two separate signals → you see TWO dots
Step 3: The "blur" problem - Optical imperfection
Step 4: Putting it together - The 2-micrometre rule
- Each cone is ~1.5 µm wide
- The blur circle is ~11 µm wide (but brightest in the centre, fading at edges)
- The blur circle's bright centre is much smaller than 11 µm
- Dot 1 stimulates cone A
- The gap between them → cone B (middle cone) gets minimal/no stimulation
- Dot 2 stimulates cone C
Step 5: Translating to Angles - Why we use "minutes of arc"
- Stand at a distance and hold two pencils apart
- The closer you are to them, the wider the angle between them appears
- The further away, the narrower the angle
- The 2 µm retinal separation = 1 minute of arc at the nodal point of the eye
- That means: two objects need to subtend at least 1 minute of arc for your eye to see them as separate
- Two bright dots 10 metres away: you can just about tell them apart if they are 1.5-2 mm apart
- Anything closer than that at 10 m → looks like one dot
Step 6: Why the fovea? Why not the periphery?
- Cones get further apart
- 100+ rods converge onto a single nerve fibre
- The "pixel size" effectively gets bigger and bigger
Step 7: The Snellen chart connects all of this
- At 6 metres, the stroke of a 6/6 letter = 1.75 mm tall
- 1.75 mm at 6 m = 1 minute of arc = exactly the MAR of the normal eye
The simple summary
| Limiting factor | What it means in plain English |
|---|---|
| Cone size (~1.5 µm) | Your "pixels" are 1.5 µm wide - can't see detail smaller than that |
| Blur circle (~11 µm, bright centre ~2 µm) | Even perfect optics make a slightly blurry point, not a perfect dot |
| MAR = 1 minute of arc | Two things must be 1/60th of a degree apart for you to see them as separate |
| 1:1 wiring at fovea | Every cone sends its own private signal to the brain - maximum detail preserved |
| Convergence in periphery | Peripheral "pixels" are huge - detail is lost |
One analogy to remember it all:
Imagine a tiled bathroom floor. The fovea is the part of the floor with tiny, perfectly laid mosaic tiles (each tile = 1 cone). You can see even fine detail on that part. The peripheral retina is like large floor tiles - you can see big shapes but not fine detail. The resolution limit is simply: how small can your tiles be before two adjacent tiles just start to look like one big tile?
i didn't understand
Let's Start From Zero 🎯
Imagine you are looking at two stars in the night sky
Now let's go inside the eye
The Phone Screen Analogy
So what is the "resolution limit"?
What is the actual size?
But wait - why can't the lens make a perfect sharp dot?
- Your brain expects to see a perfect dot
- But on the retina, there is actually a small blur circle, not a dot
- You get TWO blur circles on the retina
- If those blur circles OVERLAP completely → looks like ONE thing
- If they are separate enough → looks like TWO things
The "just barely separate" distance
What does "1 minute of arc" feel like?
How does this connect to the Snellen chart?
- If your eye can resolve 1 minute of arc → you can read 6/6 → normal vision
- If you need things to be BIGGER (more than 1 minute) to see them → worse vision (6/12, 6/24, etc.)
- If you can resolve things SMALLER than 1 minute → better than normal (6/5, 6/4)
The simple picture in your head
TWO DOTS IN THE WORLD
        ↓
Light enters your eye
        ↓
Lens focuses them onto the retina
        ↓
Two blur circles land on the retina
        ↓
Are they landing on DIFFERENT cones with a GAP between?
        ↓
     YES → You see TWO dots ✓
     NO  → You see ONE dot ✗
                ↓
        Resolution limit reached
One-line summary
The resolution limit of the eye is the minimum distance two things need to be apart in the world (1 minute of arc) so that their images land on two SEPARATE cones on your retina, with at least one empty cone between them, so your brain registers them as TWO, not ONE.
you explain about optical aberration, optical diffraction, photoreceptor density and neural factors
The 4 Limits of Eye Resolution
FACTOR 1: OPTICAL DIFFRACTION
What is it?
- Put your hand near a wall with a tiny crack of light coming through
- The light does not stay as a perfect thin line - it spreads and fans out slightly on the other side
- This spreading = diffraction
How does this affect your eye?
- Even if you look at a perfect single point of light (like a distant star)
- Even if your lens is absolutely perfect
- The image on your retina is NOT a perfect sharp dot
- It is a small blur circle called the Airy disc
The Airy disc
- A bright central spot (most of the light is here)
- Surrounded by faint dimmer rings around it
The bottom line on diffraction:
Diffraction is the reason why the BEST possible image on your retina is still a tiny blur - not a perfect dot. You cannot defeat diffraction. It is a fundamental law of physics. The smallest possible blur circle in the human eye (with a perfect lens) is ~11 µm.
FACTOR 2: OPTICAL ABERRATIONS
What is "aberration"?
In your eye - the same problem
- The cornea (does ~70% of the focusing)
- The lens (does ~30%)
Type A: Lower-order aberrations (simple refractive errors)
- The eye is slightly too long OR the cornea/lens is too curved
- Light from distant objects focuses IN FRONT of the retina (before it reaches the back wall)
- By the time light hits the retina = blurred circle
- Eye is too short OR cornea/lens not curved enough
- Light focuses BEHIND the retina
- On the retina = blurred circle again
- The cornea is not perfectly round (like a football) - it is slightly oval (like a rugby ball)
- Different meridians have different curvatures
- Vertical rays focus at a different point than horizontal rays
- Result: a single dot appears as a line or smear, not a dot
Type B: Higher-order aberrations
- Some people have glare/halos around lights at night even with perfect glasses
- Night vision is worse than day vision (at night the pupil dilates → more aberrations from the lens edge come into play)
- Post-LASIK patients sometimes complain of poor quality vision despite 6/6 acuity
Aberrations vs Diffraction - the tradeoff
- Diffraction is WORSE with a small pupil (small hole → more spreading)
- Aberrations are WORSE with a large pupil (more of the imperfect lens edge is used → more distortion)
- A pinhole (very small) → reduces aberrations dramatically but increases diffraction → but net effect is sharper for most refractive errors
- In bright sunlight (pupil constricts to ~2 mm) → less aberrations, slightly more diffraction → clear sharp vision
- In darkness (pupil dilates to ~8 mm) → less diffraction but FAR more aberrations → blurrier vision even for someone with no refractive error
FACTOR 3: PHOTORECEPTOR DENSITY
The pixel concept again
At the fovea (centre)
- Extremely densely packed (~150,000 cones per mm²)
- Each cone is only ~1.5 micrometres wide
- Like an iPhone screen with 460 pixels per inch - incredibly fine
Moving away from the fovea
- Cones become progressively fewer and further apart
- The "pixel size" increases
- A single "pixel" now covers a much larger area of the visual world
- You can read fine print when looking directly at it (fovea on it)
- You cannot read the same print in your peripheral vision even though you know it is there
- The "resolution" of the peripheral retina is simply too coarse to distinguish individual letters
But what about rods?
- Bigger than foveal cones
- More widely spaced
- Wired in groups (many rods → one nerve fibre)
FACTOR 4: NEURAL FACTORS
This is the often-forgotten limit
- ✓ Diffraction is minimised
- ✓ Optical aberrations are corrected (perfect glasses)
- ✓ Photoreceptors are perfectly densely packed
Level 1: Convergence - the wiring pattern
- 1 cone → 1 bipolar cell → 1 ganglion cell (nerve fibre)
- This is called private-line wiring
- Each cone has its own dedicated wire to the brain
- So if cone A fires and cone B does not → the brain knows EXACTLY which tiny location was stimulated → HIGH resolution
- 100-200 rods/cones → 1 bipolar → 1 ganglion cell
- Many photoreceptors share ONE wire
- If any one of those 100 photoreceptors fires → the brain gets the same signal
- The brain cannot tell WHICH of those 100 photoreceptors was stimulated
- It only knows: "something happened somewhere in this region" → LOW resolution
- Fovea: You have 100 separate phone lines - one for each house on the street. A call comes in on line 47 → you know exactly which house
- Periphery: All 100 houses share ONE phone line. A call comes in → you know SOMEONE called, but not who
Level 2: Lateral inhibition (sharpening the image)
Level 3: The optic nerve - the cable
- Fewer fibres → less information reaching the brain
- Resolution and contrast sensitivity drop even though the retina itself is fine
- This is exactly what happens in optic neuritis, glaucoma, compressive optic neuropathy
Level 4: The visual cortex - the processing unit
- V1 does basic edge and orientation detection
- Higher areas (V2, V3, V4, V5) process colour, depth, motion
- If the cortex is damaged (stroke, tumour) → vision can be impaired even with a perfectly healthy eye and optic nerve
- This is called cortical visual impairment - the camera is perfect but the computer processing is broken
Putting All 4 Together - A Simple Story
| Limit | Camera equivalent |
|---|---|
| Optical diffraction | Light spreads when passing through the camera's aperture - even perfect lens makes tiny blur |
| Optical aberrations | The lens has tiny imperfections - rays from the edge focus differently from centre rays |
| Photoreceptor density | The camera sensor's pixel size - too few pixels = cannot capture fine detail |
| Neural factors | The cable, the image processor, and the computer screen - even a perfect sensor is useless if the data is lost or corrupted before being displayed |
Final Summary - One sentence per factor
- Diffraction: Light is a wave - it ALWAYS spreads slightly through any small hole → creates unavoidable blur circle on retina (~11 µm)
- Aberrations: Your cornea and lens are not optically perfect → edges of lens focus light at slightly wrong points → adds to blur (correctable with glasses for simple refractive errors)
- Photoreceptor density: Your cones are the pixels - they can only detect detail as fine as their own spacing (~1.5 µm in fovea) → things smaller than one cone cannot be distinguished
- Neural factors: The wiring (1:1 at fovea vs 100:1 in periphery), the nerve cable (optic nerve), and the brain processing (visual cortex) - damage or poor wiring at any stage loses the fine detail that the retina faithfully captured
explain how each limit affects common eye conditions
How Each Resolution Limit Affects Common Eye Conditions
Quick Recap - The 4 Limits
| Limit | The problem it creates |
|---|---|
| Diffraction | Light waves spread → unavoidable blur circle on retina |
| Optical aberrations | Imperfect lens/cornea → rays don't all meet at one point |
| Photoreceptor density | Too few/damaged pixels → fine detail not captured |
| Neural factors | Damaged wiring/brain → captured detail never reaches brain |
OPTICAL ABERRATIONS - The Diseases That Break This Limit
1. MYOPIA (Short-sightedness)
What is happening inside the eye?
What lands on the retina?
Why near vision is fine?
How glasses/contact lenses fix it?
Pinhole test result?
2. HYPERMETROPIA (Long-sightedness / Hyperopia)
What is happening?
Why young people can compensate (and why it matters)
As we age (Presbyopia):
3. ASTIGMATISM
The most visual of the refractive errors
What this means for focus:
- Vertical rays (passing through the steeper meridian) → focus at one distance (say, 5 cm in front of retina)
- Horizontal rays (passing through the flatter meridian) → focus at a different distance (say, 2 cm in front of retina)
What the patient sees:
Why it causes more than just blur:
- Significant eyestrain and headaches (especially during sustained reading)
- Squinting (partially corrects astigmatism by using only part of the cornea)
- Tilting the head to bring the better meridian into alignment
4. KERATOCONUS - When Aberrations Become Extreme
What goes wrong with aberrations?
- The cone-shaped cornea creates massive higher-order aberrations - especially coma (where a point of light looks like a comet with a tail)
- Glasses can correct the simple sphero-cylindrical component but cannot fix the irregular higher-order aberrations
- Snellen VA is often poor, but a rigid contact lens vaults over the irregular cornea and creates a new, smooth refracting surface → dramatically improves VA
5. POSTERIOR SUBCAPSULAR CATARACT (PSC) - Aberrations + Diffraction Combined
Where is the opacity?
Two ways it damages resolution:
Why PSC causes disproportionate glare
Pinhole in PSC:
PHOTORECEPTOR DENSITY - The Diseases That Break This Limit
6. AGE-RELATED MACULAR DEGENERATION (AMD)
The target: the fovea itself
How it happens (two types):
- Drusen (deposits of cellular debris) accumulate under the RPE
- The RPE cells die → the cones they support lose their metabolic support → cones die
- The foveal pixel density falls → resolution limit worsens
- Slow progression over years
- Patient notices: words are missing from the middle of sentences, faces look distorted or have a blank spot in the centre
- Abnormal blood vessels grow under the retina (choroidal neovascularisation/CNVM)
- These vessels are leaky → fluid floods under/into the retina → physically displaces the foveal cones
- Cones are pushed out of position → their spatial mapping is disrupted → patient sees metamorphopsia (straight lines appear wavy) - the AMSLER GRID TEST directly detects this
- These vessels can bleed → blood under the fovea → sudden severe loss of central vision
What the resolution limit chart looks like for AMD:
- Central VA (6/X) is severely reduced
- Peripheral vision is preserved (peripheral rods/cones are not affected in early/moderate AMD)
- Patient cannot recognise faces but can walk around without bumping into things
- The blur is NOT correctable with glasses (it is not an aberrational problem - the pixels themselves are dead)
- Pinhole does NOT help (same reason - the receptor density limit is broken, not the optical limit)
7. RETINITIS PIGMENTOSA (RP)
The opposite problem to AMD - peripheral pixels die first
How pixel density breaks down:
- Peripheral rods die → peripheral vision lost (like looking through a tunnel)
- The patient classically has tunnel vision - can see fine detail centrally (foveal cones intact) but cannot see anything in the periphery
- Night vision fails early (rods are for night vision)
- As the disease progresses, the degeneration reaches the macula → central cones die too → total blindness
The progression through the resolution limits:
- Peripheral photoreceptor density lost → peripheral field loss
- Central acuity preserved (6/6 or near) because foveal cones are intact
- Night blindness (nocturia - needs light to see in dim environments)
- Macular cones die → central acuity falls
- Ophthalmoscopy shows: bone-spicule pigmentation, attenuated vessels, waxy disc pallor
- ERG (electroretinogram) is the definitive test - measures electrical response of photoreceptors directly
What the Amsler grid and visual field testing show:
- Amsler: missing corners/borders (peripheral/paracentral field defects - NOT metamorphopsia because the retina is not physically distorted, just losing photoreceptors)
- Visual field: ring scotoma progressing to tunnel vision
NEURAL FACTORS - The Diseases That Break This Limit
8. GLAUCOMA - The Quiet Neural Thief
What is glaucoma?
The resolution limit that breaks:
- The affected retinal areas lose their output wire to the brain
- The brain receives no signal from those areas → scotomas (blind spots) in the visual field
- The patient cannot see anything in those regions - not because there are no photoreceptors, but because the signal never reaches the brain
Why VA is preserved until late:
- Central VA is 6/6 (foveal fibres intact)
- Visual field has defects in the peripheral/arcuate regions
- Patient does not notice the field loss because the other eye fills in the gap (binocular vision)
The clinical tests that catch this early:
- Visual field testing (HFA): The most important - measures sensitivity at each point. Detects scotomas corresponding to dead ganglion cell zones before the patient notices
- OCT (optical coherence tomography): Measures the retinal nerve fibre layer (RNFL) thickness. Thinning of the RNFL detects ganglion cell loss even before a field defect appears
- Optic disc assessment: Increased cup:disc ratio, disc haemorrhages
Can glasses fix glaucoma's VA loss?
9. OPTIC NEURITIS - The Demyelinating Neural Limit
What happens?
- Nerve conduction velocity drops dramatically (from ~70 m/s to <5 m/s)
- Action potentials become unreliable - some fail to propagate at all
- The signal arriving at the visual cortex is weaker, slower, and less organised
The specific resolution limits broken:
- Fewer signals arrive at the cortex per unit time → the cortex receives a degraded "low-resolution" representation of the visual world
- VA drops (often to 6/60 or worse in acute attack)
- Colour vision drops severely (red-green desaturation - the red object looks washed out or brownish)
- Contrast sensitivity drops disproportionately - even after VA recovers to 6/6 after an episode, contrast sensitivity often remains impaired because the M-cell fibres (which carry low-contrast signals) are particularly vulnerable
The famous recovery paradox (Uhthoff's phenomenon):
10. AMBLYOPIA (Lazy Eye) - The Cortical Neural Limit
This is the most purely "neural factor" condition of all
How does it develop?
- Strabismus: One eye turns in/out → the images from the two eyes cannot be fused → the brain suppresses the misaligned eye's image to avoid double vision → the connections for that eye never develop properly
- Anisometropia: One eye is much more short/long-sighted than the other → one eye always sends a blurrer image → brain preferentially uses the sharper eye and ignores the blurrier one
- Monocular deprivation: A cataract or ptosis blocks vision in one eye entirely during the critical period → that eye's cortical connections don't form at all (most severe form)
What happens in the brain:
- Fewer in number
- Less organised spatially
- Unable to perform fine pattern discrimination
Why the eye "looks normal" but cannot see:
Why treatment must be early:
The pinhole paradox in amblyopia:
- Pinhole VA in amblyopia is often only marginally better (unlike simple refractive error where it improves greatly)
- This is because the problem is neural (cortex), not optical → clearing up the optics does not fix the cortical processing deficit
THE MASTER TABLE - All Conditions Side by Side
| Condition | Which limit breaks? | The problem | Correctable with glasses? | Pinhole helps? |
|---|---|---|---|---|
| Myopia | Optical aberration | Eye too long → blur circle in front of retina | ✅ Yes (concave lens) | ✅ Yes |
| Hypermetropia | Optical aberration | Eye too short → blur circle behind retina | ✅ Yes (convex lens) | ✅ Yes |
| Astigmatism | Optical aberration | Oval cornea → two different focal points | ✅ Yes (cylinder lens) | ✅ Partially |
| Keratoconus | Optical aberration (extreme) | Irregular cornea → massive higher-order aberrations | ❌ Not with glasses | ✅ Yes (rigid lens best) |
| Cataract (PSC) | Optical aberration + diffraction-like scatter | Lens opacity → scatter + aberrations | ❌ Not correctable | ❌ Makes it WORSE |
| Macular degeneration (dry) | Photoreceptor density | Foveal cones die → central pixels lost | ❌ No | ❌ No |
| Macular degeneration (wet) | Photoreceptor density | Fluid displaces foveal cones → spatial distortion | ❌ No | ❌ No |
| Retinitis pigmentosa | Photoreceptor density | Peripheral rods die first → tunnel vision | ❌ No | ❌ No |
| Glaucoma | Neural (convergence/wiring) | Ganglion cells die → optic nerve fibres lost | ❌ No | ❌ No |
| Optic neuritis | Neural (conduction) | Demyelination → slow/failed signal transmission | ❌ No | ❌ No |
| Amblyopia | Neural (cortical) | Cortex never wired properly → brain cannot process | ❌ No | ❌ Minimal |
The One Test That Tells You Which Limit Is Broken
- ✅ Yes significantly → Optical aberration (refractive error) - the problem is in the optics, correctable
- ❌ No improvement (or worse) → Photoreceptor or neural - the problem is beyond the optics, not correctable with lenses