10 ecg common disease with changes and explnation and graph
Reading File
Finding Sources
Finding Sources
Finding Sources
Finding Sources
Finding Sources
Finding Sources
Loading Image
Finding Sources
Finding Sources
Loading Image
Finding Sources
Loading Image
Searching the Web
10 common ECG patterns diseases changes explained STEMI atrial fibrillation SVT VT hyperkalemia
I now have rich textbook content and real ECG images. Let me compile a thorough, illustrated guide.
10 Common Diseases with ECG Changes - Explained with Graphs
Below is a complete guide to the 10 most important ECG patterns you need to recognize, sourced from Harrison's, Braunwald's Heart Disease, Goldman-Cecil Medicine, Rosen's Emergency Medicine, and Guyton & Hall Physiology.
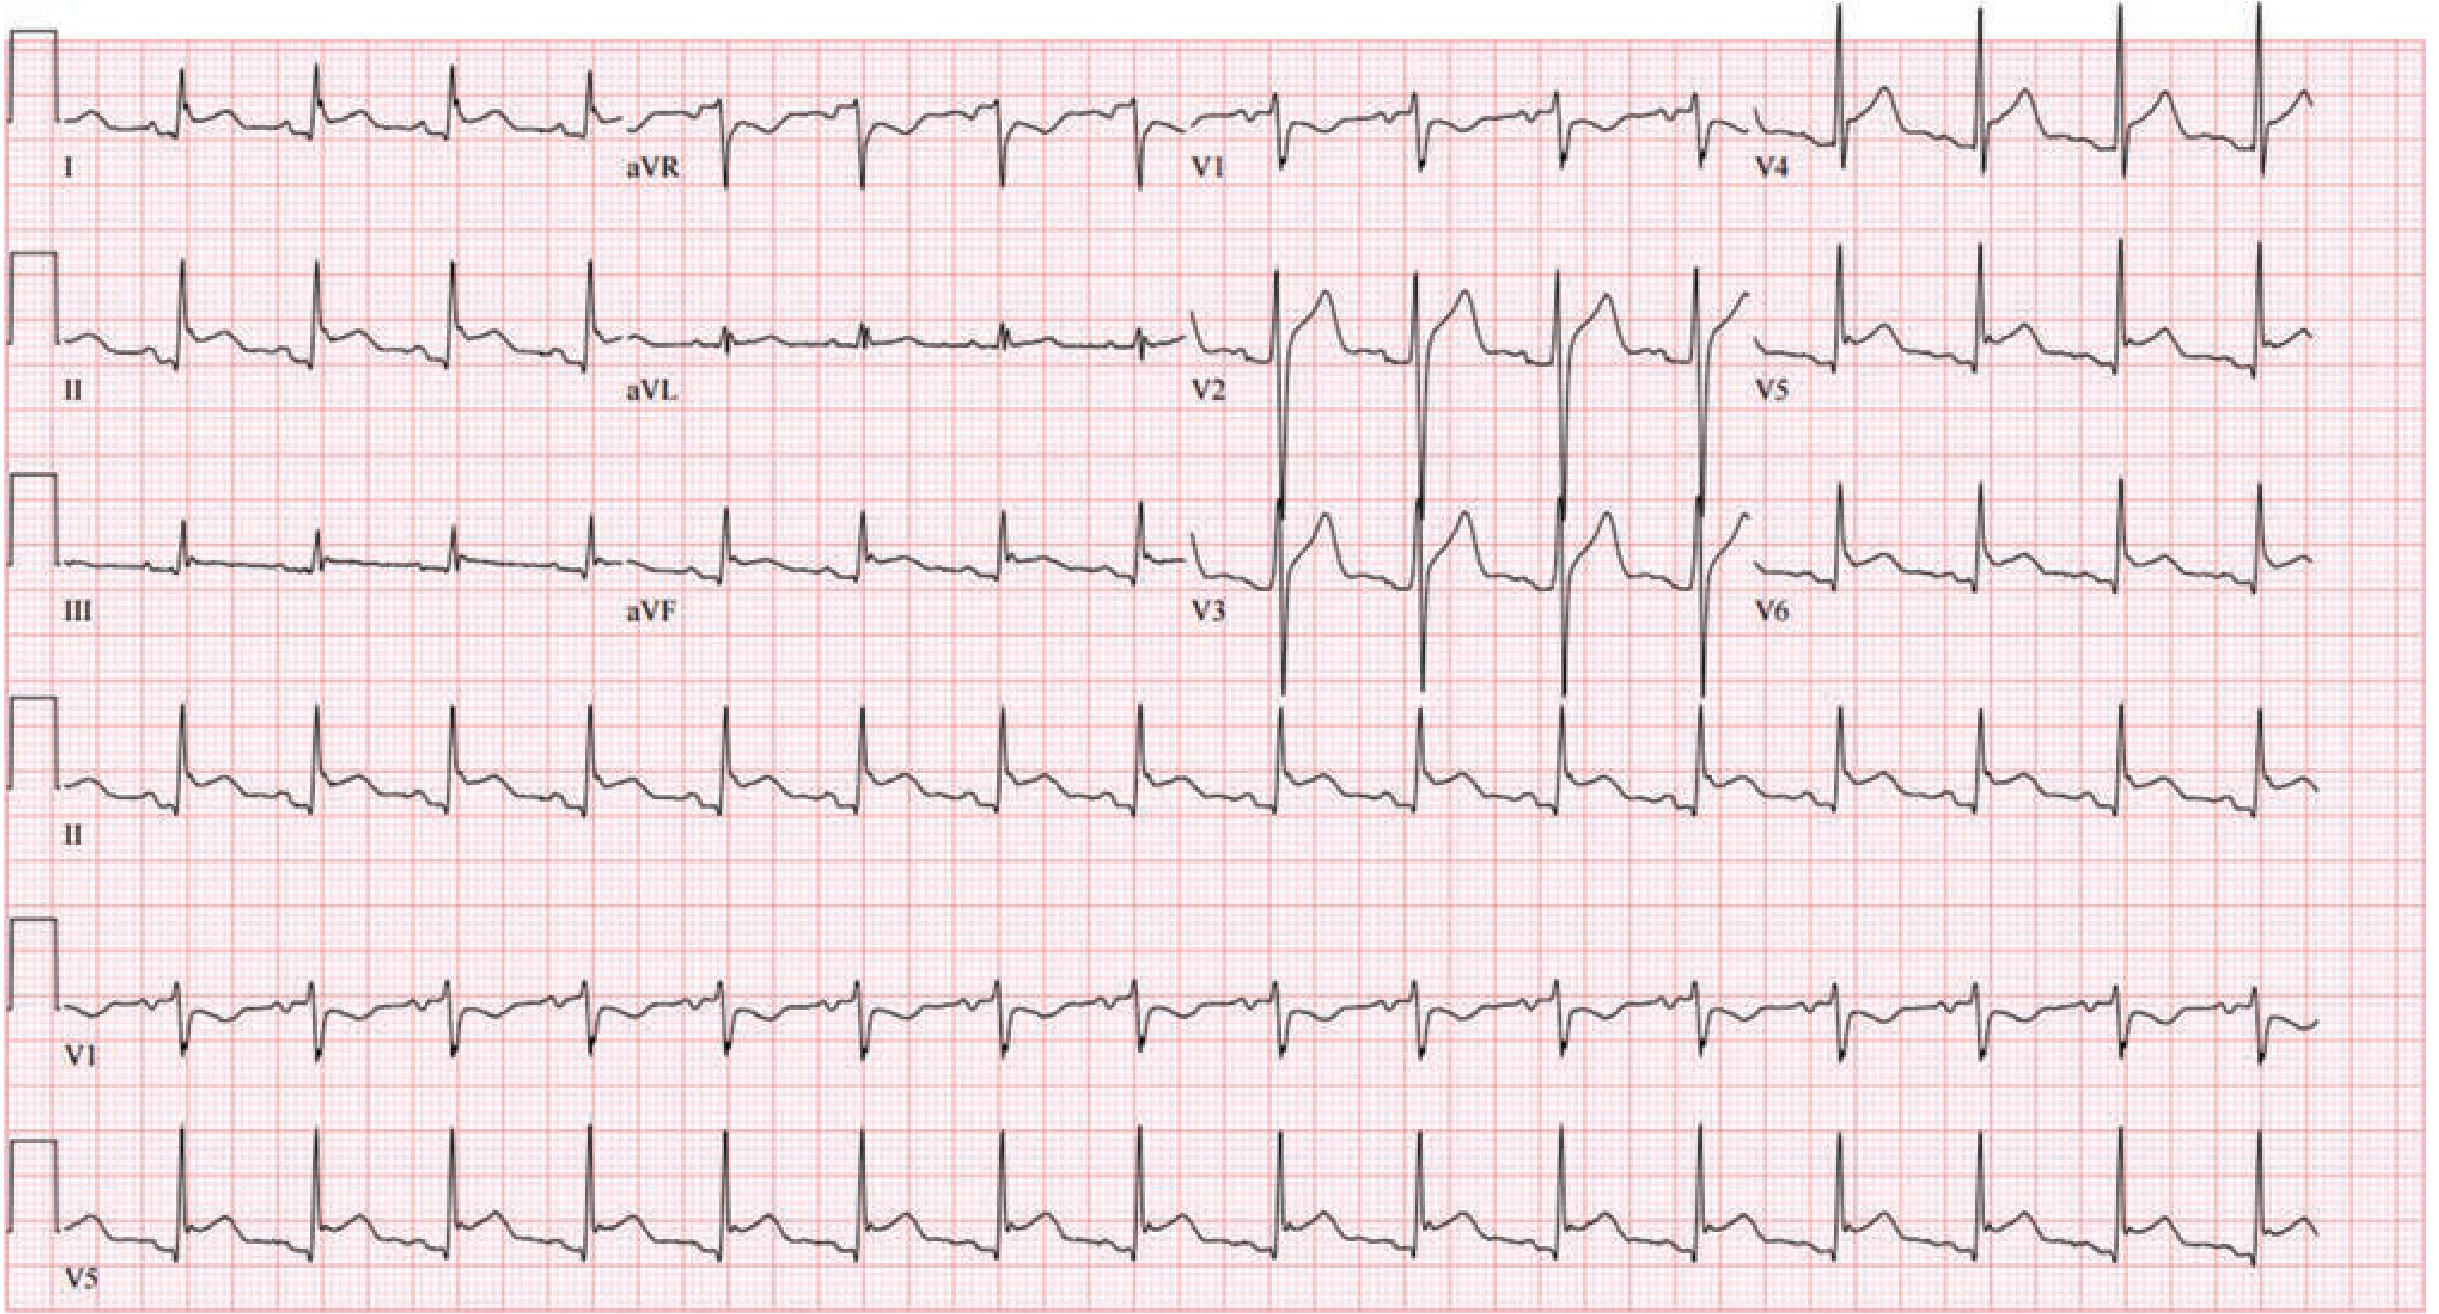
1. ST-Elevation Myocardial Infarction (STEMI)
ECG Changes:
- ST elevation ≥1 mm in two or more contiguous leads (the hallmark finding)
- Reciprocal ST depression in opposite leads
- Hyperacute T waves (tall, broad, symmetric) - earliest change
- Q waves develop within hours (pathological Q = >1 mm wide or >25% of R height)
- T wave inversion follows in the evolving phase
Lead Localization:
| Territory | Culprit Artery | ST Elevation Leads |
|---|---|---|
| Anterior | LAD | V1-V4 |
| Inferior | RCA | II, III, aVF |
| Lateral | LCx | I, aVL, V5-V6 |
| Posterior | RCA/LCx | ST depression V1-V3 (mirror image) |
Explanation: Complete occlusion of a coronary artery causes transmural ischemia. The injured epicardial myocardium generates a current of injury that shifts the ST segment upward. As cells die, the Q wave appears because dead tissue produces no electrical signal - the vector "falls through" to the opposite wall.
Goldman-Cecil Medicine: "If the involved coronary artery is completely occluded by fresh thrombus, the patient's ECG shows ST segment elevation. If it is partially occluded, the ECG does not show ST elevation." - Goldman-Cecil Medicine
2. Atrial Fibrillation (AF)
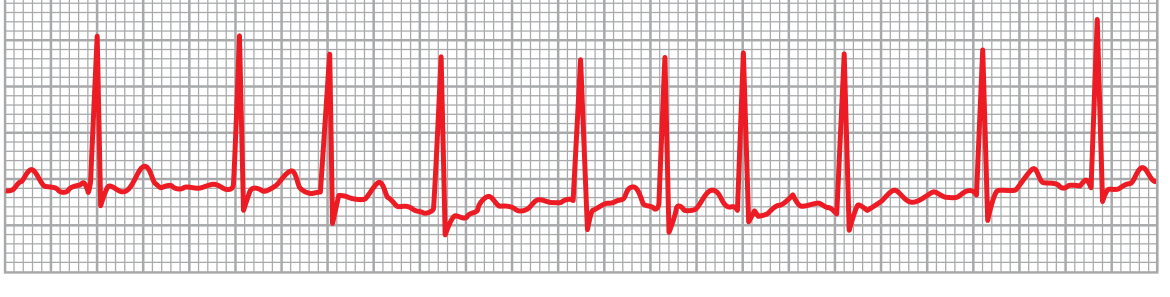
ECG Changes:
- No identifiable P waves - replaced by chaotic fibrillatory (f) waves at 350-600/min
- Irregularly irregular RR intervals (this is pathognomonic - no two RR intervals are the same)
- Narrow QRS complex (unless aberrant conduction or bundle branch block)
- Ventricular rate typically 100-180/min if uncontrolled
Explanation: Multiple re-entrant circuits fire chaotically throughout both atria. The AV node acts as a gatekeeper, conducting impulses irregularly to the ventricles. Because no organized atrial depolarization occurs, no P wave forms. The result is an irregularly irregular rhythm - the most reliable feature.
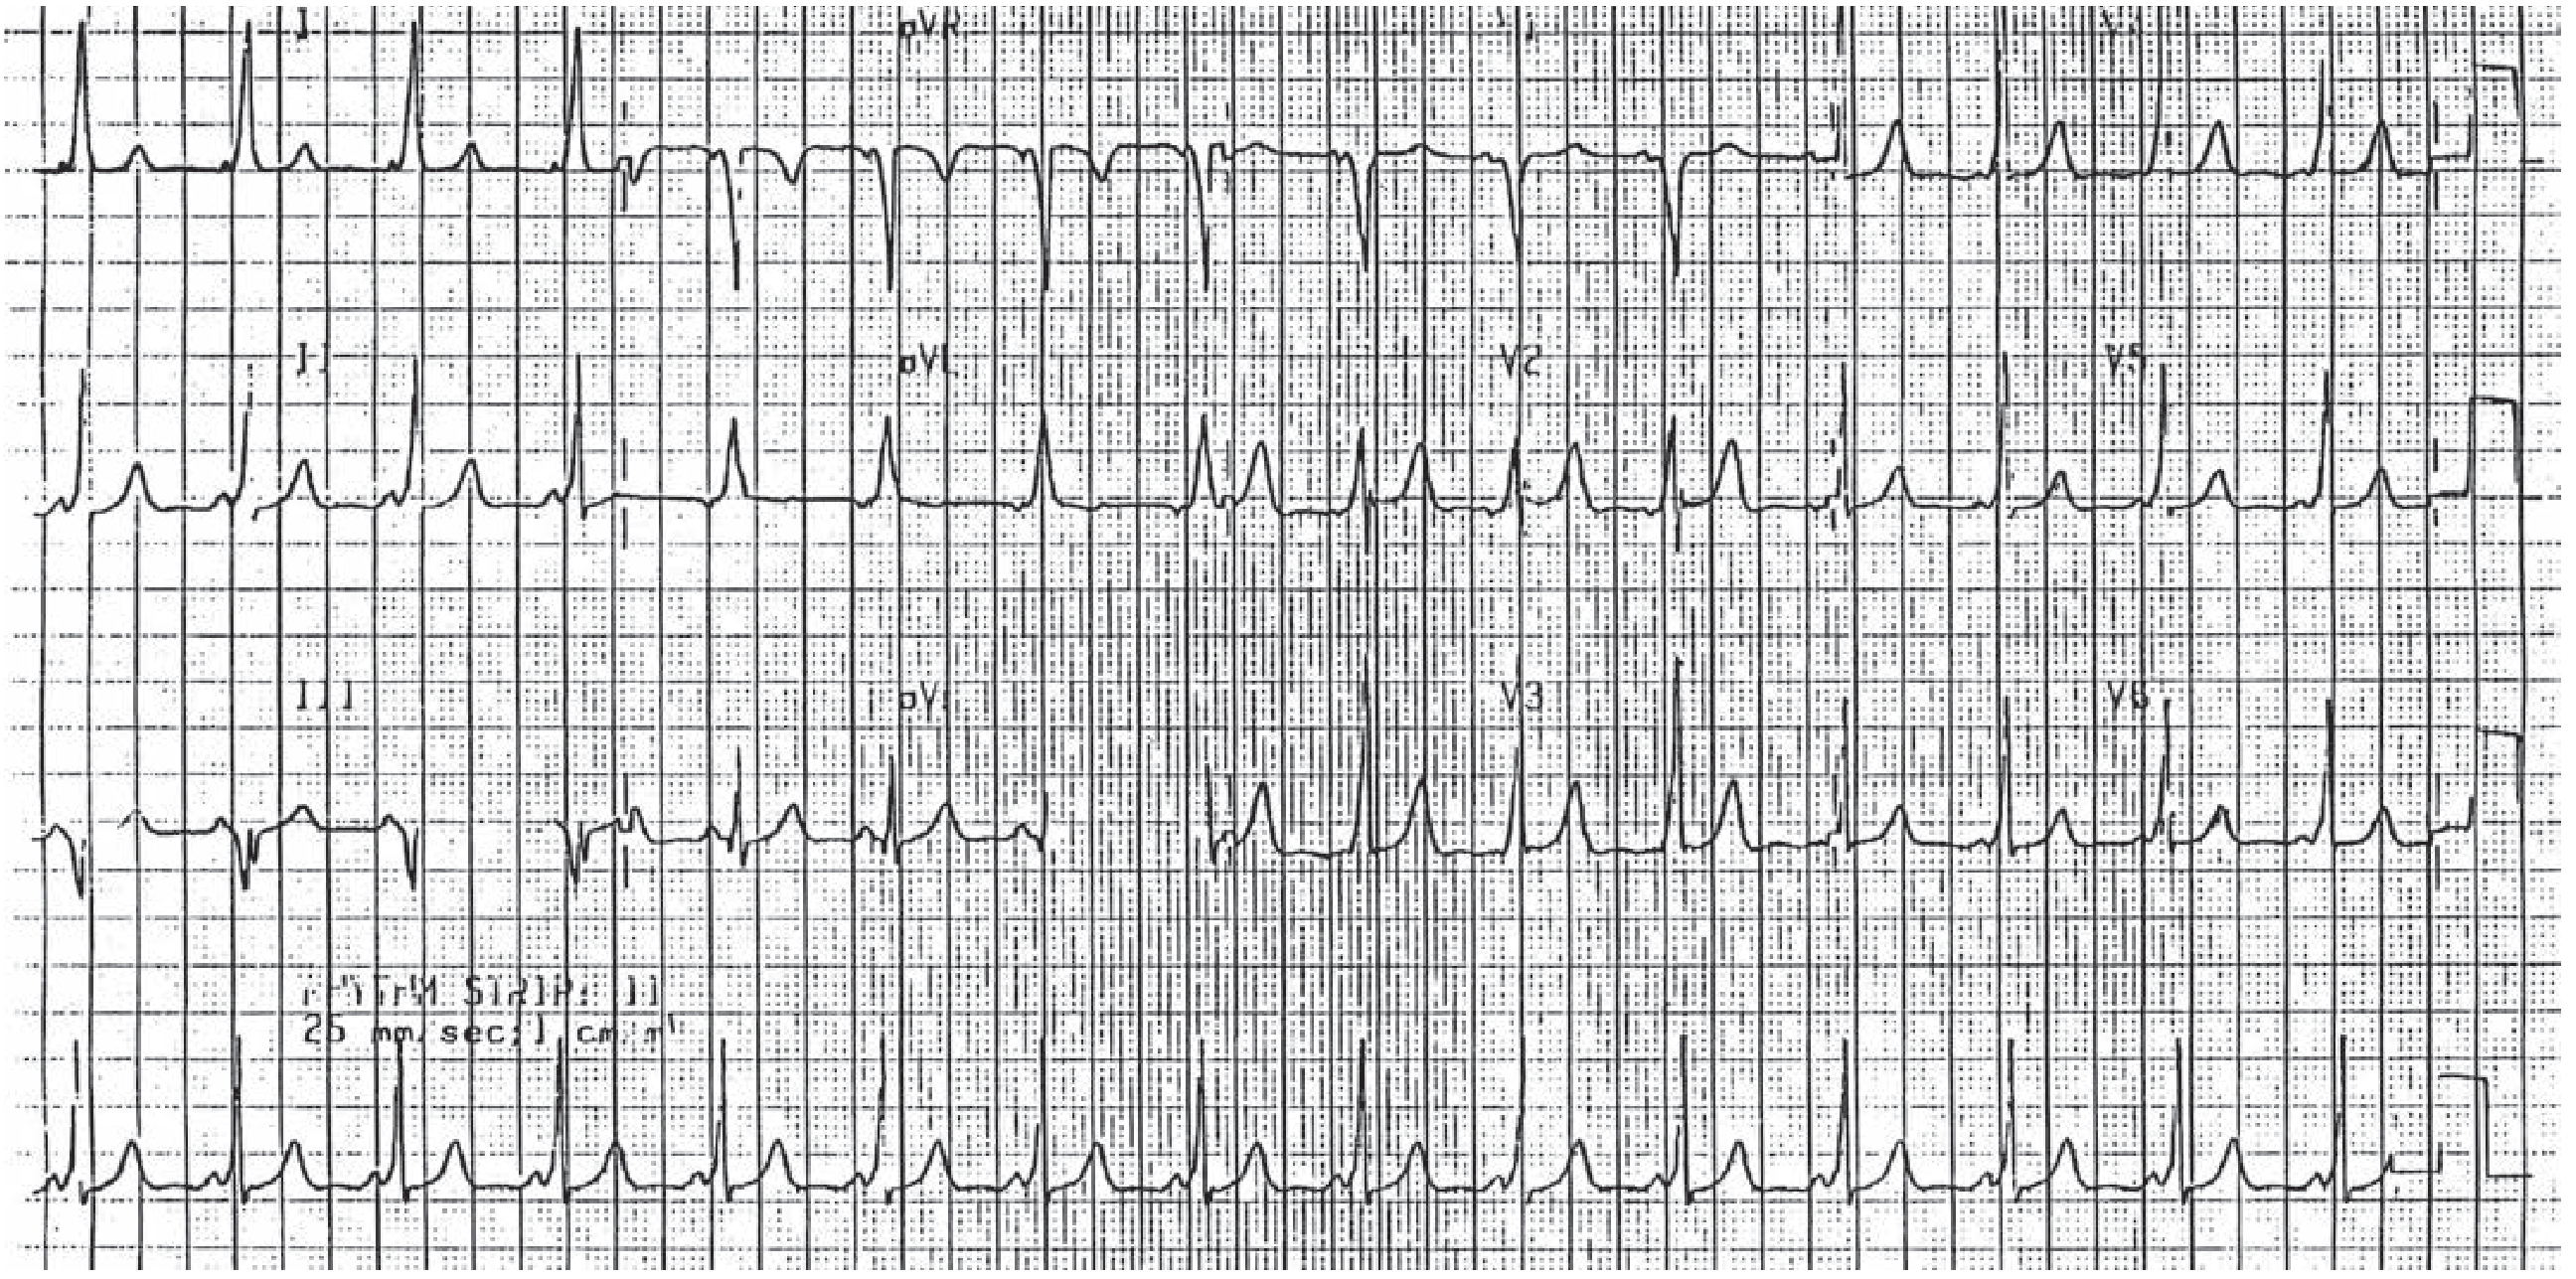
3. Acute Pericarditis
ECG Changes (4 Stages):
- Stage 1: Diffuse concave ("saddle-shaped") ST elevation in ALL leads EXCEPT aVR and V1 + PR depression (highly specific for pericarditis)
- Stage 2: ST and PR segments normalize
- Stage 3: Diffuse T wave inversion
- Stage 4: ECG returns to normal
Key Distinguishing Features from STEMI:
- ST elevation is diffuse (not localized to a coronary territory)
- ST morphology is concave upward (saddle-shaped), not convex
- PR segment depression present in most leads
- No reciprocal changes (except aVR which shows ST depression)
- No pathological Q waves develop
Explanation: Inflammation of the pericardium extends to the superficial myocardium (myopericarditis), injuring the epicardial layer diffusely. This causes widespread current of injury (ST elevation) without the coronary territory pattern of MI. PR depression reflects atrial epicardial involvement.
Braunwald's Heart Disease: "Typical ECG evolution follows four stages: (1) PR depression and/or diffuse ST segment elevation, (2) normalization of ST segment, (3) T wave inversion with or without ST segment depression, and (4) normalization."
4. Hyperkalemia
ECG Changes (progressive with rising K+):
| Serum K+ | ECG Finding |
|---|---|
| 5.5-6.5 mEq/L | Tall, peaked, symmetric T waves + shortened QT |
| 6.5-7.5 mEq/L | PR prolongation, P wave flattening/disappearance |
| 7.0-8.0 mEq/L | Wide QRS (>0.12 sec), sine wave pattern |
| >8.0 mEq/L | Ventricular fibrillation or asystole |
Explanation: High extracellular K+ depolarizes the resting membrane potential, slowing phase 0 depolarization (fast Na+ channels). This slows conduction through all cardiac tissue: first the atria lose P waves, then the His-Purkinje system widens the QRS, and the T wave becomes peaked because repolarization is accelerated. The sine wave pattern just before cardiac arrest represents merged P-QRS-T complexes.
Harrison's Principles (2025): "Classically, the ECG manifestations in hyperkalemia progress from tall peaked T waves (5.5-6.5 mM), to a loss of P waves (6.5-7.5 mM), to a widened QRS complex (7.0-8.0 mM), and ultimately..." to fatal arrhythmia.
5. Wolff-Parkinson-White (WPW) Syndrome
ECG Triad During Sinus Rhythm:
- Short PR interval (<0.12 sec) - because the accessory pathway bypasses the AV node delay
- Delta wave - slurred, slow upstroke at the beginning of the QRS (pre-excitation of ventricle via accessory pathway)
- Wide QRS (>0.12 sec) - due to abnormal ventricular activation combining delta wave + normal AV conduction
During Atrial Fibrillation in WPW - DANGER:
- No P waves, wide bizarre QRS complexes with varying morphology
- Ventricular rate usually >200/min (life-threatening)
- Do NOT give AV nodal blockers (digoxin, verapamil, adenosine) - they block normal conduction and force all impulses down the accessory pathway
Explanation: An accessory bypass tract (Bundle of Kent) connects atria directly to ventricles, bypassing the AV node. Impulses arrive at the ventricles early (pre-excitation), creating the delta wave. This pathway can also conduct retrogradely, creating a re-entry circuit for SVT.
6. Left Bundle Branch Block (LBBB)
ECG Changes:
- Wide QRS (≥0.12 sec / 3 small squares)
- Broad, notched, monophasic R wave in lateral leads (I, aVL, V5-V6) - the classic "M" or "W" shape
- Deep S wave or rS pattern in V1 (broad R then deep S, or just deep QS)
- ST and T changes discordant (opposite to QRS direction) - this is normal in LBBB
- Leads I, V5-V6: No Q waves (septal q waves are lost)
Explanation: Block of the left bundle branch forces the left ventricle to depolarize late, via cell-to-cell conduction from the right side. This slow, abnormal spread widens the QRS and changes its morphology. ST-T changes are secondary (discordant to QRS) and do NOT necessarily indicate ischemia.
Clinical Pearl: New LBBB in the context of chest pain may be a STEMI equivalent and requires urgent management.
7. Ventricular Tachycardia (VT)
ECG Changes:
- Wide QRS tachycardia (QRS ≥0.12 sec, rate 100-250/min)
- AV dissociation (P waves and QRS complexes marching independently) - diagnostic of VT when present
- Fusion beats and capture beats (hallmarks of AV dissociation)
- Concordance in precordial leads (all positive or all negative - no transition)
- Northwest axis (extreme axis deviation, "no man's land")
- QRS morphology does not match typical LBBB or RBBB pattern
Key Rule (Brugada Criteria): If any doubt, treat wide complex tachycardia as VT until proven otherwise. VT is far more common than SVT with aberrancy in adults with structural heart disease.
Explanation: A ventricular focus fires rapidly, driving the heart. Because impulses travel via slow myocardium rather than the His-Purkinje system, the QRS is wide and bizarre. AV dissociation occurs because the SA node fires independently from the VT focus, and P waves are buried or visible between wide QRS complexes.
8. Pulmonary Embolism (PE)
ECG Changes:
- Sinus tachycardia - most common finding (seen in ~44% of PE)
- S1Q3T3 pattern - S wave in lead I, Q wave AND T-wave inversion in lead III (classic but present in only ~20%)
- Right bundle branch block (new RBBB) - due to acute right heart strain
- T wave inversions in V1-V4 (right heart strain pattern)
- Right axis deviation
- P pulmonale (tall P wave in II) from right atrial enlargement
- Atrial fibrillation (in ~10%)
Explanation: Massive PE causes acute obstruction of the pulmonary vasculature, leading to acute right ventricular pressure overload. The dilated, strained RV shifts the heart's electrical axis rightward. The S1Q3T3 pattern reflects this acute cor pulmonale - the QRS axis rotates clockwise when the RV enlarges acutely.
9. Complete Heart Block (Third-Degree AV Block)
ECG Changes:
- P waves and QRS complexes march independently (AV dissociation)
- PP intervals regular, RR intervals regular, but no fixed relationship between them
- PR interval varies with each beat (key finding)
- Escape rhythm QRS: narrow if junctional escape (rate 40-60/min), wide if ventricular escape (rate 20-40/min)
- Bradycardia (ventricular rate 20-60/min)
Explanation: No impulse from the atria can reach the ventricles. The AV node or bundle of His is completely blocked. A subsidiary pacemaker below the block takes over - if junctional, the QRS is narrow; if below the bifurcation of the bundle of His, the QRS is wide and the rate is very slow (30-40/min). This is a medical emergency requiring pacing.
10. Hypokalemia
ECG Changes (progressive with falling K+):
| Serum K+ | ECG Finding |
|---|---|
| 3.0-3.5 mEq/L | Flattened T waves, U waves become prominent |
| 2.5-3.0 mEq/L | T-U fusion, apparent QT prolongation (actually QU) |
| <2.5 mEq/L | ST depression, very prominent U waves (>T wave height) |
| Severe | Torsades de pointes, ventricular fibrillation |
The U Wave: Positive deflection after the T wave, best seen in V2-V3. Normally small; in hypokalemia it becomes >1 mm or taller than the T wave. It represents delayed repolarization of the Purkinje fibers or papillary muscles.
Explanation: Low K+ hyperpolarizes the resting membrane potential, prolonging action potential duration and the refractory period. This delays repolarization, causing the characteristic T wave flattening and U wave prominence. The prolonged QTU interval predisposes to early afterdepolarizations and torsades de pointes, especially dangerous with digoxin use.
Quick Reference Summary Table
| # | Disease | Key ECG Feature | Rate | Rhythm |
|---|---|---|---|---|
| 1 | STEMI | ST elevation + Q waves in territory | Normal/fast | Regular |
| 2 | Atrial Fibrillation | No P waves, irregularly irregular | Variable | Irregular |
| 3 | Acute Pericarditis | Diffuse ST elevation + PR depression | Normal | Regular |
| 4 | Hyperkalemia | Peaked T → wide QRS → sine wave | Slow/normal | Can vary |
| 5 | WPW | Short PR + delta wave + wide QRS | Normal | Regular (sinus) |
| 6 | LBBB | Wide QRS, M-shape V5-V6, no Q in lateral | Normal | Regular |
| 7 | Ventricular Tachycardia | Wide QRS tachycardia + AV dissociation | Fast >100 | Regular |
| 8 | Pulmonary Embolism | S1Q3T3, sinus tachycardia, RBBB | Fast | Regular |
| 9 | Complete Heart Block | AV dissociation, fixed slow escape rate | Slow | P/QRS independent |
| 10 | Hypokalemia | Flat T, prominent U waves, ST depression | Normal | Regular (risk of VF) |
Sources: Goldman-Cecil Medicine | Harrison's Principles of Internal Medicine (2025) | Braunwald's Heart Disease | Fuster & Hurst's The Heart, 15th Ed. | Guyton & Hall Medical Physiology | Rosen's Emergency Medicine | Tintinalli's Emergency Medicine
This is a shared conversation. Sign in to Orris to start your own chat.