

Hello I am a MD medicine student kindly prepare answers of these questions as MD medicine university exam mandatory to add diagrams and flowcharts and examples and make good notes
pulmonary function test spirometry flowchart FEV1 FVC interpretation
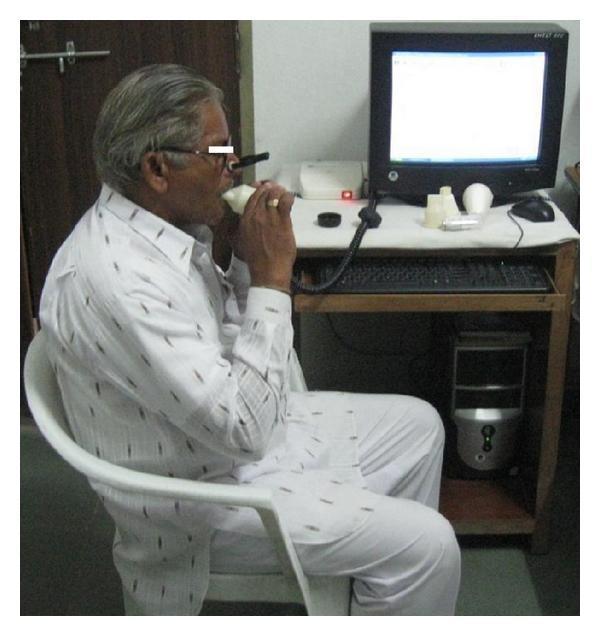
A clinical photograph illustrating a patient performing a Pulmonary Function Test (PFT) via spirometry in a clinical or research setting. The image depicts an older adult male seated upright, wearing a nose clip to ensure mouth-only breathing. He is actively interacting with a handheld spirometer, holding the disposable mouthpiece with both hands to maintain a tight seal. The device is connected via a data cable to a computer system, which includes a monitor displaying an active interface, likely for real-time visualization of flow-volume loops and spirograms. On the desk, several replacement white cylindrical mouthpieces and the hardware interface are visible. This visual serves as an educational example of the standardized setup for measuring lung volumes and ventilation capacities, such as Forced Vital Capacity (FVC) and Forced Expiratory Volume in 1 second (FEV1), highlighting the necessary equipment and proper patient positioning during the procedure.
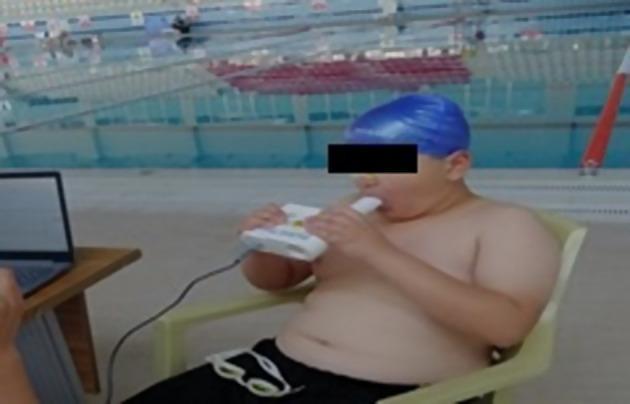
This clinical photograph illustrates the performance of a pulmonary function test, specifically Forced Vital Capacity (FVC) measurement, in an aquatic sports setting. A young male subject, wearing a blue swimming cap and dark shorts, is seated while performing spirometry. He is using a handheld digital spirometer (Pocket Spiro USB-100), gripping the white device with both hands. The subject’s lips are tightly sealed around a disposable cylindrical mouthpiece, and a nose clip is applied to ensure isolated oral expiration. A data cable connects the spirometer to a laptop on a nearby table, indicating real-time data acquisition and flow-volume loop analysis. The background shows a swimming pool environment, suggesting clinical research into the respiratory physiology of swimmers or the impact of aquatic training on lung volumes. This image serves as an educational example of portable spirometry application and proper patient positioning for diagnostic respiratory maneuvers outside a traditional lab setting.

Summary : This flowchart outlines the diagnostic pathway for evaluating patients with symptoms suggestive of exercise-induced bronchoconstriction (EIB) using spirometry and the interpretation of FEV1 values, with subsequent steps based on reversibility to beta2 agonists. flowchart: Nodes : • Start: "Symptoms suggestive of EIB" (text) • "Spirometry" (rectangle) • Decision: "FEV1 < 70%" (diamond) • Decision: "FEV1 ≥ 70%" (diamond) • "Reversible airway obstruction consistent with asthma and high risk of EIB" (rectangle, appears twice) • "*Beta2 agonist reversibility" (annotation, appears twice) • "No Beta2 agonist reversibility" (annotation, appears twice) Connectors : • Arrow from "Symptoms suggestive of EIB" to "Spirometry" • Arrow from "Spirometry" splits to "FEV1 < 70%" and "FEV1 ≥ 70%" • From "FEV1 < 70%": – Arrow to "*Beta2 agonist reversibility" leading to "Reversible airway obstruction consistent with asthma and high risk of EIB" – Arrow to "No Beta2 agonist reversibility" (ends) • From "FEV1 ≥ 70%": – Arrow to "*Beta2 agonist reversibility" leading to "Reversible airway obstruction consistent with asthma and high risk of EIB" – Arrow to "No Beta2 agonist reversibility" (ends) Layout : • Linear top-down flow with a split after spirometry into two branches based on FEV1 value (<70% or ≥70%), each with two possible outcomes (reversibility or not). • Annotations for beta2 agonist reversibility are placed before the final diagnostic node in each branch. Analysis : • The flowchart provides a clear, stepwise approach for diagnosing EIB in patients with suggestive symptoms. • Spirometry is the initial test, with FEV1 value determining the next step. • Both FEV1 < 70% and FEV1 ≥ 70% require assessment of reversibility to beta2 agonists to confirm reversible airway obstruction, consistent with asthma and high risk of EIB. • If there is no reversibility to beta2 agonists, the pathway ends without a diagnosis of reversible airway obstruction.
interstitial lung disease classification HRCT pattern UIP NSIP
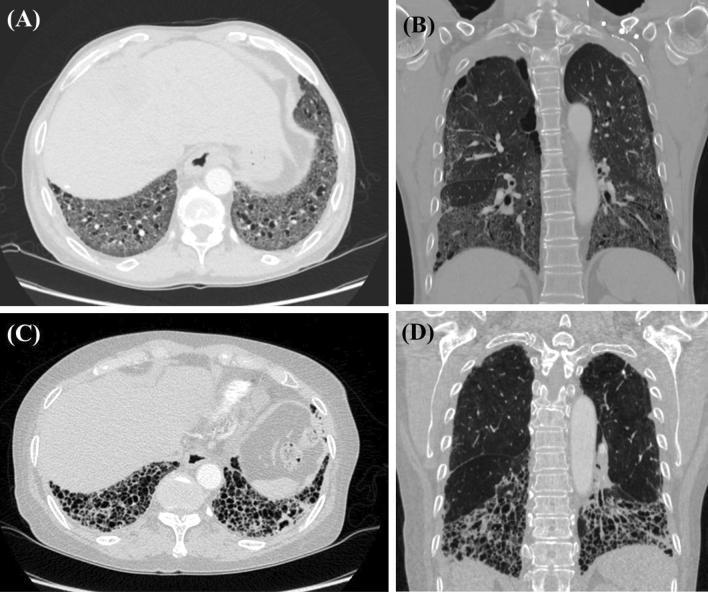
High-resolution computed tomography (HRCT) comparison of interstitial lung disease (ILD) patterns in systemic sclerosis (SSc). Figures A (axial) and B (coronal) display a Non-Specific Interstitial Pneumonia (NSIP) pattern characterized by bilateral, diffuse ground-glass opacities and mild traction bronchiectasis with a distinct basal predominance. Figures C (axial) and D (coronal) demonstrate a Usual Interstitial Pneumonia (UIP) pattern. This pattern is marked by extensive subpleural honeycombing (clusters of cystic airspaces), exuberant traction bronchiectasis, and severe architectural distortion predominantly involving the lower lung zones. These diagnostic images serve to illustrate the distinct radiologic morphology between NSIP and UIP patterns in patients with connective tissue disease-associated ILD, highlighting key features such as distribution, presence of honeycombing, and the degree of fibrotic changes essential for clinical classification and management.
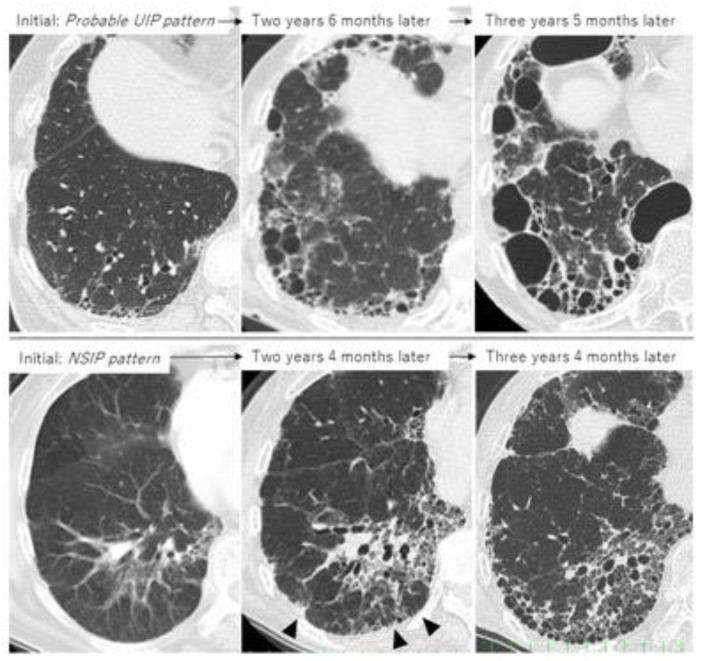
High-resolution computed tomography (HRCT) axial scans of the lung illustrating the progression of Rheumatoid Arthritis-associated Interstitial Lung Disease (RA-ILD) over approximately 3.5 years in two distinct radiographic patterns. The upper row demonstrates a 'Probable Usual Interstitial Pneumonia (UIP)' pattern. Initial scans show baseline reticulation and small subpleural cystic spaces, which progress at the 2-year 6-month and 3-year 5-month marks into extensive, multi-layered honeycombing with significant architectural distortion. The lower row displays a 'Nonspecific Interstitial Pneumonia (NSIP)' pattern. The initial scan shows ground-glass opacities and mild reticulation. Over 3 years and 4 months, there is a transformation into a UIP-like phenotype, characterized by the development of subpleural reticulation, traction bronchiectasis (indicated by arrowheads), and localized peripheral honeycombing. This comparison highlights the natural history of fibrotic progression and the phenotypic 'drift' toward a UIP-like pattern in chronic connective tissue disease-associated ILD, carrying significant prognostic and therapeutic implications.
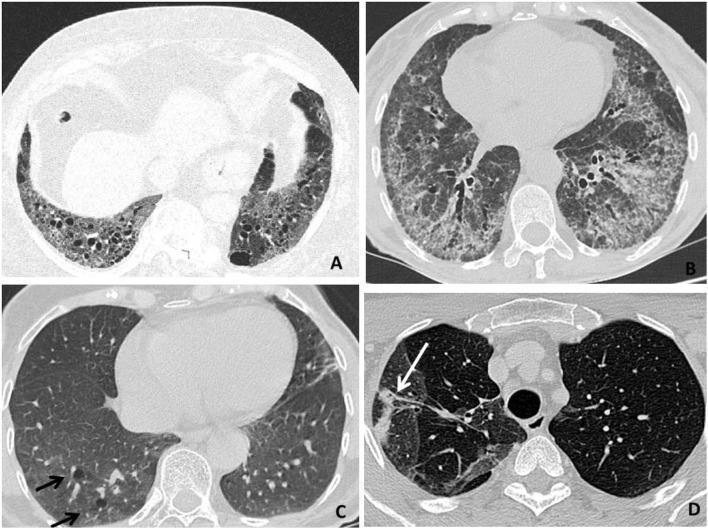
This composite of four axial high-resolution computed tomography (HRCT) scans illustrates various radiologic patterns of Rheumatoid Arthritis-associated Interstitial Lung Disease (RA-ILD). Panel A demonstrates a Usual Interstitial Pneumonia (UIP) pattern, characterized by bibasilar, subpleural honeycombing (clusters of cystic airspaces), reticular opacities, and traction bronchiectasis. Panel B displays a Nonspecific Interstitial Pneumonia (NSIP) pattern, showing diffuse, patchy ground-glass opacities and septal thickening with relative subpleural sparing. Panel C reveals a Lymphocytic Interstitial Pneumonia (LIP) pattern, highlighted by perivascular thin-walled lung cysts (indicated by black arrows). Panel D illustrates an Organizing Pneumonia (OP) pattern, featuring focal areas of parenchymal consolidation (indicated by a white arrow). These images serve as educational benchmarks for differentiating pulmonary manifestations in systemic autoimmune diseases. The radiological findings are critical for determining prognosis and guiding therapeutic strategies, such as distinguishing between predominantly fibrotic (UIP) versus inflammatory (NSIP/OP) processes.
hypersensitivity pneumonitis lung pathology birds farmer lung
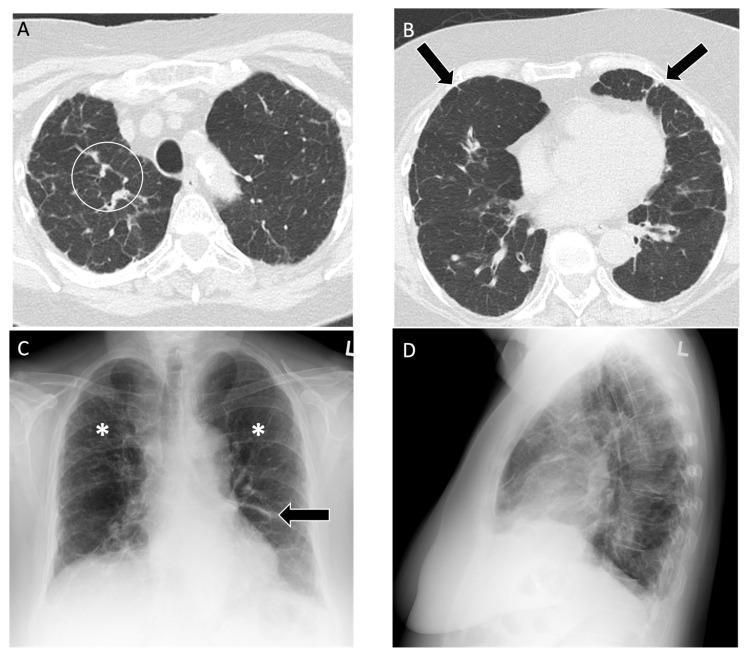
Educational multi-modal imaging of fibrotic hypersensitivity pneumonitis (Farmer's Lung). (A, B) Axial high-resolution computed tomography (HRCT) of the chest demonstrating key interstitial features. Image A shows a peribronchovascular distribution of reticular opacities (white circle) accompanied by mosaic lung attenuation, suggesting small airway involvement. Image B highlights mild diffuse subpleural reticulations (black arrows). (C, D) Posteroanterior and lateral chest radiographs revealing coarse reticulations and interstitial fibrosis (asterisks) primarily concentrated in the upper lung zones, associated with mild volume loss. A surgical staple line (black arrow in C) is visible in the left lower lobe, representing a prior diagnostic biopsy site. The imaging illustrates the classic presentation of chronic occupational interstitial lung disease, characterized by upper-lobe predominant fibrosis and architectural distortion.
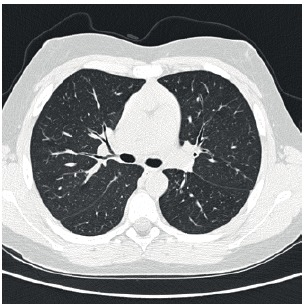
**Imaging Modality:** High-resolution computed tomography (HRCT) of the chest. **Anatomical Region:** Axial section of the thorax at the level of the main bronchi and pulmonary hila. **Observed Pathology:** Hypersensitivity pneumonitis (extrinsic allergic alveolitis). **Characteristic Visual Features:** The image demonstrates diffuse, bilateral ground-glass opacities (GGO) involving both lung fields. There is a prominent pattern of poorly defined centrilobular nodules, which are characteristic of the subacute phase of hypersensitivity pneumonitis. The distribution appears relatively uniform without significant craniocaudal or peripheral sparing in this single slice. No evidence of honeycombing, traction bronchiectasis, or significant architectural distortion is visible, suggesting an absence of advanced fibrosis. The bronchial structures and mediastinal contours appear within normal limits for this section. **Key Diagnostic Features:** The combination of widespread ground-glass attenuation and subtle centrilobular nodularity is highly suggestive of an inflammatory interstitial lung disease, specifically hypersensitivity pneumonitis triggered by inhaled organic antigens. These findings assist in differentiating the condition from other interstitial pneumonias or acute alveolar processes.
solitary pulmonary nodule diagnostic flowchart CT scan management
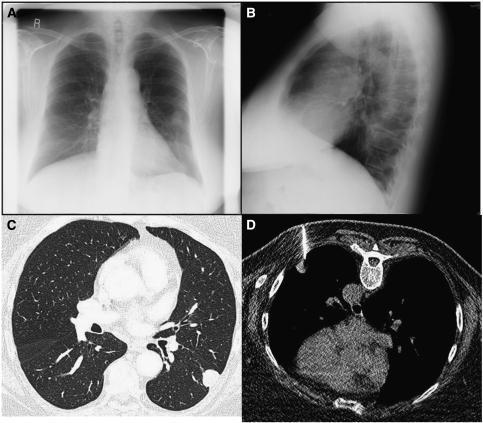
This composite diagnostic image illustrates the identification and interventional management of a solitary pulmonary nodule, identified as a lung metastasis. Panel A (frontal) and Panel B (lateral) are chest X-rays demonstrating a well-defined, rounded soft tissue opacity—often termed a 'coin lesion'—located in the mid-zone of the left lung. Panel C provides a corresponding high-resolution axial CT scan in lung-window setting, confirming a solitary, hyperdense, peripheral mass with distinct margins in the posterior segment of the left lung. Panel D shows an axial CT image of the patient in the prone position during a CT-guided percutaneous needle biopsy. A biopsy needle is clearly visible traversing the posterior chest wall and terminating within the target lesion. This educational series demonstrates the clinical pathway from radiological detection via X-ray to diagnostic characterization using CT and definitive tissue sampling. The case highlights staging protocols for metastatic disease, particularly relevant in oncology for determining disease progression and treatment planning.
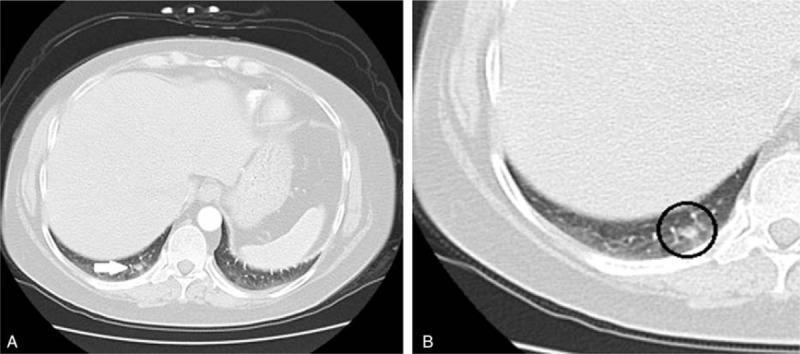
Diagnostic axial chest CT scan in lung windows demonstrating a solitary pulmonary nodule in the right lower lobe. Image A provides a broad overview of the lower thorax at the level of the diaphragm, where a white arrow indicates a 17 x 15 mm peripheral opacity. Image B presents a magnified view of the same lesion (circled), allowing for detailed assessment of its morphology. The nodule is located in the medial aspect of the lung base, adjacent to the right diaphragmatic crus. Visually, the lesion is well-defined but exhibits slightly irregular or lobulated margins with heterogeneous internal density relative to the surrounding aerated lung parenchyma. In a clinical context of ACTH-dependent Cushing syndrome, such a finding is highly significant as a potential source of ectopic ACTH secretion. This image serves as a teaching tool for identifying small solitary pulmonary nodules and emphasizes the importance of magnification in characterizing nodule margins and internal structure for oncological and endocrinological workups.
status asthmaticus management stepwise algorithm bronchospasm
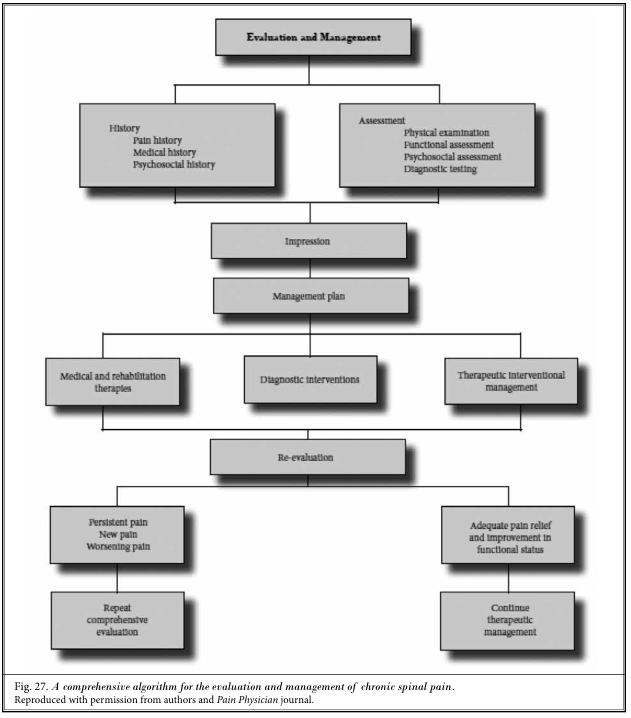
Summary : This figure presents a comprehensive flowchart algorithm for the evaluation and management of chronic spinal pain, detailing the stepwise process from initial assessment through re-evaluation and ongoing management. flowchart: # Nodes : • Evaluation and Management (rectangle) • History (rectangle): Pain history, Medical history, Psychosocial history • Assessment (rectangle): Physical examination, Functional assessment, Psychosocial assessment, Diagnostic testing • Impression (rectangle) • Management plan (rectangle) • Medical and rehabilitation therapies (rectangle) • Diagnostic interventions (rectangle) • Therapeutic interventional management (rectangle) • Re-evaluation (rectangle) • Persistent pain, New pain, Worsening pain (rectangle) • Repeat comprehensive evaluation (rectangle) • Adequate pain relief and improvement in functional status (rectangle) • Continue therapeutic management (rectangle) # Connectors : • Top-down arrows connect each step sequentially. • After "Management plan," three branches lead to "Medical and rehabilitation therapies," "Diagnostic interventions," and "Therapeutic interventional management." • All three branches converge at "Re-evaluation." • "Re-evaluation" splits into two branches: – Left: "Persistent pain, New pain, Worsening pain" → "Repeat comprehensive evaluation" – Right: "Adequate pain relief and improvement in functional status" → "Continue therapeutic management" # Layout : • Vertically oriented flowchart with multiple parallel branches at the management plan stage. • Merging and splitting of branches at re-evaluation, forming a decision point. • All nodes are rectangles with shadow effects for emphasis. # Analysis : • The flowchart provides a systematic, iterative approach to chronic spinal pain management. • Initial steps focus on thorough history and assessment, followed by formulation of an impression and management plan. • Management options are divided into medical/rehabilitation, diagnostic, and interventional therapies. • Re-evaluation is a critical decision point: persistent or worsening pain triggers a repeat evaluation, while adequate relief leads to continued management. • The algorithm emphasizes ongoing assessment and adaptation of treatment based on patient response.
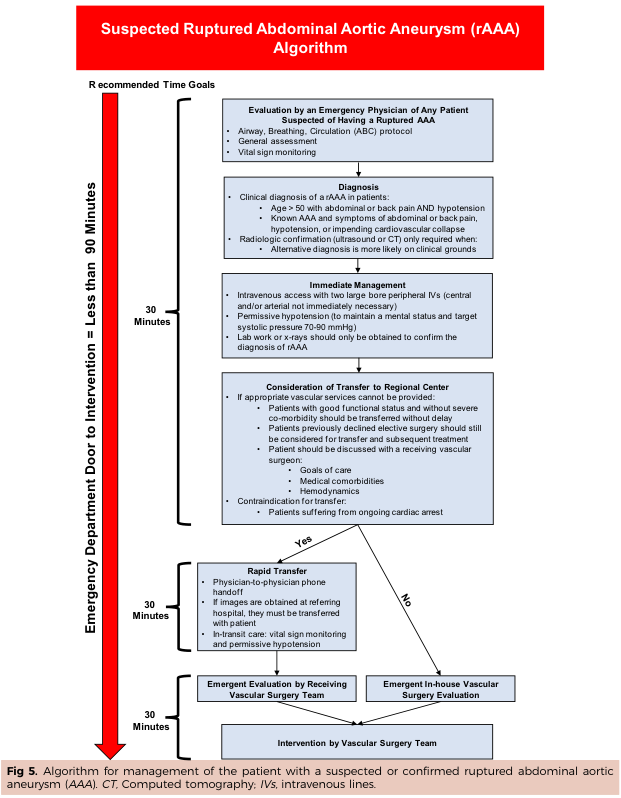
Summary : This flowchart presents an algorithm for the management of patients with suspected or confirmed ruptured abdominal aortic aneurysm (rAAA), outlining recommended time goals and stepwise clinical decision-making from emergency department arrival to surgical intervention. flowchart: # Nodes : • "Evaluation by an Emergency Physician of Any Patient Suspected of Having a Ruptured AAA" (rectangle) • "Diagnosis" (rectangle) • "Immediate Management" (rectangle) • "Consideration of Transfer to Regional Center" (rectangle) • Decision node: "If appropriate vascular services cannot be provided" (diamond; Yes/No branches) • "Rapid Transfer" (rectangle; Yes branch) • "Emergent Evaluation by Receiving Vascular Surgery Team" (rectangle; Yes branch) • "Emergent In-house Vascular Surgery Evaluation" (rectangle; No branch) • "Intervention by Vascular Surgery Team" (rectangle; both Yes/No branches converge here) # Connectors : • Downward arrows connect each step sequentially. • From "Consideration of Transfer to Regional Center", a decision diamond splits into: – Yes: proceeds to "Rapid Transfer" → "Emergent Evaluation by Receiving Vascular Surgery Team" – No: proceeds to "Emergent In-house Vascular Surgery Evaluation" • Both branches converge at "Intervention by Vascular Surgery Team". # Layout : • Vertical flow, top-to-bottom. • Decision diamond creates two parallel branches (Yes/No) that reconverge. • Time goals indicated on the left: "Emergency Department Door to Intervention = Less than 90 Minutes", with 30-minute intervals for each major step. # Section Details : ## Evaluation by Emergency Physician : • Airway, Breathing, Circulation (ABC) protocol. • General assessment. • Vital sign monitoring. ## Diagnosis : • Clinical diagnosis criteria: Age > 50 with abdominal/back pain AND hypotension; known AAA with symptoms; hypotension or impending cardiovascular collapse. • Radiologic confirmation (ultrasound or CT) only if alternative diagnosis is likely. • Lab work/x-rays only to confirm rAAA. ## Immediate Management : • IV access with two large bore peripheral IVs. • Permissive hypotension (mental status and systolic pressure 70–90 mmHg). • Lab/x-ray only to confirm diagnosis. ## Consideration of Transfer to Regional Center : • Transfer if appropriate vascular services unavailable. • Transfer patients with good functional status and without severe comorbidity. • Patients who previously declined elective surgery should still be considered. • Discuss with receiving vascular surgeon: goals of care, comorbidities, hemodynamics. • Contraindication: ongoing cardiac arrest. ## Rapid Transfer (Yes branch) : • Physician-to-physician phone handoff. • Transfer images with patient if obtained. • In-transit care: vital sign monitoring, permissive hypotension. ## Emergent Evaluation by Receiving Vascular Surgery Team (Yes branch) : • Immediate evaluation upon arrival. ## Emergent In-house Vascular Surgery Evaluation (No branch) : • Immediate evaluation by in-house team. ## Intervention by Vascular Surgery Team : • Final step for both transfer and in-house pathways. # Design Encodings : • Rectangular nodes for process steps. • Diamond node for decision point. • Bold red vertical bar on left indicating time goals. • Arrows for flow direction. • Text box at bottom: "Fig 5. Algorithm for management of the patient with a suspected or confirmed ruptured abdominal aortic aneurysm (AAA). CT, Computed tomography; IVs, intravenous lines." # Analysis : • The algorithm emphasizes rapid assessment, diagnosis, and management, aiming for intervention within 90 minutes of emergency department arrival. • Decision logic prioritizes transfer to specialized centers if vascular services are unavailable, with clear criteria for transfer and contraindications. • Both transfer and in-house pathways converge on emergent surgical intervention, underscoring the urgency and standardized approach to rAAA management. • Time goals are visually reinforced, highlighting the importance of minimizing delays at each step.
allergic bronchopulmonary aspergillosis ABPA chest X-ray central bronchiectasis
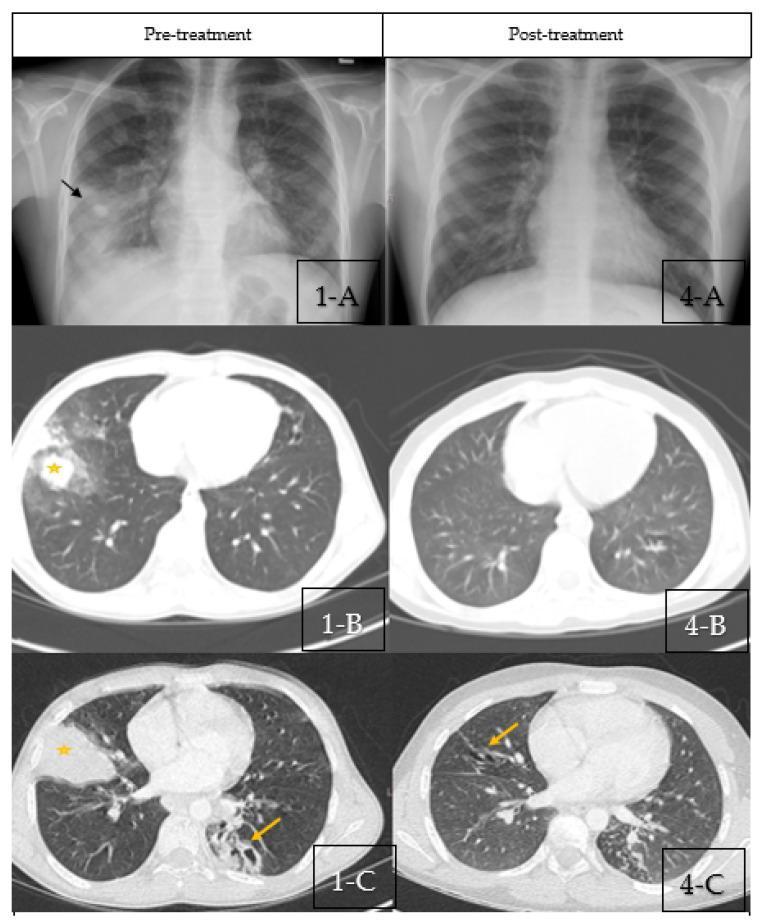
This composite diagnostic image compares pre-treatment and post-treatment thoracic imaging in a patient with allergic bronchopulmonary aspergillosis (ABPA). Pre-treatment imaging (1-A, 1-B, 1-C) includes a posterior-anterior chest X-ray showing right middle lobe consolidation (black arrow) and scattered bilateral nodular opacities. Corresponding axial CT scans demonstrate bilateral central bronchiectasis, characteristic 'finger-in-glove' mucus impaction (yellow arrow), and areas of segmental/subsegmental atelectasis (yellow star). Post-treatment imaging (4-A, 4-B, 4-C) after steroid therapy reveals significant interval improvement. The chest X-ray (4-A) shows complete resolution of the right middle lobe consolidation. The follow-up axial CT scans (4-B, 4-C) demonstrate the clearance of mucus impaction and resolution of atelectasis, though residual cylindrical central bronchiectasis (yellow arrows) remains visible. This comparison illustrates the typical radiological progression and therapeutic response of mucoid impaction and secondary lung collapse in inflammatory airway disease.
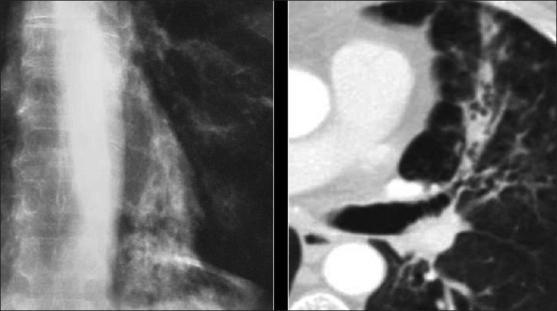
This composite diagnostic image features a side-by-side comparison of a chest X-ray (left) and a computed tomography (CT) scan (right) from a patient with Allergic Bronchopulmonary Aspergillosis (ABPA). The chest X-ray demonstrates increased reticular opacities and areas of consolidation, particularly concentrated in the lower lobes, which are characteristic of chronic inflammatory changes and infection. The axial CT scan on the right provides a more detailed view of the lung parenchyma, highlighting significant bronchial dilation consistent with bronchiectasis. A key diagnostic feature shown is mucus impaction within the dilated airways, creating the classic 'finger-in-glove' appearance, where dense mucoid material fills the bronchial lumen. These findings illustrate the typical radiographic progression of ABPA, showing the relationship between airway remodeling (bronchiectasis) and functional obstruction (airway impaction) in the context of a hypersensitivity response to Aspergillus species.
inflammatory myopathy dermatomyositis polymyositis muscle biopsy skin rash
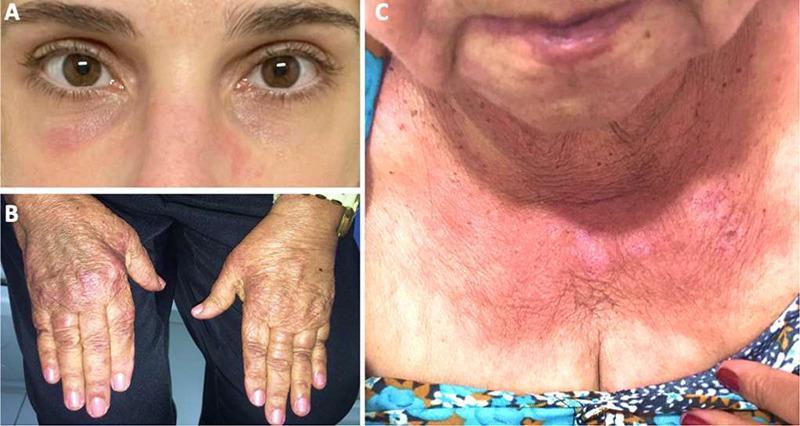
A composite of three clinical photographs demonstrating the classic cutaneous manifestations of dermatomyositis, an idiopathic inflammatory myopathy. Panel A: A heliotrope rash characterized by a reddish-purple (violaceous) discoloration in the periorbital region, involving the eyelids and malar area. Panel B: Gottron papules/sign, presenting as erythematous to violaceous, slightly scaly patches overlying the dorsal aspect of the metacarpophalangeal and interphalangeal joints. Panel C: The 'V-sign,' a confluent erythematous rash in a photosensitive distribution across the anterior lower neck and upper chest. These findings are pathognomonic for dermatomyositis and are critical for clinical diagnosis, often preceding or accompanying proximal muscle weakness. The images highlight key dermatologic markers used to differentiate dermatomyositis from other connective tissue diseases and inflammatory myopathies like polymyositis.
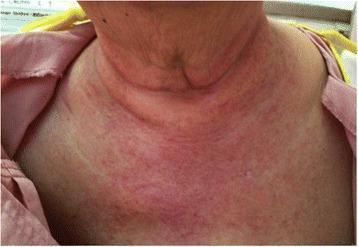
This clinical photograph displays the anterior neck, upper chest, and shoulders of a patient with dermatomyositis. The image highlights a confluent erythematous rash in a characteristic 'shawl sign' distribution. The skin appears mottled with varying intensities of redness, ranging from discrete maculopapular lesions to confluent patches covering the sun-exposed areas. A small, circular mark representing a recent skin punch biopsy site is visible on the upper left chest wall. This visual presentation is a hallmark cutaneous manifestation of inflammatory myopathies, illustrating the photosensitive nature of the condition. It serves as an educational example for dermatological and rheumatological assessment in patients presenting with symmetrical proximal muscle weakness and systemic symptoms.
obesity hypoventilation syndrome Pickwickian polysomnography hypercapnia
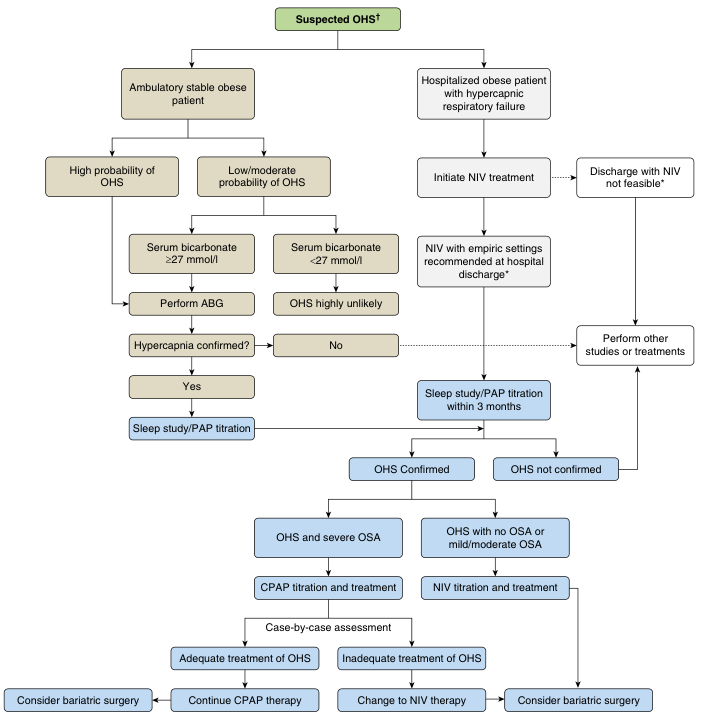
Summary : This flowchart outlines the diagnostic and management pathway for suspected Obesity Hypoventilation Syndrome (OHS), differentiating between ambulatory and hospitalized obese patients, and guiding subsequent investigations and treatments based on probability, laboratory findings, and response to therapy. flowchart: # Nodes : • Suspected OHS† (rounded rectangle, start) • Ambulatory stable obese patient (rectangle) • Hospitalized obese patient with hypercapnic respiratory failure (rectangle) • High probability of OHS (rectangle) • Low/moderate probability of OHS (rectangle) • Serum bicarbonate ≥27 mmol/l (rectangle) • Serum bicarbonate <27 mmol/l (rectangle) • Perform ABG (rectangle) • OHS highly unlikely (rectangle) • Hypercapnia confirmed? (diamond/decision) • Yes (rectangle) • No (rectangle) • Sleep study/PAP titration (rectangle) • Initiate NIV treatment (rectangle) • Discharge with NIV not feasible* (rectangle) • NIV with empiric settings recommended at hospital discharge* (rectangle) • Perform other studies or treatments (rectangle) • Sleep study/PAP titration within 3 months (rectangle) • OHS Confirmed (rectangle) • OHS not confirmed (rectangle) • OHS and severe OSA (rectangle) • OHS with no OSA or mild/moderate OSA (rectangle) • CPAP titration and treatment (rectangle) • NIV titration and treatment (rectangle) • Case-by-case assessment (rectangle) • Adequate treatment of OHS (rectangle) • Inadequate treatment of OHS (rectangle) • Consider bariatric surgery (rectangle) • Continue CPAP therapy (rectangle) • Change to NIV therapy (rectangle) # Connectors : • Downward arrows connect each step in the process. • Branches split based on probability of OHS, serum bicarbonate levels, and confirmation of hypercapnia. • Decision diamond at "Hypercapnia confirmed?" splits to "Yes" (proceed to sleep study/PAP titration) or "No" (OHS highly unlikely or further studies/treatments). • Hospitalized patient pathway splits to "Discharge with NIV not feasible*" or "NIV with empiric settings recommended at hospital discharge*", then to "Sleep study/PAP titration within 3 months" or "Perform other studies or treatments". • After sleep study/PAP titration, branches to "OHS Confirmed" or "OHS not confirmed". • If OHS confirmed, further split into "OHS and severe OSA" (CPAP titration/treatment) or "OHS with no OSA or mild/moderate OSA" (NIV titration/treatment). • Case-by-case assessment leads to either "Adequate treatment of OHS" (continue CPAP therapy or consider bariatric surgery) or "Inadequate treatment of OHS" (change to NIV therapy or consider bariatric surgery). # Layout : • The flowchart is organized in a top-down manner, starting with suspected OHS and splitting into two main branches: ambulatory stable obese patients and hospitalized obese patients. • Each branch contains further decision points and merges at the sleep study/PAP titration step. • The chart uses rectangles for process steps, a diamond for decision, and rounded rectangles for start/end points. • Blue-shaded boxes indicate steps involving sleep study/PAP titration and treatment decisions. # Analysis : • The flowchart provides a clear, stepwise approach for evaluating and managing suspected OHS, emphasizing the importance of serum bicarbonate and ABG testing in ambulatory patients, and NIV initiation in hospitalized patients. • Decision points ensure that only patients with confirmed hypercapnia proceed to sleep study/PAP titration. • The pathway distinguishes between OHS with severe OSA (managed with CPAP) and OHS with no/mild/moderate OSA (managed with NIV). • Case-by-case assessment allows for individualized management, including consideration of bariatric surgery for refractory cases. • The chart highlights the need for follow-up sleep studies and titration within 3 months for hospitalized patients discharged on NIV.
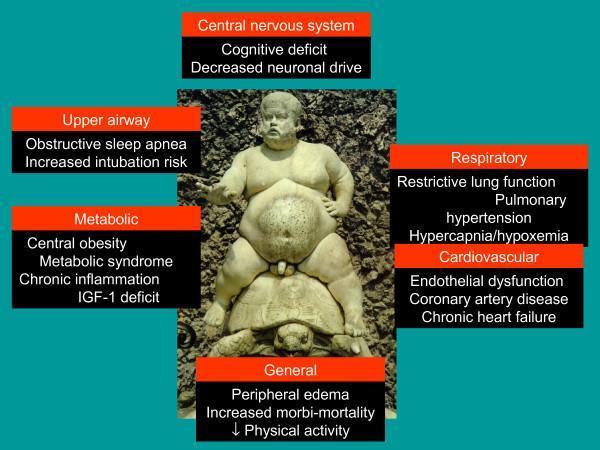
This infographic combines a clinical photograph of a historical statue (Bacchus in Boboli Gardens) with descriptive text boxes to illustrate the systemic consequences of obesity and Obesity Hypoventilation Syndrome (OHS). The central visual features a male figure with morbid obesity, characterized by significant central abdominal fat, subcutaneous fat around the thorax and thighs, and visible skin folds, seated on a tortoise. Surrounding the figure are clinical annotations categorized by organ system: 'Central Nervous System' (cognitive deficit, decreased neuronal drive), 'Upper Airway' (obstructive sleep apnea, intubation risk), 'Metabolic' (metabolic syndrome, chronic inflammation, IGF-1 deficit), 'Respiratory' (restrictive lung function, pulmonary hypertension, hypercapnia/hypoxemia), 'Cardiovascular' (endothelial dysfunction, coronary artery disease, chronic heart failure), and 'General' (peripheral edema, decreased physical activity, increased morbi-mortality). This educational illustration serves as a pathophysiology diagram to visualize the multi-organ impact of excessive body mass and respiratory system mechanical disturbance in the context of chronic pulmonary medicine.
MD MEDICINE - PULMONOLOGY EXAM NOTES
Complete Answer Bank with Diagrams & Flowcharts
LONG ANSWER QUESTIONS (20 Marks)
Q1. Functional Anatomy of Lungs + Lung Function Tests [20 marks | 2017]
PART A: FUNCTIONAL ANATOMY OF LUNGS
Gross Structure
| Feature | Details |
|---|---|
| Right lung | 3 lobes (upper, middle, lower), 10 bronchopulmonary segments |
| Left lung | 2 lobes (upper, lower), 8-9 segments (lingula = equivalent of middle lobe) |
| Total alveoli | ~300-500 million |
| Total surface area | ~70 m² (size of a tennis court) |
| Functional unit | Acinus (respiratory bronchiole + alveolar ducts + alveoli) |
Airways - Conducting Zone (Dead Space = 150 mL)
Trachea → L & R Main Bronchi → Lobar Bronchi → Segmental Bronchi
→ Subsegmental → Terminal Bronchioles (Generation 16)
[NO gas exchange here - purely conducts air]
Respiratory Zone (Gas Exchange)
Respiratory bronchioles (Gen 17-19) → Alveolar ducts (Gen 20-22)
→ Alveolar sacs → Alveoli
Alveolar Structure
- Type I pneumocytes (95% of surface): thin, gas exchange
- Type II pneumocytes (5%): surfactant production (DPPC), stem cells for repair
- Surfactant: reduces surface tension, prevents alveolar collapse, appears at 24-28 wks gestation
- Blood-air barrier: 0.2-0.5 µm thick (type I cell + basement membrane + capillary endothelium)
Pulmonary Circulation
- Low pressure system: PA pressure 25/10 mmHg (mean ~15 mmHg)
- Receives entire cardiac output
- Hypoxic vasoconstriction (HPV): diverts blood away from poorly ventilated areas
Lung Volumes & Capacities
┌─────────────────────────────────────────────────────┐
│  IRV (3000 mL)     ─── Inspiratory Reserve Volume   │
├─────────────────────────────────────────────────────┤
│  TV  (500 mL)      ─── Tidal Volume                 │
├─────────────────────────────────────────────────────┤
│  ERV (1200 mL)     ─── Expiratory Reserve Volume    │
├─────────────────────────────────────────────────────┤
│  RV  (1200 mL)     ─── Residual Volume              │
└─────────────────────────────────────────────────────┘

CAPACITIES:
• IC  = IRV + TV       = 3500 mL
• FRC = ERV + RV       = 2400 mL  ← equilibrium point of lung
• VC  = IRV + TV + ERV = 4700 mL
• TLC = All volumes    = 5900 mL
Memory: IRVE (IRV, TV, ERV, RV) - "I Try Every Respiratory Volume"
PART B: PULMONARY FUNCTION TESTS
1. SPIROMETRY (Most common PFT)
| Parameter | Definition | Normal |
|---|---|---|
| FVC | Forced Vital Capacity | > 80% predicted |
| FEV1 | Volume exhaled in 1st second | > 80% predicted |
| FEV1/FVC ratio | Tiffeneau index | > 70% (>LLN) |
| FEF 25-75% | Mid-expiratory flow (sensitive for small airways) | > 65% |
| PEFR | Peak Expiratory Flow Rate | > 80% predicted |
PFT Interpretation Algorithm (Murray & Nadel's Textbook of Respiratory Medicine)
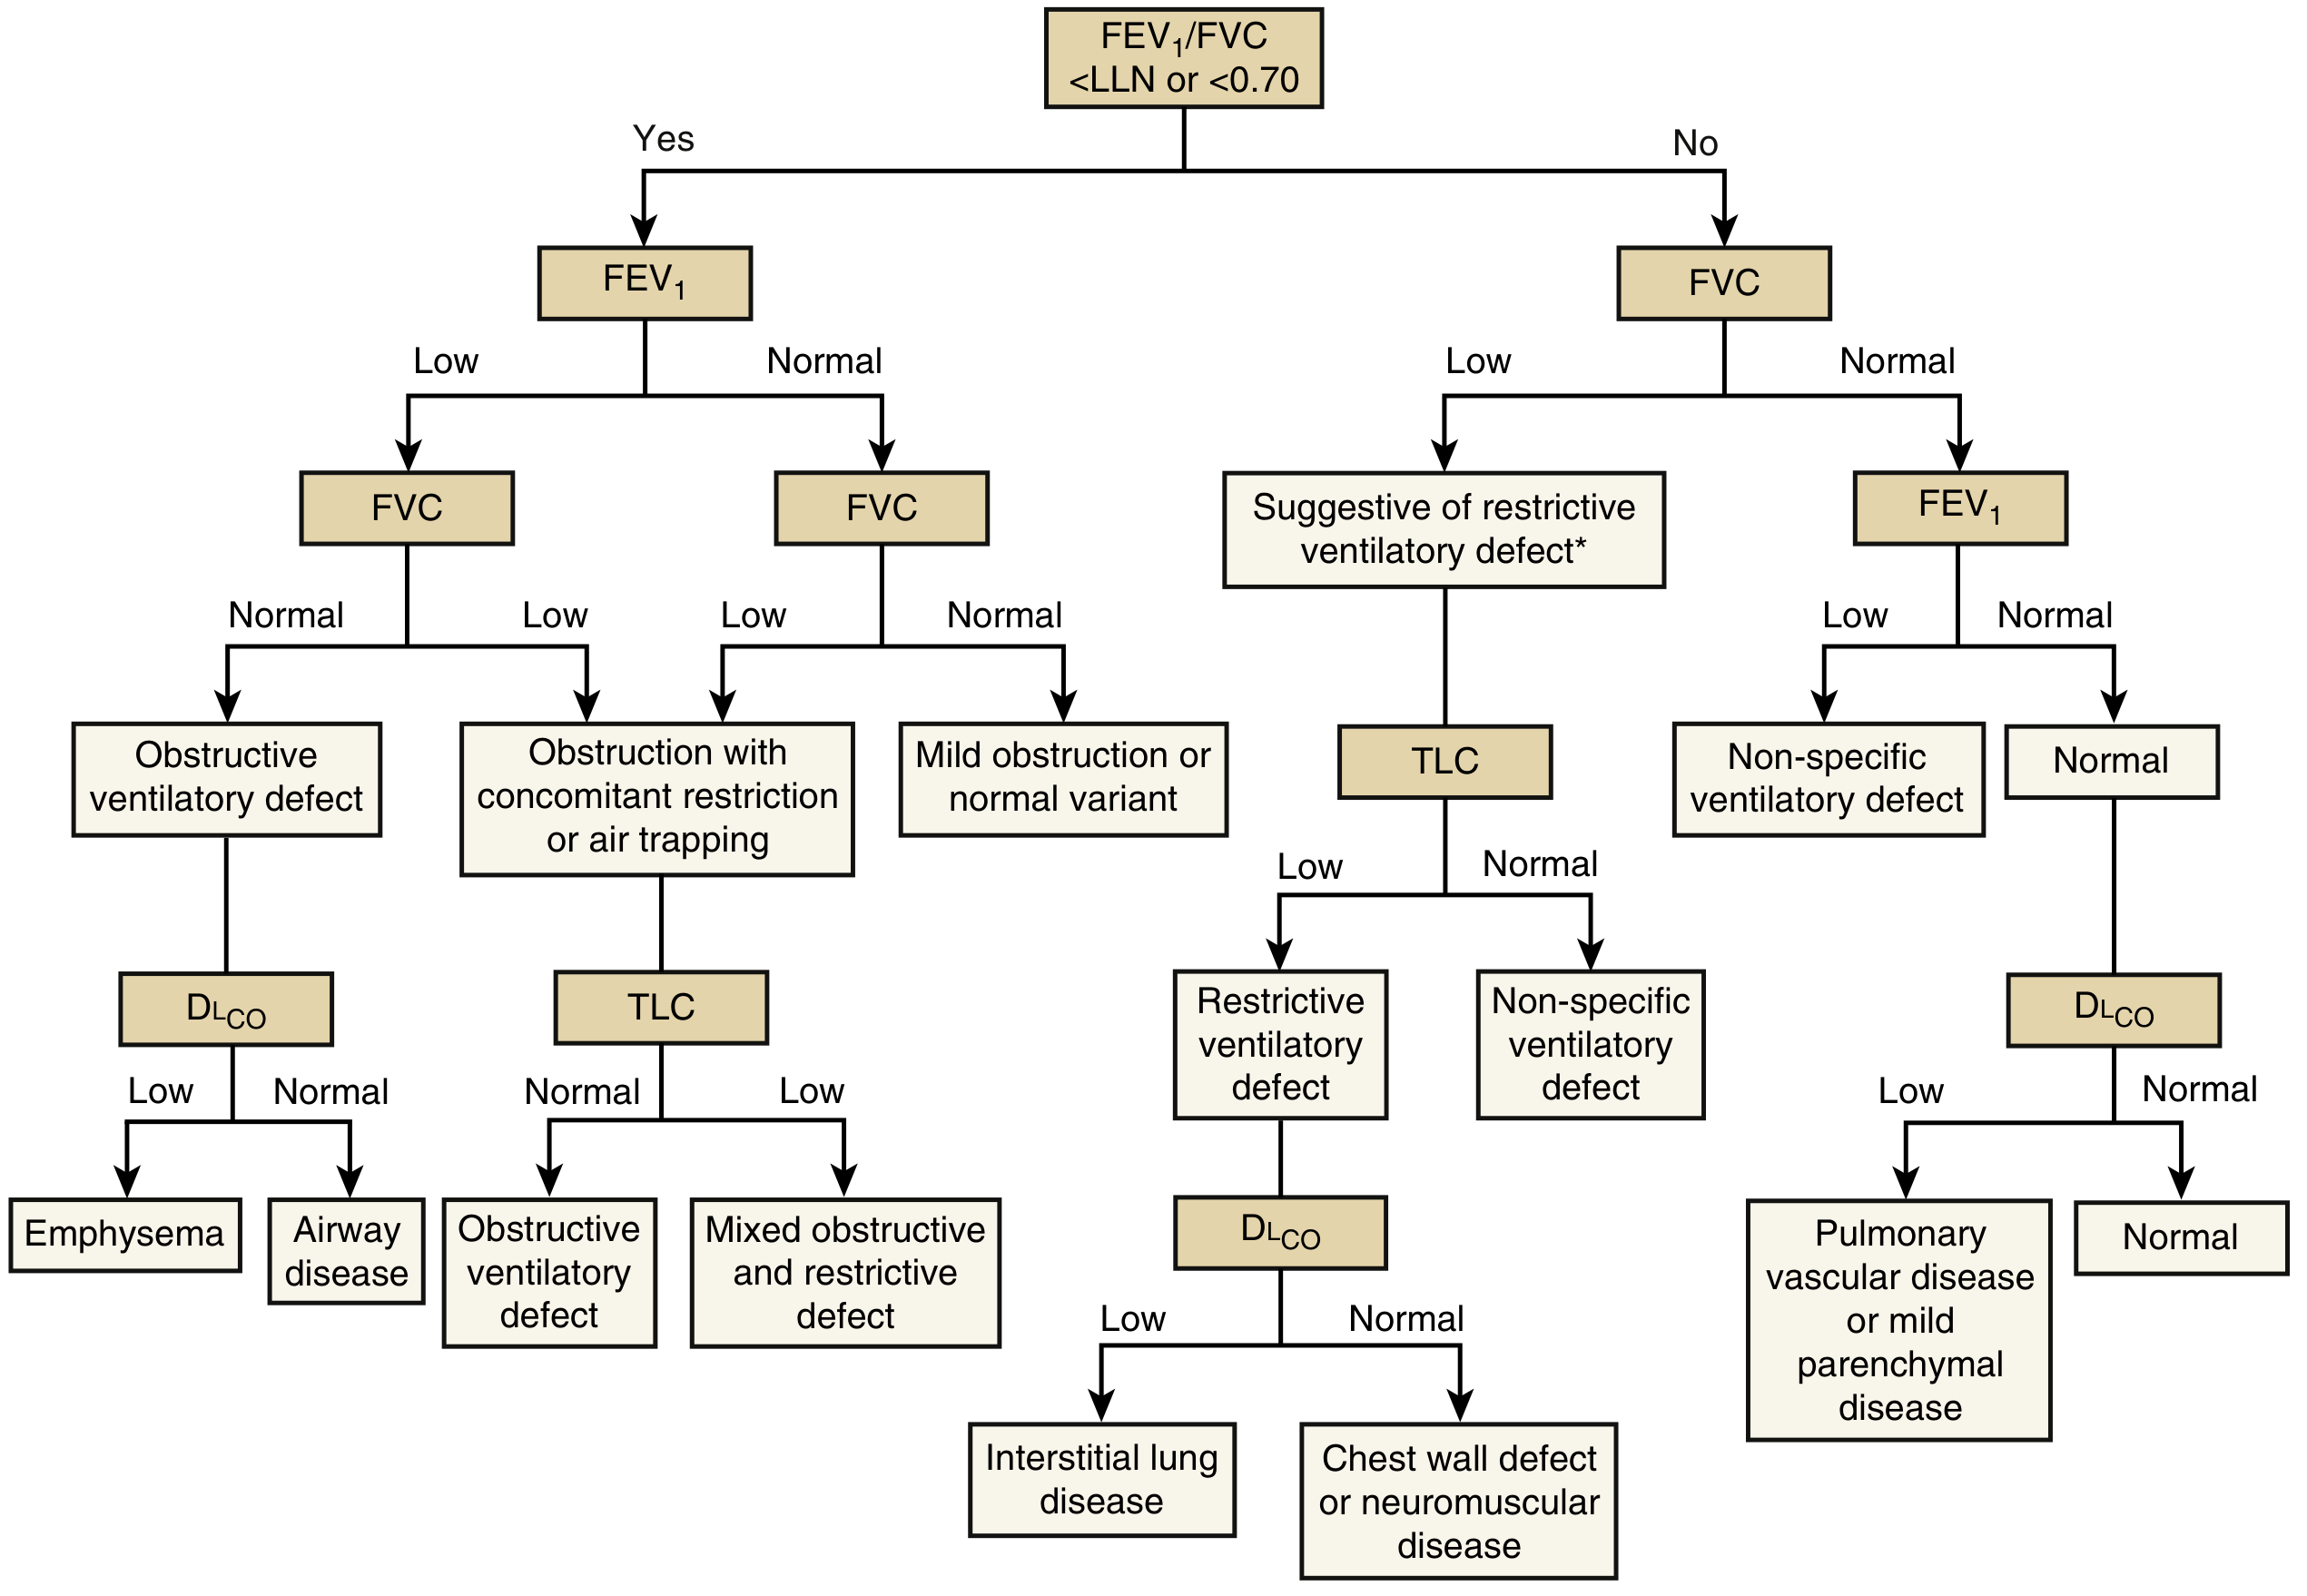
PFT Patterns Summary
| Pattern | FEV1 | FVC | FEV1/FVC | TLC | DLCO | Examples |
|---|---|---|---|---|---|---|
| Obstructive | ↓ | N or ↓ | ↓ <70% | N or ↑ | ↓ (emphysema) | Asthma, COPD, bronchiectasis |
| Restrictive | ↓ | ↓ | N or ↑ | ↓ <80% | ↓ | ILD, pleural disease, obesity |
| Mixed | ↓ | ↓ | ↓ | ↓ | ↓ | Sarcoidosis, ABPA |
2. LUNG VOLUMES (Body Plethysmography / Helium Dilution)
- Measures FRC, RV, TLC
- Plethysmography: most accurate (measures all gas including trapped)
- Helium dilution: underestimates in emphysema (poorly communicating spaces)
3. DIFFUSION CAPACITY (DLCO / TLCO)
- Measures transfer of CO across alveolar-capillary membrane
- Reduced in: ILD, emphysema, pulmonary hypertension, pulmonary edema
- Increased in: Polycythemia, pulmonary hemorrhage, early left heart failure
- Normal despite obstruction: Asthma (preserved DLCO distinguishes from emphysema)
4. BRONCHIAL PROVOCATION TESTS
- Methacholine challenge: PC20 < 8 mg/mL = significant bronchial hyperreactivity (asthma)
- Bronchodilator reversibility: FEV1 increase >12% AND >200 mL = reversible obstruction (asthma)
- Exercise challenge: for exercise-induced bronchoconstriction
5. FLOW-VOLUME LOOPS
NORMAL               OBSTRUCTIVE           RESTRICTIVE
     /\                    /\                  /|
    /  \                  / \_____            / |
   /    \                /        \          /  |
──/──────\──          ──/──────────\──     ──/──|──
(smooth arc)         (scooped out/concave)  (narrow tall)
6. ARTERIAL BLOOD GAS (ABG) - Respiratory Assessment
- Type 1 RF: PaO2 < 60 mmHg, PaCO2 normal/low
- Type 2 RF: PaO2 < 60 mmHg + PaCO2 > 45 mmHg
7. 6-MINUTE WALK TEST
- Measures functional exercise capacity
- Distance < 350 m = poor prognosis in ILD/pulmonary hypertension
Q2. Inflammatory Myopathies - Types, Diagnosis, DD, Treatment [20 marks | 2020]
CLASSIFICATION
IDIOPATHIC INFLAMMATORY MYOPATHIES (IIM)
├── Dermatomyositis (DM)
├── Polymyositis (PM)
├── Inclusion Body Myositis (IBM)
├── Immune-mediated Necrotizing Myopathy (IMNM)
└── Anti-synthetase Syndrome (ASS)
1. DERMATOMYOSITIS (DM)
Clinical Features
- Heliotrope rash: violaceous periorbital rash with edema
- Gottron papules: erythematous scaly papules over MCP/PIP joints
- V-sign: erythema of anterior chest/neck (photosensitive)
- Shawl sign: erythema over shoulders/upper back
- Mechanics' hands: cracked, fissured hyperkeratotic skin on lateral fingers
Key Antibodies in Inflammatory Myopathies
| Antibody | Association | Clinical Significance |
|---|---|---|
| Anti-Jo1 (most common MSA) | Anti-synthetase syndrome | ILD, mechanic's hands, arthritis, fever |
| Anti-Mi-2 | Classic DM | Good steroid response |
| Anti-MDA5 | Amyopathic DM | Severe ILD, skin ulcers |
| Anti-SRP | IMNM | Severe myopathy, poor response |
| Anti-HMGCR | Statin-induced IMNM | Proximal weakness |
| Anti-TIF1γ | Paraneoplastic DM | Cancer association |
2. POLYMYOSITIS (PM)
- No skin involvement
- Diagnosis of exclusion (rule out IBM, IMNM, DM without rash)
- Proximal symmetric weakness
3. INCLUSION BODY MYOSITIS (IBM)
- Most common after age 50
- Distal + proximal weakness (finger flexors + quadriceps - distinctive)
- Asymmetric
- DOES NOT respond to steroids
- Biopsy: rimmed vacuoles, 15-18 nm filamentous inclusions
Diagnostic Approach - Flowchart
SUSPECTED INFLAMMATORY MYOPATHY
(Proximal weakness + elevated CK)
        │
        ▼
INVESTIGATIONS:
• Serum CK (markedly ↑, up to 50× normal in PM/DM)
• Aldolase, LDH, AST, ALT
• Myositis antibody panel (MSA + MAA)
• EMG (myopathic pattern: small MUAPs, early recruitment)
• MRI muscles (edema in active inflammation - guides biopsy)
        │
        ▼
MUSCLE BIOPSY (Gold Standard)
        │
   ┌────┴────┐
   DM         PM            IBM
Perifascicular  Endomysial    Rimmed
atrophy       infiltrate    vacuoles
CD4 cells     CD8 cells     p62, TDP-43
(B cells in   (HLA-I ↑)     inclusions
vessels)
        │
        ▼
SCREEN FOR:
• ILD (HRCT chest, PFT)
• Cardiac involvement (Echo, Troponin, Holter)
• Cancer screen (DM: CT chest/abdomen/pelvis, PSA, CEA)
• Dysphagia (barium swallow)
Diagnostic Criteria (Lundberg 2017)
| Score | Variable | Points |
|---|---|---|
| - | No skin involvement, proximal weakness | 0.7 |
| - | Anti-Jo1 positive | 7.0 |
| - | Myopathic EMG | 1.4 |
| - | Specific biopsy | 1.2-3.0 |
Differential Diagnosis
| Condition | Distinguishing Feature |
|---|---|
| Muscular dystrophies | CK ↑ but family history, biopsy shows dystrophin |
| Myasthenia gravis | Fatigable weakness, ptosis, normal CK, AChR antibodies |
| Lambert-Eaton | Proximal weakness, autonomic, VGCC antibodies |
| Drug-induced myopathy | Statins, steroids, colchicine, alcohol history |
| Endocrine myopathy | Hypothyroid, Cushing - TSH, cortisol |
| Infections | HIV, HTLV-1, coxsackievirus |
Treatment
Step 1: Glucocorticoids (First line)
- Prednisolone 1 mg/kg/day (max 60-80 mg) for 4-6 weeks
- Taper over 6-12 months based on CK and strength
- Do NOT taper by CK alone - monitor function
Step 2: Steroid-Sparing Agents (add if inadequate response/steroid toxicity)
FIRST LINE STEROID SPARING:
• Methotrexate 15-25 mg/week (most used; avoid in ILD)
• Azathioprine 2-3 mg/kg/day (preferred if ILD present)

SECOND LINE:
• Mycophenolate mofetil 2-3g/day (especially ILD)
• Cyclosporine

SEVERE/REFRACTORY:
• IVIG 2g/kg over 2-5 days (especially for dysphagia)
• Rituximab (anti-CD20; best evidence for anti-Jo1, anti-Mi-2)
• Tacrolimus (ILD)

IBM: NO effective treatment; exercise therapy
Special Considerations
- Cancer screen mandatory in DM (10-20% have underlying malignancy)
- ILD management: Azathioprine/MMF; severe = cyclophosphamide
- Sunscreen for DM skin disease; hydroxychloroquine for skin
Q3 + Q4 + Q5. INTERSTITIAL LUNG DISEASE (ILD) [20 marks each | 2021, 2022, 2025]
DEFINITION
CLASSIFICATION (ATS/ERS 2013)
INTERSTITIAL LUNG DISEASES
│
├── IDIOPATHIC INTERSTITIAL PNEUMONIAS (IIP)
│   ├── Chronic fibrosing: IPF, NSIP
│   ├── Smoking-related: DIP, RB-ILD
│   ├── Acute/subacute: COP, AIP (Hamman-Rich)
│   └── Rare: LIP, PPFE, Unclassifiable
│
├── KNOWN CAUSE / ASSOCIATED WITH
│   ├── Connective tissue disease (CTD-ILD): RA, SSc, SLE, PM/DM
│   ├── Hypersensitivity pneumonitis (HP)
│   ├── Drug-induced ILD
│   └── Occupational (silicosis, asbestosis, coal worker's)
│
├── GRANULOMATOUS
│   ├── Sarcoidosis
│   └── HP (granulomatous form)
│
└── RARE/ORPHAN
    ├── LAM (Lymphangioleiomyomatosis)
    ├── LCH (Langerhans Cell Histiocytosis)
    └── PAP (Pulmonary Alveolar Proteinosis)
ETIOPATHOGENESIS OF IPF (Most Common IIP)
Pathogenesis Flowchart
GENETIC SUSCEPTIBILITY (MUC5B, TOLLIP, TERT mutations)
+
INCITING INJURY (cigarette smoke, micro-aspiration, viral)
        │
        ▼
ALVEOLAR EPITHELIAL INJURY (Type II pneumocyte damage)
        │
        ▼
ABERRANT REPAIR PROCESS
(Normally: inflammation → resolution)
(In IPF: fibroblast activation → myofibroblast differentiation)
        │
        ▼
TGF-β SIGNALING (key mediator)
   ↑ Fibroblast proliferation
   ↑ Collagen synthesis
   ↑ ECM deposition
        │
        ▼
PROGRESSIVE IRREVERSIBLE FIBROSIS
(Honeycombing, traction bronchiectasis)
        │
        ▼
RESPIRATORY FAILURE + DEATH (median survival 3-5 years)
HISTOPATHOLOGY
Usual Interstitial Pneumonia (UIP) - Pattern of IPF
| Feature | Description |
|---|---|
| Temporal heterogeneity | Old fibrosis + fresh fibroblastic foci side by side |
| Spatial heterogeneity | Subpleural, basal predominance |
| Fibroblastic foci | Active areas of fibrosis (prognostic marker) |
| Honeycombing | Cystic spaces lined by bronchiolar epithelium |
| Minimal inflammation | KEY - distinguishes from NSIP |
NSIP (Non-Specific Interstitial Pneumonia)
- Temporal homogeneity (all areas equally inflamed/fibrotic)
- Cellular (ground glass) or fibrotic
- Better prognosis than UIP
- Associated with CTD (especially SSc, PM/DM)
CLINICAL FEATURES
| Feature | Details |
|---|---|
| Age | >50 years (IPF), middle-aged (CTD-ILD) |
| Onset | Insidious dyspnea on exertion + dry cough |
| Examination | Velcro crackles (bibasal, fine, end-inspiratory) |
| Clubbing | Present in 25-50% of IPF |
| Cyanosis | Late feature |
| Cor pulmonale | End-stage (elevated JVP, right heart failure) |
RADIOLOGICAL FEATURES
Chest X-Ray
- Bilateral basal reticular opacities
- Reduced lung volumes
- Late: honeycombing
HRCT Chest (Gold Standard Investigation)
| HRCT Pattern | Features | Diagnoses |
|---|---|---|
| UIP | Subpleural basal honeycombing ± traction bronchiectasis, NO GGO predominance | IPF |
| NSIP | Bilateral GGO + reticulation, subpleural sparing | CTD-ILD, HP |
| OP | Peripheral consolidation, "reversed halo sign" | COP, drug reaction |
| DIP | Diffuse GGO (smokers) | Desquamative IP |
DIAGNOSTIC APPROACH
SUSPECTED ILD
(Exertional dyspnea + crackles + CXR abnormality)
        │
        ▼
HISTORY: Occupation, birds/hay, drugs, CTD symptoms, smoking
        │
        ▼
INVESTIGATIONS:
• HRCT chest (diagnostic in UIP pattern - no biopsy needed)
• PFTs: Restrictive pattern + ↓DLCO
• Echocardiography: pulmonary hypertension
• Autoimmune workup: ANA, RF, anti-CCP, myositis antibodies
• 6-minute walk test
• ABG/SpO2
        │
   ┌────┴────────────────┐
   │                     │
HRCT = Typical UIP     HRCT = Non-diagnostic
(IPF - no biopsy)      or indeterminate
                              │
                              ▼
                    MULTIDISCIPLINARY DISCUSSION
                    (Pulmonologist + Radiologist + Pathologist)
                              │
                              ▼
                    SURGICAL LUNG BIOPSY (VATS)
                    (if safe, appropriate, will change Mx)
MANAGEMENT
Non-Pharmacological
- Smoking cessation (most important)
- Supplemental O2 (if SpO2 < 88% at rest or on exertion)
- Pulmonary rehabilitation
- Vaccinations (influenza, pneumococcal)
Pharmacological
NINTEDANIB (Ofev):
• Multi-tyrosine kinase inhibitor (VEGFR, FGFR, PDGFR)
• Slows decline in FVC by ~50%
• Side effects: diarrhea, nausea, hepatotoxicity
• Also approved for SSc-ILD and progressive pulmonary fibrosis

PIRFENIDONE (Esbriet):
• TGF-β inhibitor + anti-inflammatory + anti-oxidant
• Slows FVC decline, improves PFS
• Side effects: photosensitivity, GI, hepatotoxicity
• Dose: 801 mg TDS

AVOID in IPF: Steroids, azathioprine, N-acetylcysteine (PANTHER trial)
- Immunosuppression: mycophenolate mofetil, azathioprine, cyclosporine
- Tocilizumab for SSc-ILD
- Rituximab for PM/DM-ILD
Lung Transplantation
- Single or bilateral
- Indicated when FVC < 50-60%, DLCO < 40%, rapid decline, or resting hypoxia
- 5-year survival ~50%
Monitoring
- PFTs every 3-6 months
- FVC decline >10% in 12 months = significant progression → consider transplant listing
SHORT ANSWER QUESTIONS (10 Marks)
SAQ 1. Pulmonary Function Tests [10 marks | 2020, 2018, 2023, 2017]
- Spirometry - FVC, FEV1, FEV1/FVC, PEFR
- Lung Volumes - Plethysmography or helium dilution (TLC, RV, FRC)
- DLCO - Diffusing capacity
- Bronchial provocation - Methacholine, exercise
- ABG - Oxygenation and ventilation
- Obstructive: FEV1/FVC < 70%, TLC normal/↑
- Restrictive: TLC < 80%, FEV1/FVC normal/↑
- Mixed: Both patterns together
SAQ 2. Types of Respiratory Failure [10 marks | 2020]
DEFINITION
CLASSIFICATION
RESPIRATORY FAILURE
        │
   ┌────┴────────┐
   │             │
TYPE 1          TYPE 2
(Hypoxemic)    (Hypercapnic = Ventilatory Failure)
   │             │
PaO2 ↓         PaO2 ↓ + PaCO2 ↑
PaCO2 N/↓      (A-a gradient can be normal)
   │
MECHANISMS:
• V/Q mismatch (most common)    [PERF without VENT]
• Diffusion impairment          [ILD, emphysema]
• Shunt (true shunt)            [ARDS, pneumonia, AVM]
• Low FiO2                      [high altitude]
• Hypoventilation               → TYPE 2 RF
DISTINGUISHING TYPE 1 vs TYPE 2
| Feature | Type 1 | Type 2 |
|---|---|---|
| PaO2 | < 60 mmHg | < 60 mmHg |
| PaCO2 | Normal or ↓ | > 45 mmHg |
| Mechanism | V/Q mismatch, shunt, diffusion | Hypoventilation |
| A-a gradient | ↑ (except high altitude) | Normal (if pure hypovent.) |
| Response to O2 | Good (except shunt) | Good, but risk of hypercapnia |
| Examples | Pneumonia, ARDS, PE, ILD, pulmonary edema | COPD exacerbation, status asthmaticus, neuromuscular disease, OHS |
ACUTE vs CHRONIC RF
| Acute | Chronic | |
|---|---|---|
| pH | ↓ (<7.35) | Near normal (compensated) |
| HCO3 | Normal | ↑ (metabolic compensation) |
| Example | Acute asthma, ARDS | COPD with chronic hypercapnia |
MANAGEMENT PRINCIPLES
ASSESS AIRWAY, BREATHING, CIRCULATION
        │
        ▼
SUPPLEMENTAL OXYGEN
(Type 1: FiO2 titrate to SpO2 94-98%)
(Type 2 COPD: SpO2 88-92%, avoid O2 toxicity)
        │
        ▼
NON-INVASIVE VENTILATION (NIV)
CPAP: Type 1 (ARDS, cardiogenic edema, OSA)
BiPAP: Type 2 (COPD exacerbation, OHS, NMD)
        │
        ▼
INVASIVE MECHANICAL VENTILATION
(If NIV fails or contraindicated)
• Lung protective strategy in ARDS (TV 6 mL/kg IBW)
• PEEP to maintain FRC
SAQ 3. Hypersensitivity Pneumonitis [10 marks | 2020]
DEFINITION
COMMON ANTIGENS & OCCUPATIONAL EXAMPLES
| Disease | Antigen | Source |
|---|---|---|
| Farmer's Lung | Thermophilic actinomycetes | Moldy hay |
| Bird Fancier's Lung | Avian proteins | Pigeons, parrots, budgies |
| Humidifier Lung | Bacterial/fungal | Air conditioners |
| Bagassosis | Thermoactinomyces sacchari | Sugar cane bagasse |
| Mushroom worker | T. vulgaris | Mushroom compost |
| Cheese washer | Penicillium | Cheese |
CLASSIFICATION (Current)
HYPERSENSITIVITY PNEUMONITIS
        │
   ┌────┴────────────┐
   │                 │
NON-FIBROTIC HP    FIBROTIC HP
(= Acute/subacute) (= Chronic HP)
   │                 │
Ground glass        Honeycombing
+ centrilobular     UIP or NSIP pattern
nodules             Poor prognosis
Good prognosis
after removal
PATHOGENESIS
REPEATED ANTIGEN INHALATION
        │
        ▼
INNATE + ADAPTIVE IMMUNE RESPONSE
• Complement activation (Type III - immune complex)
• T-cell mediated (Type IV - delayed)
        │
        ▼
ALVEOLAR MACROPHAGE ACTIVATION
TH1/TH17 response → IL-17, TNF-α, TGF-β
        │
        ▼
GRANULOMA FORMATION (poorly formed)
+ LYMPHOCYTIC ALVEOLITIS
        │
        ▼
With continued exposure:
FIBROSIS (irreversible)
CLINICAL FEATURES
| Phase | Presentation |
|---|---|
| Acute HP | 4-8 hrs after exposure: fever, chills, myalgia, dyspnea, dry cough. Resolves in 24-48 hrs without further exposure |
| Subacute HP | Weeks to months: progressive dyspnea, weight loss, productive cough |
| Chronic/Fibrotic HP | Progressive dyspnea, Velcro crackles, clubbing, cor pulmonale |
INVESTIGATIONS
- HRCT: Centrilobular nodules + GGO + mosaic attenuation (air trapping) in acute; fibrosis in chronic
- BAL: Lymphocytosis >20-40% (CD4:CD8 ratio < 1, inverted)
- Serum precipitins: IgG against specific antigens (supports exposure but not diagnostic)
- PFTs: Restrictive pattern + ↓DLCO (acute) or mixed (chronic)
- Lung biopsy: Poorly formed non-necrotizing granulomas + lymphocytic bronchiolitis
DIAGNOSIS (Multidisciplinary)
- Exposure history + consistent HRCT + BAL lymphocytosis + precipitins
MANAGEMENT
- Antigen avoidance (most important - can lead to resolution in non-fibrotic HP)
- Prednisolone: 0.5-1 mg/kg/day x 4 weeks for acute/subacute
- Fibrotic HP: Immunosuppression (MMF/azathioprine) + consider anti-fibrotic if progressive
- Lung transplantation for end-stage disease
SAQ 4. Asthma-COPD Overlap Syndrome (ACOS) [10 marks | 2019]
DEFINITION (GINA/GOLD 2022)
DIAGNOSTIC APPROACH
MAJOR FEATURES (Must have ≥3 from ASTHMA + ≥3 from COPD):

ASTHMA features:          COPD features:
• Onset <40 yrs           • Onset >40 yrs
• Episodic wheeze         • Exertional dyspnea (constant)
• Nocturnal symptoms      • Persistent symptoms
• Allergy/atopy           • History of smoking
• FEV1 reversibility      • Post-BD FEV1/FVC <0.7
  >12% + 400 mL            Incompletely reversible
• IgE ↑, eosinophilia     • DLCO may be reduced
KEY FEATURES OF ACOS
| Feature | Detail |
|---|---|
| Post-bronchodilator FEV1/FVC | < 0.70 (persistent airflow limitation) |
| Reversibility | FEV1 >12% AND >200 mL (but incomplete) |
| Eosinophils in sputum/blood | Often elevated |
| Atopy | History of asthma, allergy |
| Age | Usually >40 years |
| HRCT | Air trapping (COPD) + remodeling |
TREATMENT PRINCIPLES
ACOS TREATMENT APPROACH

Step 1: LOW-DOSE ICS (essential - differentiates from pure COPD)
+ LABA (for bronchodilation)
        │
If inadequate response:
Step 2: Add LAMA (tiotropium)
ICS + LABA + LAMA (triple therapy)
        │
Step 3: Treat comorbidities
• Rhinitis (intranasal steroids)
• GERD
• OSA
        │
Avoid: SABA/SAMA monotherapy alone
Avoid: ICS alone (need bronchodilator)
SAQ 5. Ventilator-Associated Pneumonia (VAP) [10 marks | 2019]
DEFINITION
PATHOGENESIS
INTUBATION → BYPASSES NORMAL DEFENSES (cough, mucociliary, epiglottis)
        │
        ▼
MICROASPIRATION OF OROPHARYNGEAL/GASTRIC SECRETIONS
        │
        ▼
COLONIZATION OF ENDOTRACHEAL TUBE
(biofilm formation - resistant organisms)
        │
        ▼
BACTERIAL INOCULATION OF LOWER AIRWAYS
        │
        ▼
PNEUMONIA
ORGANISMS
| VAP Type | Organisms | Antibiotics |
|---|---|---|
| Early VAP (<5 days) | S. pneumoniae, H. influenzae, MSSA, enteric GNBs | Standard beta-lactam |
| Late VAP (≥5 days) | MRSA, Pseudomonas, Acinetobacter, Klebsiella (MDR) | Carbapenem ± vancomycin/colistin |
DIAGNOSIS (CPIS Score or Clinical Criteria)
- New/progressive infiltrate on CXR
- Fever >38.3°C or hypothermia <36°C
- WBC >12,000 or <4,000
- Purulent secretions
- Positive lower respiratory culture
TREATMENT
- Empirical: Based on local antibiogram, early vs. late, risk factors
- Late VAP empiric: anti-pseudomonal beta-lactam (pip-tazo or cefepime) + vancomycin (if MRSA risk) ± aminoglycoside
- Duration: 7-8 days (same efficacy as longer courses)
PREVENTION (VAP BUNDLE)
H - Head of bed elevation 30-45°
A - Avoid unnecessary antibiotics
N - Nasogastric/oral route (avoid nasal = sinusitis risk)
D - Daily sedation holidays + readiness to extubate
S - Subglottic secretion drainage (specialized ETT)
    (Oral chlorhexidine decontamination)
    (SDD - Selective decontamination of digestive tract)
    (Strict hand hygiene)
SAQ 6. Management of Status Asthmaticus [10 marks | 2022]
DEFINITION
LIFE-THREATENING FEATURES (Silent chest, cyanosis, altered consciousness, paradoxical breathing, PaCO2 rising)
MANAGEMENT FLOWCHART
STATUS ASTHMATICUS - MANAGEMENT ALGORITHM

IMMEDIATE ASSESSMENT
• SpO2, ABG, PEFR, RR, HR, BP, consciousness
• CXR (pneumothorax? pneumonia?)
        │
        ▼
STEP 1: OXYGEN (FiO2 titrate to SpO2 94-98%)
        │
        ▼
STEP 2: BRONCHODILATORS
• Salbutamol (albuterol) nebulized: 2.5-5 mg every 20 mins
  (or continuous nebulization)
• Ipratropium bromide: 0.5 mg nebulized every 20 mins x 3 doses
  (adds benefit to SABA)
        │
        ▼
STEP 3: SYSTEMIC CORTICOSTEROIDS (EARLY - within 1 hr)
• IV hydrocortisone 100-200 mg every 6 hrs
  OR oral prednisolone 40-50 mg/day (equally effective if oral tolerated)
• Onset: 6-12 hours
        │
        ▼
STEP 4: IV MAGNESIUM SULFATE (if not improving)
• 2g IV over 20 minutes
• Mechanism: smooth muscle relaxation, anti-inflammatory
• Safe in pregnancy
        │
        ▼
STEP 5: HELIOX (70% helium + 30% O2)
• Reduces airway resistance (density)
• Used to drive nebulizers in severe cases
        │
        ▼
STEP 6: IV BRONCHODILATORS (ICU)
• IV aminophylline (loading 6 mg/kg, then 0.5 mg/kg/hr - if not on theophylline)
• IV salbutamol (if unable to nebulize)
• Ketamine infusion (bronchodilator + sedative for intubation)
        │
        ▼
STEP 7: MECHANICAL VENTILATION (last resort)
• Indication: exhaustion, altered consciousness, hypercapnia (rising CO2)
• Strategy: PERMISSIVE HYPERCAPNIA
  - Low RR (8-12/min), long expiratory time (I:E = 1:3-5)
  - High peak pressures common - tolerate if plateau <35 cmH2O
  - Risk of barotrauma, air trapping (auto-PEEP)
• Ketamine for induction (bronchodilator)
        │
        ▼
STEP 8: EXTRACORPOREAL (ECMO) - if ventilator management fails
MONITORING & DISCHARGE CRITERIA
- PEFR > 75% predicted before discharge
- SpO2 > 95% on room air
- Oral prednisolone for 5-7 days on discharge
- Step up inhaler therapy (add ICS/LABA)
- Review trigger factors
SAQ 7. Brittle Asthma [10 marks | 2025, 2023]
DEFINITION
CLASSIFICATION (Ayres Classification)
| Type | Type 1 Brittle Asthma | Type 2 Brittle Asthma |
|---|---|---|
| Pattern | Persistent chaotic variability | Sudden severe attacks on background of good control |
| PEFR | Wide swings >40% diurnal variation for >50% of days over ≥150 days despite maximal therapy | Normal or near-normal between episodes |
| Attacks | Continuous | Sudden, unpredictable |
| Pathology | Non-eosinophilic | Mast cell + eosinophil (food-induced) |
| Prognosis | Morbid - ↓ quality of life | Higher risk of fatal attacks |
| Treatment | High-dose ICS, LABA, consider SC terbutaline pump | Emergency epinephrine, self-injectable |
KEY FEATURES
- Predominantly women
- Psychological/social factors contribute
- Food allergy association (especially Type 2: shellfish, wheat, peanut)
- Risk of sudden asphyxic death
MANAGEMENT
TYPE 1:
• High-dose ICS (fluticasone 2000 mcg/day)
• LABA (formoterol or salmeterol)
• Continuous subcutaneous terbutaline pump
• Anti-IgE (omalizumab) if IgE-mediated
• Anti-IL5 (mepolizumab/benralizumab) if eosinophilic

TYPE 2:
• Pre-loaded self-administered epinephrine (EpiPen 0.3 mg IM)
• Patient education - emergency protocol
• ICU-level care for attacks
• Omalizumab if allergic trigger
• Home NIV/CPAP in some cases
SAQ 8. Solitary Pulmonary Nodule - Diagnostic Approach [10 marks | 2017]
DEFINITION
DIFFERENTIAL DIAGNOSIS
- Primary lung cancer (adenocarcinoma most common as SPN)
- Metastasis (breast, colon, sarcoma, kidney, thyroid)
- Carcinoid tumor
- Granuloma (most common benign - TB, histoplasma)
- Hamartoma (popcorn calcification on CT)
- Arteriovenous malformation
- Round pneumonia
- Pulmonary infarct (Hampton's hump)
- Rheumatoid nodule
HIGH-RISK FEATURES FOR MALIGNANCY
- Age > 50
- Heavy smoker
- Spiculated margins ("corona radiata")
- Size > 2 cm
- Upper lobe location
- Growth on serial CT
- History of prior malignancy
DIAGNOSTIC ALGORITHM (Fleischner Society Guidelines 2017)
SOLITARY PULMONARY NODULE FOUND ON CT
        │
   ┌────┴──────────────────────┐
SOLID nodule              SUBSOLID nodule
   │                           │
<6 mm: No follow-up         GGO <6mm: No follow-up
6-8 mm: CT at 6-12 months   GGO ≥6mm: CT at 3-6 months
>8 mm:                      Part-solid: CT at 3-6 months
        │
        ▼
RISK STRATIFICATION (Mayo Clinic Model / Brock Model)
• Size, spiculation, location, age, smoking
        │
   ┌────┴────────────────┐
LOW risk (<5%)          HIGH risk (>65%)
(<8 mm, smooth, young)  (>8 mm, spiculated, smoker)
   │                           │
Follow-up CT               PET-CT SCAN
at 3-6 months              (FDG uptake SUV >2.5 = malignant)
                                │
                                ▼
                           TISSUE BIOPSY
                    CT-guided FNAC (peripheral)
                    Bronchoscopy + EBUS (central)
                    VATS resection (diagnostic + therapeutic)

BENIGN CALCIFICATION PATTERNS (SAFE - no biopsy needed)
- Popcorn = Hamartoma
- Laminar/central/diffuse = Granuloma
- Bull's eye = Granuloma (histoplasma)
MALIGNANT PATTERNS
- Eccentric, stippled, or amorphous calcification
SAQ 9. Allergic Bronchopulmonary Aspergillosis (ABPA) [10 marks | 2025]
DEFINITION
PATHOGENESIS
ASPERGILLUS FUMIGATUS spore inhalation
(in asthmatic/CF airways)
        │
        ▼
COLONIZATION (not invasive infection)
        │
        ▼
TYPE I HYPERSENSITIVITY (IgE-mediated)
→ Immediate bronchoconstriction
        +
TYPE III HYPERSENSITIVITY (immune complex)
→ Complement activation → airway inflammation
        +
TYPE IV (T-cell) - late phase
        │
        ▼
EOSINOPHILIC INFLAMMATION OF AIRWAYS
MUCUS PLUGGING
CENTRAL BRONCHIECTASIS (pathognomonic)
        │
        ▼
PROGRESSIVE PULMONARY FIBROSIS (if untreated)
CLINICAL FEATURES
- Background of asthma (or CF)
- Recurrent wheezing, expectoration of brownish mucus plugs
- Low-grade fever
- Hemoptysis (uncommon)
- Chest pain
- Eosinophilia in blood (peripheral)
DIAGNOSTIC CRITERIA (Rosenberg-Patterson / ISHAM 2013)
| Criteria | Test | Cut-off |
|---|---|---|
| Immediate skin test positivity | Aspergillus skin prick test | Wheal ≥3 mm |
| Elevated serum total IgE | Serum IgE | > 1000 IU/mL |
| Aspergillus-specific IgE (serum) | RAST/ImmunoCAP | Positive |
| Aspergillus-specific IgG (serum) | Precipitins | Positive |
| Peripheral eosinophilia | Blood count | > 500 cells/µL |
| CXR/CT findings | - | Central bronchiectasis |
RADIOLOGY (Hallmark)
- Fleeting consolidation (moves from lobe to lobe)
- Finger-in-glove opacity (mucus impaction)
- Central bronchiectasis (proximal, upper lobe)
- "Tram track" and "ring shadows"
STAGING (Patterson 5 stages)
| Stage | Description |
|---|---|
| I | Acute (new presentation) |
| II | Remission (IgE ↓ 35% after treatment) |
| III | Exacerbation |
| IV | Corticosteroid-dependent asthma |
| V | Fibrotic (permanent lung damage) |
TREATMENT
FIRST LINE: ORAL PREDNISOLONE
• Acute: 0.5 mg/kg/day x 2 weeks, then 0.5 mg/kg alternate days
• Taper over 6-12 months guided by IgE levels
• IgE should fall ≥35% = remission

ADD: ITRACONAZOLE 200 mg BD x 4-6 months
(Reduces antigen load, steroid-sparing effect)
• Voriconazole if itraconazole resistant/intolerant

MONITORING:
• Serum total IgE every 6-8 weeks initially
  (Rising IgE = exacerbation; falling = remission)
• HRCT for progression
• PFTs

BIOLOGICS (refractory cases):
• Omalizumab (anti-IgE)
• Benralizumab (anti-IL5Rα) for eosinophilic disease
SAQ 10. DOTS Plus [10 marks | 2017]
BACKGROUND
MDR-TB DEFINITION
- Resistance to at least Isoniazid (H) AND Rifampicin (R) - the two most potent first-line drugs
- XDR-TB: MDR + resistance to any fluoroquinolone + at least one injectable agent
- Pre-XDR TB (2021 WHO definition): MDR + any fluoroquinolone resistance
DOTS PLUS COMPONENTS (5 Core Elements)
1. POLITICAL COMMITMENT & ADMINISTRATIVE SUPPORT
   (Sustained financing, national MDR-TB program)

2. RATIONAL USE OF 2ND LINE DRUGS (SLDs)
   (Quality-assured drugs, avoid monotherapy)

3. DIAGNOSIS (DRUG SUSCEPTIBILITY TESTING - DST)
   Sputum smear + Culture + DST (Xpert MTB/RIF)
   Solid media: LJ (3-4 weeks)
   Liquid media: MGIT (1-2 weeks)
   Rapid: Line Probe Assay (LPA)/GenoType MTBDRplus

4. DIRECTLY OBSERVED THERAPY (DOT)
   Treatment supervision throughout entire course

5. CASE MANAGEMENT & RECORDING/REPORTING
WHO MDR-TB TREATMENT (2022 BPaL Regime)
Current WHO Preferred Regimen (2022)
SHORTER REGIMEN (BPaLM - 6 months):
B = Bedaquiline (6 months)
Pa = Pretomanid
L = Linezolid 600 mg
M = Moxifloxacin (if susceptible)

CONVENTIONAL LONGER REGIMEN (18-20 months):
Intensive phase (6 months):
• Bedaquiline + Levofloxacin + Linezolid + Clofazimine
• (Kanamycin/Amikacin avoided now due to toxicity)

Continuation phase (12-14 months):
• Levofloxacin + Linezolid + Clofazimine + (Ethambutol or Pyrazinamide)
Drug Classification (WHO 2022)
| Group | Drugs | Use |
|---|---|---|
| A (Always include) | Levofloxacin, Bedaquiline, Linezolid | Core of regimen |
| B (Add next) | Clofazimine, Cycloserine | To complete regimen |
| C (Add if needed) | Ethambutol, Delamanid, Imipenem, Amikacin, Ethionamide | Fill gap |
MONITORING
- Monthly sputum smear + culture
- LFTs (linezolid, ethionamide)
- ECG (QTc prolongation: bedaquiline, moxifloxacin)
- Audiometry (aminoglycosides)
- Vision (ethambutol)
SAQ 11. Obesity Hypoventilation Syndrome (OHS) [10 marks | 2025]
DEFINITION
- Obesity (BMI ≥ 30 kg/m²)
- Daytime hypercapnia (PaCO2 > 45 mmHg)
- No other cause of hypoventilation (COPD, neuromuscular disease, chest wall deformity ruled out)
Named after Joe, the fat boy in Dickens' "The Pickwick Papers" who always fell asleep
PATHOPHYSIOLOGY
MORBID OBESITY
        │
   ┌────┴────────────────────────────────┐
MECHANICAL                          CENTRAL
(Reduced chest wall compliance)    (Impaired respiratory drive)
   │                                    │
↑ Work of breathing                Reduced hypercapnic
Fat on chest + abdomen             ventilatory response
↑ FRC ↓ ERV                       Leptin resistance
Airway collapse (OSA)              (leptin normally stimulates breathing)
   │                                    │
   └────────────┬───────────────────────┘
                │
                ▼
         SLEEP-DISORDERED BREATHING
         (Obstructive Sleep Apnea in 90% of OHS)
                │
                ▼
    NOCTURNAL HYPOVENTILATION
    (PaCO2 rises during sleep)
                │
                ▼
    DAYTIME HYPERCAPNIA
    (Blunted CO2 response persists into wakefulness)
                │
                ▼
    POLYCYTHEMIA + PULMONARY HYPERTENSION
    + COR PULMONALE + RIGHT HEART FAILURE
CLINICAL FEATURES
| System | Features |
|---|---|
| General | Morbid obesity (BMI often >40), hypersomnolence, fatigue |
| Respiratory | Dyspnea on exertion, plethoric face, cyanosis |
| Sleep | Loud snoring, witnessed apneas, excessive daytime sleepiness |
| CVS | Pulmonary hypertension, right heart failure, peripheral edema |
| Hematology | Polycythemia (secondary, due to chronic hypoxia) |
| Neurological | Morning headache (CO2 retention), cognitive impairment |
INVESTIGATIONS
| Test | Finding |
|---|---|
| ABG | PaCO2 > 45 mmHg, PaO2 ↓, HCO3 ↑ (metabolic compensation) |
| Serum HCO3 | > 27 mEq/L (screening test - cheap, easy) |
| Polysomnography | OSA (AHI >5), REM hypoventilation |
| PFTs | Restrictive pattern (↓TLC, ↓FRC, ↓ERV) |
| Echo | Pulmonary hypertension, RV enlargement |
| CXR | Cardiomegaly, increased vascular markings |
| CRP, TFTs | Rule out other causes |
OHS vs SIMPLE OBESITY vs OSA
| Feature | Obesity alone | OSA alone | OHS |
|---|---|---|---|
| Daytime CO2 | Normal | Normal | ↑ (>45 mmHg) |
| HCO3 | Normal | Normal | ↑ (>27) |
| OSA | May have | Yes | 90% have OSA too |
| Polycythemia | Rare | Occasional | Common |
MANAGEMENT FLOWCHART
OHS MANAGEMENT STEPS:

1. WEIGHT LOSS (most definitive treatment)
   • 10% weight loss can reverse OHS
   • Bariatric surgery (BMI >40 or >35 with comorbidity)

2. NON-INVASIVE VENTILATION (primary treatment)
   CPAP (if severe OSA): 10-15 cmH2O
   BiPAP/NIV (if OHS without severe OSA or CPAP failure):
   IPAP 14-20, EPAP 4-8 cmH2O
   Used nightly (at least 4 hrs/night)
   Improves PaCO2, reduces polycythemia, improves QoL

3. SUPPLEMENTAL OXYGEN
   Only as adjunct to PAP therapy (not alone)

4. ACUTE DECOMPENSATION (ICU):
   NIV (BiPAP) first-line
   Intubation if NIV fails
   Avoid sedatives/opioids (worsen hypoventilation)

5. TREAT COMORBIDITIES:
   Phlebotomy for symptomatic polycythemia
   Diuretics for right heart failure
   PAH therapy if confirmed pulmonary hypertension
QUICK REVISION SUMMARY TABLE
| Topic | Key Mnemonic / One-liner |
|---|---|
| PFT patterns | Obstructive: FEV1/FVC ↓; Restrictive: TLC ↓; Mixed: both |
| ILD types | DIPF = DIP, IPF (UIP), NSIP, COP, AIP (acute) |
| IPF treatment | Pirfenidone or Nintedanib - NO steroids |
| HP | Antigen inhalation → Type III + IV → granulomas → treat with antigen avoidance |
| Status asthmaticus | O2 + Salbutamol + Steroids + MgSO4 → ICU → ventilate with permissive hypercapnia |
| ACOS | ICS always needed (unlike pure COPD); incomplete reversibility (unlike pure asthma) |
| VAP bundle | HANDS: Head up, Avoid antibiotics, Nasal vs oral, Daily wake-up, Subglottic drainage |
| ABPA | IgE >1000 + skin test + central bronchiectasis + eosinophilia → Steroids + Itraconazole |
| DOTS Plus | MDR-TB: BPaLM regimen (Bedaquiline + Pretomanid + Linezolid + Moxifloxacin) |
| OHS | Obese + CO2 >45 + screen with HCO3 >27 → NIV/BiPAP + weight loss |
| Brittle Asthma | Type 1: persistent variability (SC terbutaline pump); Type 2: sudden fatal attacks (EpiPen) |
| SPN | <6 mm: no follow-up; >8 mm: PET-CT + biopsy; popcorn Ca = hamartoma (benign) |
| Inflammatory myopathy | DM: Heliotrope + Gottron + anti-Jo1; IBM: no steroid response, rimmed vacuoles |
| Respiratory failure | Type 1: V/Q mismatch, PaCO2 N/↓; Type 2: hypoventilation, PaCO2 ↑ |
Sources: Murray & Nadel's Textbook of Respiratory Medicine; Goldman-Cecil Medicine; Fishman's Pulmonary Diseases; Harrison's Principles of Internal Medicine; WHO TB Guidelines 2022