
Describe lumbar facia and its attachments simply
lumbar thoracolumbar fascia layers attachments anatomy diagram
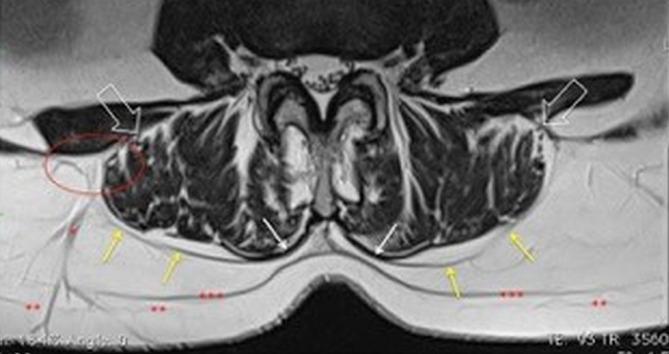
This diagnostic axial MRI scan demonstrates the detailed anatomy of the posterior lumbar musculature and fascial layers. The image highlights the Thoracolumbar Fascia (FTL) and its relationship to the erector spinae muscles. Yellow arrows indicate the posterior lamina of the FTL, while white open arrows denote the anterior lamina; these two layers are seen converging at the lateral raphe (red oval). The epimysium of the erector spinae is marked by white arrows, showing a distinctive fusion or lack of a fat plane where it becomes inseparable from the FTL near the spinous processes. Subcutaneous tissue organization is visible, with the superficial subcutaneous fascia marked by double asterisks (**) and the deep subcutaneous fascia marked by triple asterisks (***). A venous vessel is also seen traversing from the lateral raphe toward the skin. This educational image illustrates the compartmentalization of paraspinal muscles and the biomechanical integration between muscular epimysium and aponeurotic fasciae, relevant for understanding myofascial force transmission and low back pain pathologies.
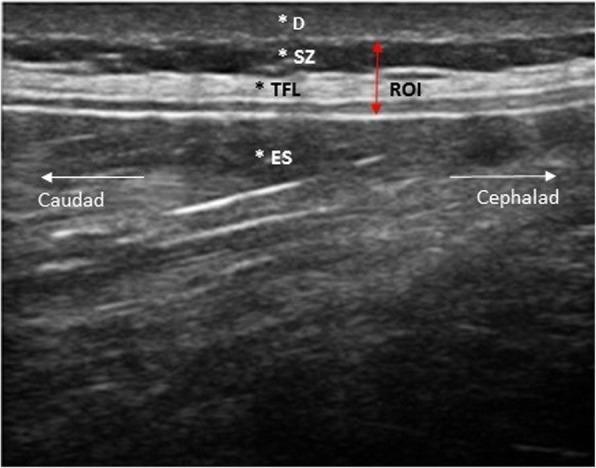
This diagnostic image is a high-frequency (18 MHz) ultrasound in a longitudinal/parasagittal plane of the lumbar region (L2-L3 level), illustrating the musculoskeletal anatomy of the posterior trunk. The sonogram demonstrates four distinct anatomical layers from superficial to deep: the dermis (D), which appears as a thin, relatively hypoechoic superficial boundary; the subcutaneous zone (SZ), a slightly more echogenic fatty layer; the thoracolumbar fascia (TFL), visualized as a prominent, highly echogenic (hyperechoic) linear band; and the erector spinae (ES) muscle, appearing as a thick, heterogeneous layer with characteristic linear, hyperechoic striations. A vertical double-headed red arrow defines a Region of Interest (ROI) spanning from the subcutaneous zone through the thoracolumbar fascia. Orientation markers indicate the caudal direction to the left and cephalad direction to the right. The image serves as an educational reference for identifying fascial planes and paraspinal muscle architecture, specifically for evaluating the organization and morphology of the perimuscular connective tissue.
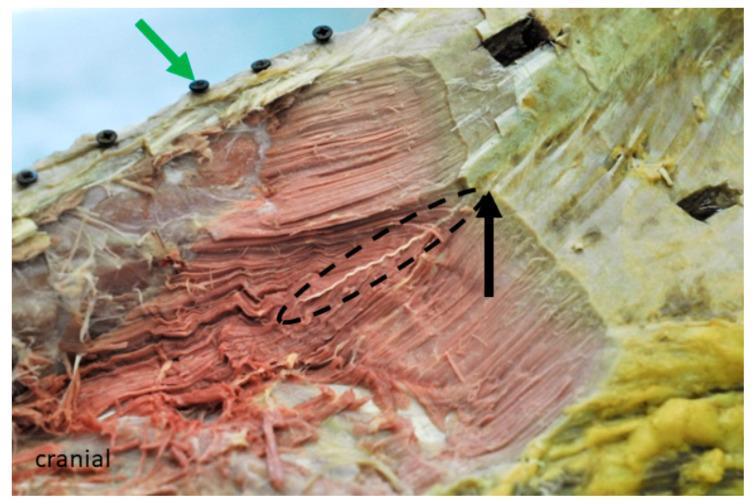
This clinical anatomical photograph shows a cranio-lateral view of a formalin-fixed dissection of the lumbar longissimus muscle (LG) at the level of the 16th rib. The specimen displays the complex architecture of muscle fascicles within the thoracolumbar region. A green arrow indicates a reference screw inserted into the spinous process of the 15th thoracic vertebra (T15), used for spatial digitization and CT alignment. The dissection reveals the internal organization of the muscle, where a prominent fascia (indicated by a black arrow) bifurcates the muscle into suprafascial and subfascial bellies. The fascicles in the dorsal compartment exhibit a more horizontal, parallel orientation, while deeper layers show varying pennation angles as they originate from the inner fascia. The tissue appears pale due to formalin fixation, and the overlying aponeurosis has been partially ablated to expose the multifidus muscle origin and the deeper fascicular pathways. This visual serves as an educational reference for understanding paraspinal muscle compartmentalization and functional anatomy in biomechanical modeling.
The Lumbar (Thoracolumbar) Fascia
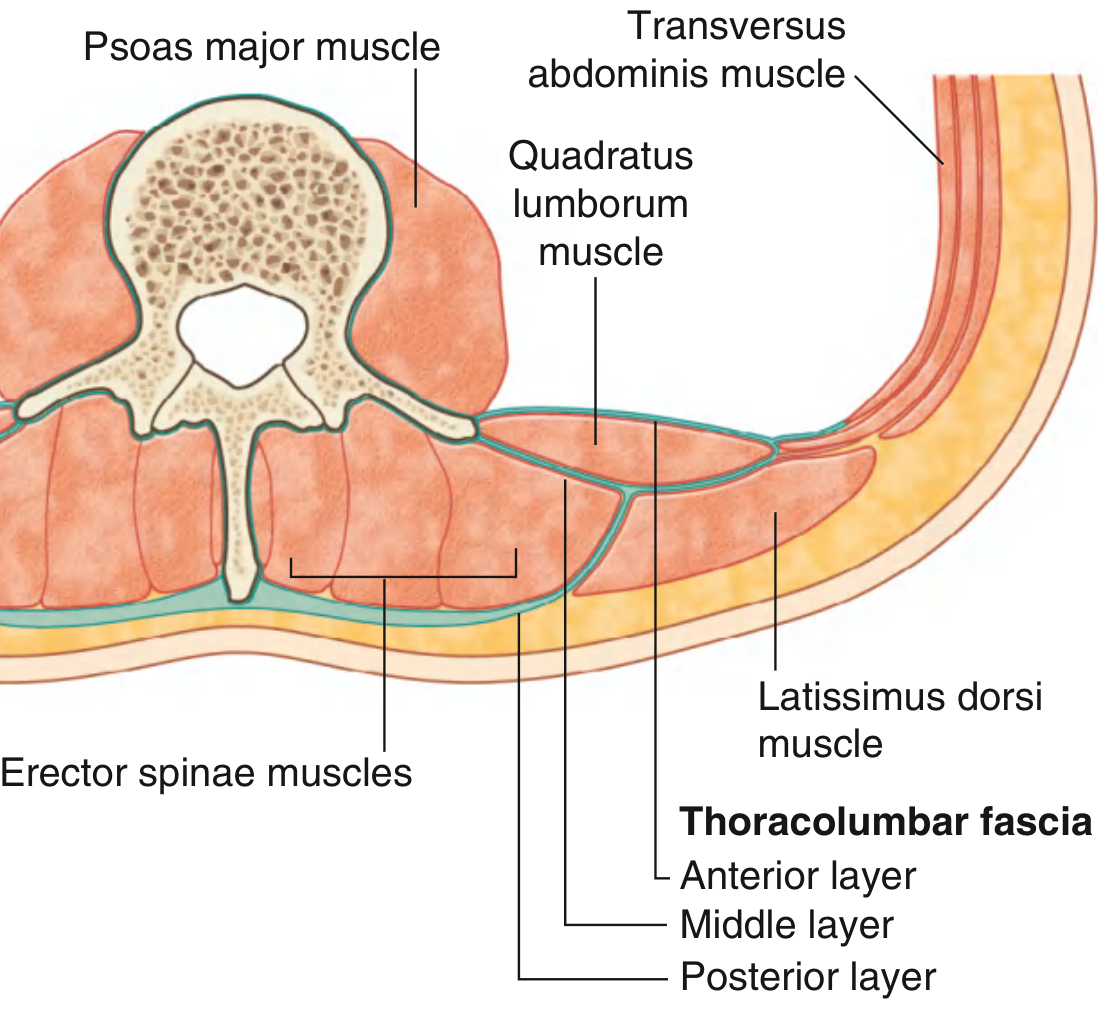
The Three Layers (from back to front)
| Layer | What it covers | Medial attachment | Other attachments |
|---|---|---|---|
| Posterior (superficial) | Covers and encloses the erector spinae | Spinous processes of lumbar & sacral vertebrae + supraspinous ligament | Extends laterally over the erector spinae |
| Middle | Sits between erector spinae and quadratus lumborum | Tips of transverse processes of lumbar vertebrae + intertransverse ligaments | Inferiorly: iliac crest; Superiorly: lower border of rib 12 |
| Anterior (deep) | Covers the front surface of quadratus lumborum | Transverse processes of lumbar vertebrae | Inferiorly: iliac crest; Superiorly: forms the lateral arcuate ligament (for diaphragm attachment) |
How the layers meet
- The posterior and middle layers join together at the outer edge of the erector spinae muscles (the "lateral raphe").
- At the outer border of quadratus lumborum, the anterior layer joins them - and this combined edge becomes the aponeurotic (tendinous) origin for the transversus abdominis muscle of the abdominal wall.
Muscles that attach to / originate from the thoracolumbar fascia
| Muscle | Relationship |
|---|---|
| Latissimus dorsi | Large tendon originates from the superficial (posterior) layer |
| Transversus abdominis | Originates from the lateral margin where all three layers meet |
| Erector spinae (iliocostalis lumborum) | Originates partly from the superficial layer |
| Serratus posterior inferior | Blends into the fascia in the thoracic region |
| Diaphragm | Attaches via the lateral arcuate ligament, which is formed by the anterior layer |
Simple way to remember it
- The posterior layer sits behind the erector spinae (the big column muscles).
- The middle layer sits between erector spinae and quadratus lumborum.
- The anterior layer sits in front of quadratus lumborum.
So thoracolumbar facia and lumbar facia are the same
- "Lumbar fascia" = the TLF at the lumbar level
- "Thoracolumbar fascia" = the whole structure from thorax to lumbar/sacral region
Abdominal aorta and its branches in a single image
abdominal aorta and all branches diagram anatomy labeled
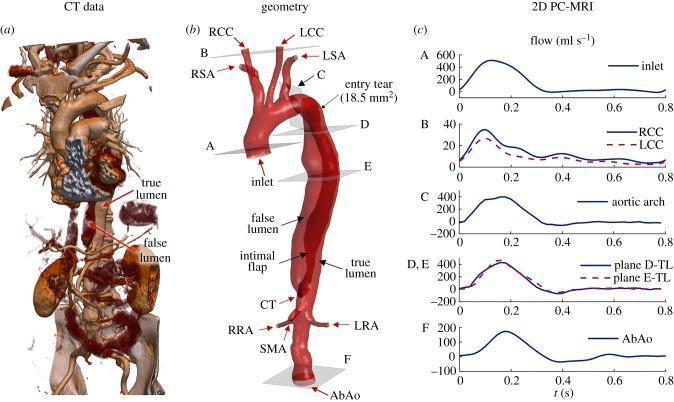
This medical figure presents a multi-modal analysis of a chronic Stanford type B aortic dissection. (a) A CT angiography rendering demonstrates the complex vascular anatomy, highlighting the separation of the true lumen and false lumen by an intimal flap. (b) A 3D reconstructed anatomical diagram details the dissection geometry, originating distal to the left subclavian artery (LSA) and extending through the descending aorta to the abdominal aorta (AbAo). Key supra-aortic branches are labeled, including the right/left subclavian (RSA, LSA) and common carotid arteries (RCC, LCC). Main visceral branches shown include the coeliac trunk (CT), superior mesenteric artery (SMA), and renal arteries (RRA, LRA). A proximal entry tear of 18.5 mm² is identified. (c) Time-resolved 2D PC-MRI flow-rate curves (ml/s) quantify hemodynamic variations across several planes (A–F), including the inlet, supra-aortic branches, and true lumen segments. This figure serves as an educational tool for understanding the pathophysiology and fluid dynamics of aortic dissections.
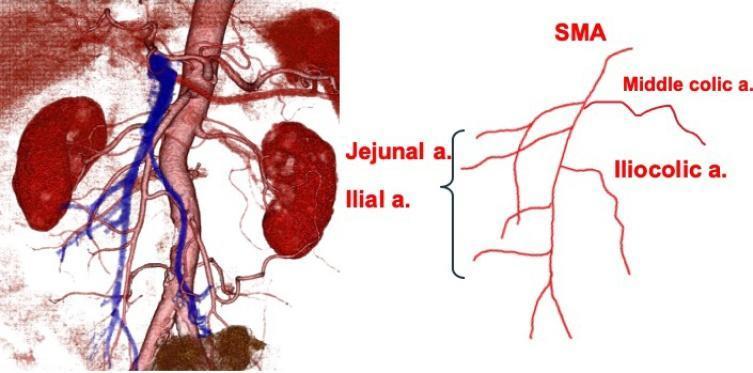
This visual contains a pair of images depicting abdominal vascular anatomy via three-dimensional computed tomography (3D-CT) angiography and a corresponding schematic line diagram. The 3D reconstruction shows the abdominal aorta in red and the inferior vena cava in blue, situated between the kidneys. The primary focus is the superior mesenteric artery (SMA) and its branching pattern. In this specific clinical case, the jejunal and ileal arteries are shown originating from the right side of the SMA, while the ileocolic and middle colic arteries branch from the left side. This inverted vascular orientation relative to the SMA is a key diagnostic indicator of intestinal malrotation (non-rotation type). The schematic on the right provides clear labels for the SMA and its primary branches to illustrate this atypical spatial relationship. The content serves as an educational resource for surgical gastroenterology and radiology in identifying anatomical variations of the mesenteric vasculature.
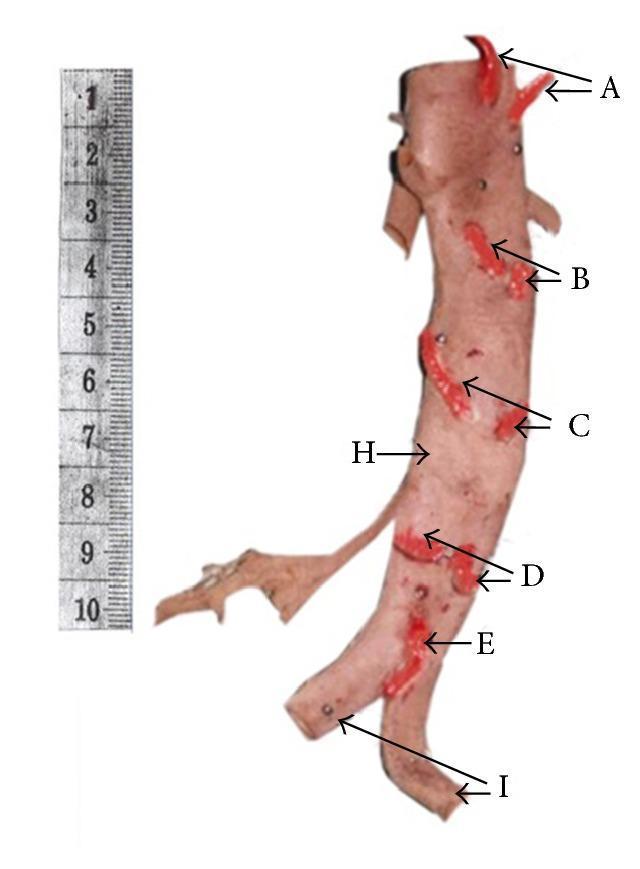
This clinical photograph displays a posterior view of a dissected and fixed human abdominal aorta (labeled H), showcasing the typical origin and spatial distribution of its dorsal parietal branches. Four pairs of lumbar arteries (labeled A through D) are identified sequentially from superior to inferior, emerging laterally from the posterior aspect of the aortic wall at regular intervals. Each lumbar artery has been highlighted in red to clearly delineate its origin and initial course. Distally, the median sacral artery (labeled E) is visible as an unpaired vessel arising from the posterior surface of the aorta just proximal to its bifurcation into the left and right common iliac arteries (labeled I). A 10-centimeter metric scale is positioned adjacent to the specimen to provide a reference for the anatomical dimensions. This image serves as an educational resource for studying vascular anatomy, surgical landmarks for posterior abdominal wall procedures, and potential variations in the branching patterns of the aorta's posterior segment.
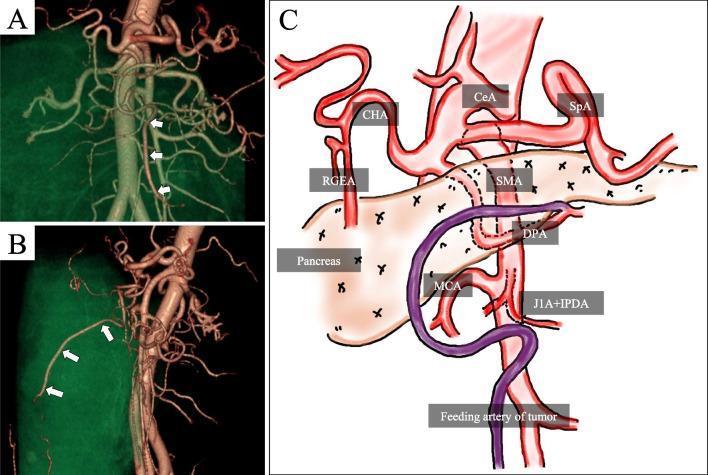
This composite image illustrates the vascular anatomy related to a retroperitoneal tumor feeding artery using 3D-CT angiography and a schematic diagram. Panels A (coronal) and B (sagittal) display 3D reconstructions of the abdominal aorta and its major branches. White arrows in both panels track a specific vessel, identified as a branch of the dorsal pancreatic artery (DPA), which serves as the primary feeding artery for a large abdominal tumor. Panel C provides a labeled schematic of this region, detailing the anatomical relationships between the celiac artery (CeA), splenic artery (SpA), common hepatic artery (CHA), and superior mesenteric artery (SMA). The DPA is shown originating from the SMA and giving rise to the tumor's feeding artery (highlighted in purple). Other visualized structures include the right gastroepiploic artery (RGEA), middle colic artery (MCA), first jejunal artery (J1A), and inferior pancreaticoduodenal artery (IPDA). This visual material is intended for advanced medical education in surgical oncology and radiology, emphasizing the use of 3D angiography for preoperative identification of tumor origins and vascular supply in complex retroperitoneal masses.
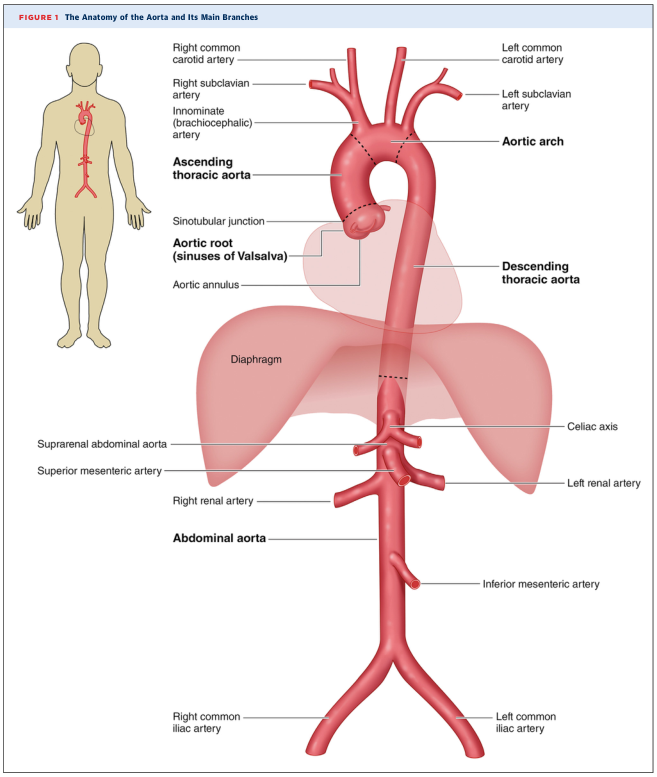
Summary : This figure illustrates the anatomy of the human aorta and its main branches, showing their spatial relationships to major organs and anatomical landmarks. illustration: # Main Structures : • The aorta is depicted as a large, central red vessel running vertically through the torso. • The aorta is divided into three main sections: ascending thoracic aorta, aortic arch, descending thoracic aorta, and abdominal aorta. • The diaphragm is shown as a translucent pink structure crossing the aorta. # Branches and Landmarks : • Ascending thoracic aorta: arises from the heart, includes the aortic root (sinuses of Valsalva) and aortic annulus. • Aortic arch: gives rise to three major branches: – Innominate (brachiocephalic) artery – Left common carotid artery – Left subclavian artery – Right common carotid artery and right subclavian artery branch from the innominate artery. • Descending thoracic aorta: continues downward through the chest. • Abdominal aorta: begins below the diaphragm and gives rise to several branches: – Celiac axis – Suprarenal abdominal aorta – Superior mesenteric artery – Right and left renal arteries – Inferior mesenteric artery – Right and left common iliac arteries (terminal branches) # Spatial Relationships : • The aorta passes posterior to the heart and anterior to the vertebral column. • The diaphragm separates the thoracic and abdominal portions of the aorta. • The abdominal aorta lies centrally and bifurcates into the right and left common iliac arteries at its lower end. # Annotations and Labels : • Each major branch and anatomical landmark is clearly labeled with leader lines. • A small human figure at left shows the aorta’s position within the body. # Analysis : • The figure provides a comprehensive overview of the aorta’s anatomy, highlighting its major branches and their order from the heart to the lower abdomen. • The spatial arrangement clarifies the transition from thoracic to abdominal aorta at the diaphragm. • The branching pattern demonstrates the aorta’s role as the main conduit for arterial blood from the heart to the rest of the body.
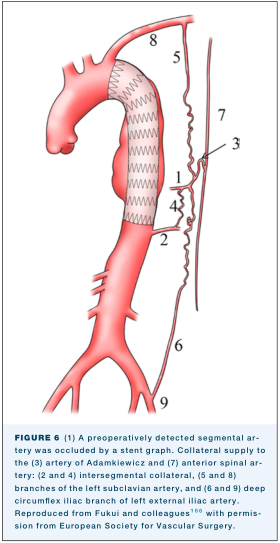
Summary : This is a medical illustration showing the anatomy of the thoracic and abdominal aorta, with a stent graft in place, and the collateral arterial supply to the spinal cord. The diagram is annotated with numbered arteries and collateral pathways, referencing their anatomical names and clinical significance. illustration: # Scene Overview : • Main subject: The thoracic and abdominal aorta, with a stent graft placed in the descending thoracic aorta. • Perspective: Sagittal (side) view of the aorta and its major branches. • Composition: The aorta is centrally depicted, with collateral arteries and spinal cord shown to the right. • Colour palette: Red for arteries, grey for stent graft, black for annotation numbers and lines. # Technical Details : • Stent graft: Shown as a grey, zigzag-patterned tube within the descending thoracic aorta. • Numbered arteries: – 1: Preoperatively detected segmental artery (occluded by stent graft). – 2, 4: Intersegmental collateral arteries. – 3: Artery of Adamkiewicz. – 5, 8: Branches of the left subclavian artery. – 6, 9: Deep circumflex iliac branch of left external iliac artery. – 7: Anterior spinal artery. • Collateral pathways: Wavy lines connecting the aorta to the spinal cord, indicating alternate blood supply routes. # Spatial Relationships : • The stent graft is placed in the upper descending thoracic aorta, occluding the segmental artery (1). • Collateral arteries (2, 4, 5, 6, 8, 9) are shown branching from the aorta and iliac arteries, connecting to the spinal cord. • The artery of Adamkiewicz (3) and anterior spinal artery (7) are highlighted as key vessels for spinal cord perfusion. # Analysis : • The illustration emphasizes the importance of collateral circulation to the spinal cord when a segmental artery is occluded by a stent graft. • Multiple collateral pathways are depicted, suggesting redundancy in spinal cord blood supply. • The diagram is useful for understanding vascular anatomy relevant to aortic stent grafting and spinal cord protection.
- Celiac axis - unpaired, supplies abdominal foregut
- Superior mesenteric artery - unpaired, supplies midgut
- Renal arteries (right and left) - paired, to the kidneys
- Inferior mesenteric artery - unpaired, supplies hindgut
- Common iliac arteries (right and left) - terminal bifurcation