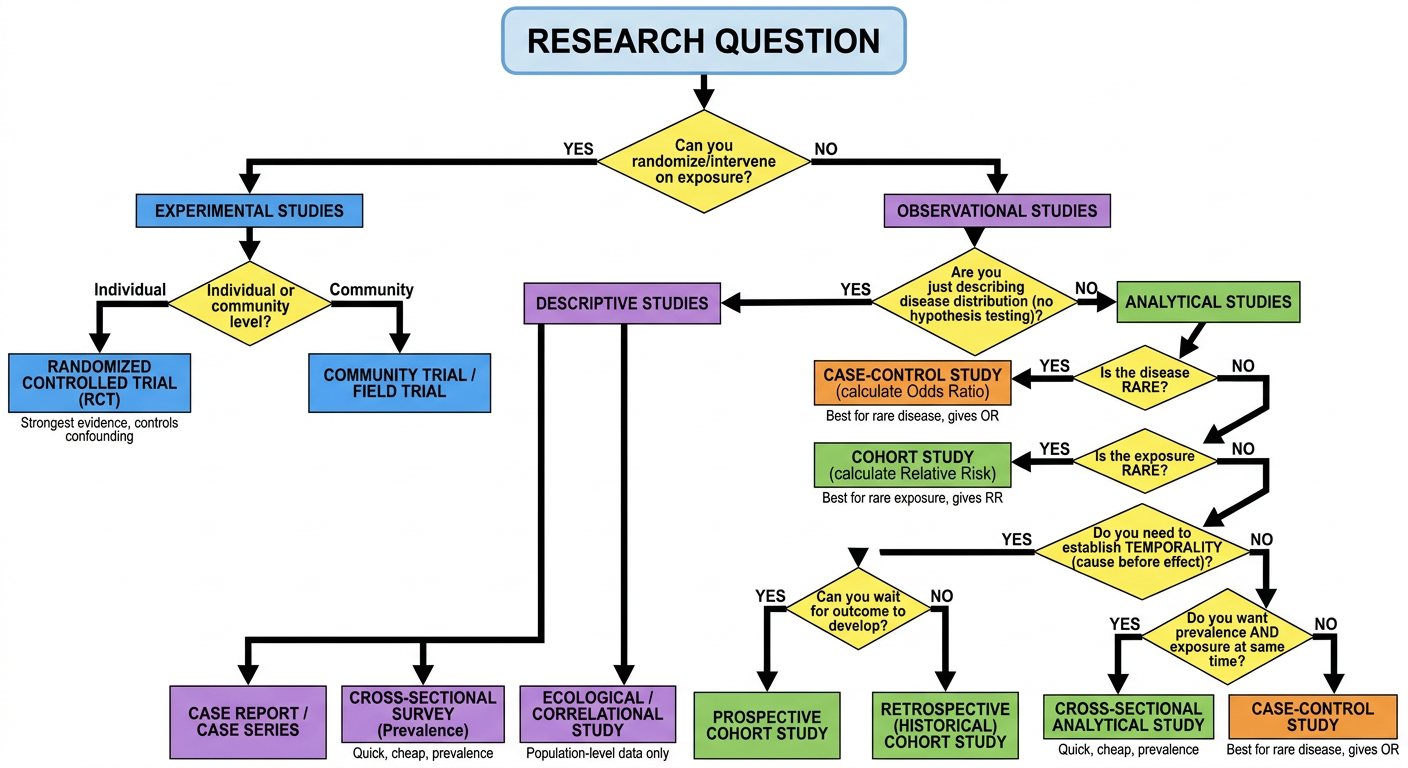
I now have comprehensive content. Let me update the todos and write the full answers.Here are comprehensive model answers to all 13 LAQs, based primarily on Park's Textbook of Preventive and Social Medicine:
GROUP A - LAQ ANSWERS (15 MARKS EACH)
Q1. Radiation Study Among Nuclear Plant Workers (2+8+5=15)
a. Ideal Study Design (2 marks)
A Prospective Cohort Study (also called a longitudinal or incidence study) is the ideal design. Workers are enrolled before disease onset, classified as exposed (radiation workers) and unexposed (controls), and followed forward over 5 years to measure the incidence of radiation-related diseases.
b. Steps in Conducting a Prospective Cohort Study (8 marks)
Step 1 - Define the study population:
Select workers currently employed in the nuclear plant who are free from radiation-related disease at the start. The exposed cohort = workers with documented occupational radiation exposure. The control cohort = workers in the same plant with no/minimal radiation exposure (e.g., administrative staff), or a comparable general population sample.
Step 2 - Obtain data on exposure:
- Personal interviews and questionnaires about duration, type and intensity of radiation exposure
- Review of dosimetry records (personal radiation badges/TLD badges)
- Environmental surveys of radiation levels at workstations
- Medical records review for pre-existing conditions
Step 3 - Baseline assessment:
Conduct medical examination of all cohort members at entry to:
- Exclude those already having the disease
- Record baseline clinical and laboratory parameters (CBC, liver function, etc.)
- Document potential confounders (smoking, age, sex, co-morbidities)
Step 4 - Selection of comparison (control) cohort:
Controls must be free of disease, comparable in age, sex, occupation and other variables, drawn from the same source population. Both groups followed under identical conditions.
Step 5 - Follow-up:
- Follow both cohorts over 5 years at regular intervals (e.g., annual medical check-ups)
- Track all relevant outcomes: cancers (leukaemia, thyroid, lung), cataracts, chromosomal abnormalities, mortality
- Minimize loss to follow-up by maintaining cohort registers and using multiple tracing methods
- Use identical surveillance intensity in both groups (to avoid surveillance bias)
Step 6 - Data collection during follow-up:
- Periodic medical examinations, blood tests, radiological investigations
- Update exposure data annually (dosimetry records)
- Register all new cases and deaths
Step 7 - Analysis:
Calculate Incidence Rate in each cohort. Compute:
- Relative Risk (RR) = Incidence rate in exposed / Incidence rate in unexposed
- Attributable Risk (AR) = Incidence in exposed - Incidence in unexposed
- Test for statistical significance and confounding
Step 8 - Interpretation and reporting:
Assess whether the association is causal using Hill's criteria (strength, consistency, temporality, biological gradient, plausibility, etc.) and make recommendations for radiation safety protocols.
c. Disadvantages of Cohort Study (5 marks)
- Time-consuming and expensive: Requires 5+ years of follow-up with large funding commitments; administrative burden is enormous.
- Loss to follow-up (attrition bias): Workers may change jobs, migrate, or die from unrelated causes, reducing the sample size and introducing bias.
- Not suitable for rare diseases: If the outcome (e.g., a specific radiation-induced cancer) is rare, enormous sample sizes are needed.
- Changes over time (secular changes): Diagnostic criteria, treatment practices or radiation safety regulations may change during the study period, affecting comparability.
- Healthy worker effect: Workers are generally healthier than the general population, which may underestimate the true risk.
- Multiple outcomes needed separately: Radiation may cause multiple diseases; the cohort study does not efficiently examine multiple exposures simultaneously (unlike case-control).
- Ethical issues: Difficult to ensure strict exposure differential over long periods; additional protective measures may be introduced mid-study.
(Source: Park's Textbook of Preventive and Social Medicine)
Q2. Village Diarrhoea Outbreak - 85 Cases in 3 Days After Feast (2+8+3+2=15)
Part 1: Epidemic or Outbreak? (2 marks)
This qualifies as both an epidemic and an outbreak (these terms are often used interchangeably).
- An epidemic exists when the observed frequency of disease is in excess of the expected frequency for that population based on past experience.
- An outbreak is a localized epidemic affecting a smaller area or defined group.
- Here, 85 cases of acute diarrhoeal disease in 3 days following a single community feast, in a village with presumably very low baseline diarrhoea rate, clearly exceeds the expected frequency. The temporal clustering (all within 3 days) and point-source pattern (single community feast) confirms this as a point-source outbreak/epidemic - most likely a common-source food/water-borne epidemic.
Part 2: Steps in Investigating this Outbreak (8 marks)
Step 1 - Verification of diagnosis:
Clinically examine a sample of cases; collect stool samples, rectal swabs, vomitus for microbiological culture; identify the pathogen (Salmonella, Vibrio cholerae, E. coli, Staphylococcal toxin, etc.).
Step 2 - Confirm existence of epidemic:
Compare disease frequency with baseline (past years, same time of year). With 85 cases in 3 days post-feast, the epidemic is self-evident.
Step 3 - Define a case (case definition):
Develop a working case definition: e.g., "any person who attended the community feast on [date] and developed 3 or more loose stools with/without vomiting within 72 hours."
Step 4 - Find all cases - case enumeration:
- Conduct active case search in the village (house-to-house survey)
- Prepare a line listing of all cases: name, age, sex, address, food items consumed at feast, time of onset, symptoms, severity
- Identify attack rates by food item consumed
Step 5 - Data analysis - time, place, person:
- Time: Draw an epidemic curve (histogram of cases by time of onset) - a point-source epidemic shows a single sharp peak within one incubation period
- Place: Map cases by residence/table at feast (spot map)
- Person: Attack rates by age, sex, foods consumed at feast
Step 6 - Formulate hypothesis:
Based on food-specific attack rates, incubation period and clinical features, hypothesize the probable vehicle (e.g., a specific food item - rice, meat, sweets).
Step 7 - Test the hypothesis:
Conduct an analytical study - calculate food-specific attack rates:
- Attack rate among those who ate food item X vs. those who did not
- Food with highest relative risk is the probable vehicle
- Collect food samples for microbiological analysis
- Collect water samples if water-borne route suspected
Step 8 - Control measures and report:
Implement immediate control, prepare a detailed report with recommendations.
Part 3: Epidemiological Study Design to Identify Source of Infection (3 marks)
A Retrospective Cohort Study (Cohort Analysis) is the most appropriate design:
- All persons who attended the feast constitute the cohort
- Divide into those who consumed each food item (exposed) and those who did not (unexposed)
- Calculate food-specific attack rates and relative risk for each food item
- The food item with the highest attack rate ratio and the pattern matching the incubation period identifies the source
(Alternatively, a Case-Control study can be used when the total cohort cannot be identified, comparing cases vs. non-ill feast attendees for food exposure history.)
Part 4: Two Immediate Control Measures (2 marks)
- Remove/destroy the suspected food source - Discard all remaining leftover food from the feast; close the food preparation area for decontamination.
- Oral rehydration therapy (ORT) and referral - Set up treatment centres; provide ORS to all mild/moderate cases; refer severely dehydrated patients to hospital immediately. Notify the relevant health authorities for coordinated response.
Q3. Time Trends in Disease Occurrence + Transmission Dynamics + Indications for Cohort Study (6+6+3=15)
Part 1: Types of Time Trends in Disease Occurrence (6 marks)
Time trends describe changes in disease frequency over time. Four main types:
1. Secular (Long-term) Trends
- Gradual changes in disease frequency over decades or centuries.
- Reflect long-term changes in agent, host and environment.
- Examples:
- Decline of tuberculosis in England long before effective treatment (due to improved nutrition and living standards)
- Rising trend of coronary artery disease and diabetes mellitus in 20th century
- Decline of rheumatic fever following improved living conditions
- Declining maternal mortality over decades due to better obstetric care
2. Periodic (Cyclic) Fluctuations
- Regular recurrent patterns of increase and decrease in disease frequency over shorter periods.
- Two subtypes:
(a) Seasonal Fluctuations:
- Regular increases at certain times of the year
- Examples:
- Influenza and respiratory infections in winter months
- Diarrhoeal diseases (cholera, typhoid) peak in summer
- Japanese encephalitis peaks in monsoon (vector-breeding season)
- Measles shows seasonal peaks
(b) Cyclic Fluctuations:
- Periodic peaks every few years related to build-up of susceptible population
- Examples:
- Measles epidemics every 2-3 years (before vaccination)
- Influenza pandemics every 10-40 years (due to antigenic shift)
- Whooping cough (pertussis) epidemics every 3-4 years
3. Short-term (Point Epidemic) Fluctuations
- Sudden sharp increase over hours or days, usually associated with a point source
- Examples:
- Food poisoning outbreak after a feast
- Cholera outbreak from a contaminated water source
4. Irregular (Sporadic) Occurrence
- Cases occurring occasionally, without definite pattern
- Examples: Rabies, tetanus, plague
Part 2: Transmission Dynamics Applied in Prevention and Control (6 marks)
Knowledge of transmission dynamics (the how, when, where and to whom a disease spreads) is fundamental to prevention:
- Chain of infection (Agent-Host-Environment):
Breaking any link in the chain controls the disease:
- Eliminate the agent: Sterilization, pasteurization (destroys agent)
- Interrupt transmission: Disinfection of water (cholera), condom use (HIV), mosquito nets (malaria), contact tracing (TB)
- Protect the host: Vaccination (immunization), chemoprophylaxis
-
Herd immunity threshold:
When a sufficient proportion of the population is immune, transmission chains break even for susceptible individuals. Used to determine vaccination coverage targets (e.g., >95% for measles to achieve herd immunity).
-
Basic Reproduction Number (R₀):
R₀ = average number of secondary cases from one primary case in a fully susceptible population.
- If R₀ > 1 → epidemic spreads; if < 1 → epidemic dies out.
- Used to calculate vaccination coverage needed: Vc = 1 - 1/R₀
- Measles R₀ = 12-18 → need >94% vaccination coverage
- Incubation period knowledge:
- Determines quarantine/isolation duration
- Helps define the exposure window for outbreak investigation
- Example: 14-day quarantine for COVID-19 based on incubation period
- Mode of transmission:
- Faeco-oral (cholera, typhoid) → sanitation and safe water
- Airborne (TB, measles) → ventilation, isolation, masks
- Vector-borne (malaria, dengue) → vector control (insecticides, larval control)
- Sexual (HIV, syphilis) → behavioural change, condoms
- Period of communicability:
Isolation and treatment during communicable period prevents spread (e.g., treatment of TB until sputum-negative; isolation of chicken pox until crusting of lesions).
Part 3: Indications for Cohort Study (3 marks)
According to Park's textbook, cohort studies are indicated when:
- There is good evidence of an association between exposure and disease, as derived from clinical observations and supported by descriptive and case-control studies
- The exposure is rare but incidence of disease is high among the exposed (e.g., special occupational groups like radiologists exposed to X-rays, nuclear workers)
- Attrition (loss to follow-up) can be minimized - i.e., the cohort is stable, accessible, cooperative and easy to follow up over time
- Ample funds are available for the long-term study
Q4. Framingham Study - Cohort Study Type + Steps + Advantages/Disadvantages + Causal Criteria (1+5+4+5=15)
a. Type of Study (1 mark)
The Framingham Study is an example of a Prospective Cohort Study (also called a longitudinal study or forward-looking study). It specifically involves a community-based cohort - residents of Framingham, Massachusetts, followed since the 1950s.
b. Steps for Conducting this Study (5 marks)
-
Define the study population: Residents of Framingham (general population cohort) aged 30-62 years, free of coronary heart disease at entry. Population-based sampling ensures representativeness.
-
Baseline assessment: Medical history, physical examination, ECG, blood pressure, cholesterol, lifestyle questionnaire at entry - identifies exposed (e.g., hypertensive, high cholesterol) and unexposed groups; excludes those with existing heart disease.
-
Follow-up at regular intervals: Participants recalled every 2 years for clinical examination, ECG, laboratory tests; additional follow-up between visits via mailed questionnaires and hospital record linkage.
-
Outcome ascertainment: Identify all new cases of myocardial infarction, angina, heart failure, stroke - using standardized diagnostic criteria; register deaths through death certificates.
-
Analysis: Calculate incidence rates by exposure category (smoking, hypertension, dyslipidaemia, diabetes, obesity); compute Relative Risk and Attributable Risk; use multivariate analysis to identify independent risk factors.
c. Advantages and Disadvantages (4 marks)
Advantages:
- Establishes temporal relationship - exposure precedes disease (cause before effect), providing strong evidence for causality
- Allows calculation of true incidence rates and relative risk
- Can study multiple outcomes from a single exposure (e.g., smoking → lung cancer, heart disease, COPD)
- Minimizes recall bias - exposure data collected prospectively, not relying on memory
Disadvantages:
- Expensive and time-consuming - requires decades of follow-up and enormous resources
- Loss to follow-up - attrition over years reduces power and may bias results
- Not suitable for rare diseases - very large sample needed
- Healthy worker effect - volunteers/selected populations may not represent general population
d. Criteria for Judging Causal Association - Hill's Criteria (5 marks)
Sir Austin Bradford Hill (1965) proposed the following criteria:
| # | Criterion | Meaning |
|---|
| 1 | Strength of association | High relative risk (e.g., RR of 9 for smoking and lung cancer) |
| 2 | Consistency | Same association found repeatedly by different researchers in different populations |
| 3 | Specificity | One cause leads to one specific effect (though not always applicable) |
| 4 | Temporality | Cause must precede effect (essential criterion - cannot be violated) |
| 5 | Biological gradient (Dose-response) | Greater exposure → greater disease frequency (e.g., more cigarettes → more lung cancer) |
| 6 | Plausibility | Association is biologically plausible based on known mechanisms |
| 7 | Coherence | Association does not contradict known facts about the disease |
| 8 | Experiment | Reduction in exposure leads to reduction in disease (e.g., smoking cessation → reduced lung cancer risk) |
| 9 | Analogy | Similar exposure-disease relationships are known (e.g., thalidomide → other teratogens) |
Temporality is the only absolute requirement. The others are supporting evidence.
Q5. Fever with Rash + Bronchopneumonia in Under-5s, Border District of West Bengal (2+6+7=15)
i. Probable Diagnosis (2 marks)
Measles (Rubeola) is the most probable diagnosis.
Justification:
- Under-five age group (most susceptible, especially if unvaccinated)
- Classic triad: fever + rash + respiratory involvement (bronchopneumonia)
- Deaths reported (measles case fatality rate is high in malnourished/immunocompromised children)
- Border district suggests possible imported case or low vaccination coverage population
- Differential diagnosis to consider: meningococcemia, dengue with rash; but bronchopneumonia as a complication strongly favours measles
ii. Outbreak Investigation (6 marks)
Step 1 - Verify diagnosis:
- Clinical examination of sample cases (look for Koplik's spots, maculopapular rash spreading cranio-caudally)
- Collect blood samples for measles IgM serology and throat swab/urine for viral isolation
- Review vaccination status of all cases
Step 2 - Confirm outbreak:
- Compare with baseline measles notification rates for the same district
- Confirm that case numbers exceed expected threshold
Step 3 - Case definition and enumeration:
- Working case definition: "Under-5 child in the border district with fever >38.5°C, maculopapular rash for ≥3 days, and at least one of: cough, coryza, or conjunctivitis (3Cs), with onset after [date]"
- Active case search: school, anganwadi, PHC registers, hospital records, house-to-house survey
- Line listing with: name, age, sex, village, vaccination status, date of onset, complications, outcome
Step 4 - Descriptive epidemiology (Time-Place-Person):
- Time: Epidemic curve - identify date of first case, peak, and whether ongoing
- Place: Spot map to identify geographic clusters; check for cross-border spread
- Person: Age-specific and vaccination-specific attack rates
Step 5 - Identify risk factors:
- Calculate attack rates in vaccinated vs. unvaccinated children
- Assess nutritional status, vitamin A deficiency (increases measles severity)
- Identify any common source (school, anganwadi centre)
Step 6 - Laboratory and field investigation:
- Collect specimens from at least 5-10 unvaccinated cases for serological confirmation
- Check cold chain integrity and vaccine coverage data for the area
iii. Containment of Outbreak (7 marks)
Immediate measures:
- Emergency vaccination (Ring vaccination/mop-up):
- Conduct immediate supplementary immunization for all children 6 months to 5 years in the affected villages regardless of prior vaccination status
- Extend to adjacent villages/blocks if spreading
- Case management:
- Isolate all active measles cases (respiratory isolation for 4 days after rash onset)
- Treat complications: antibiotics for bronchopneumonia (amoxicillin/co-amoxiclav), IV fluids, oxygen if needed
- Vitamin A supplementation for all cases (WHO protocol: 200,000 IU for 2 doses in children >1 year - reduces mortality and complications)
- Identify and vaccinate susceptibles:
- Check vaccination records of all under-5 contacts
- Vaccinate unimmunized/partially immunized contacts within 72 hours of exposure (post-exposure prophylaxis)
- Strengthen routine immunization:
- Audit cold chain maintenance, vaccine storage, coverage rates in affected areas
- Address missed opportunities for vaccination
- Contact tracing:
- Identify all contacts of each case; monitor for 21 days (2 incubation periods)
- Provide immunoglobulin to susceptible high-risk contacts (infants <6 months, pregnant women, immunocompromised) within 6 days of exposure
- Health education:
- Community mobilization about measles symptoms, when to seek care
- Inform about the importance of MR vaccination
- Cross-border coordination:
- Notify authorities in neighbouring state/country (border district)
- Coordinate surveillance and vaccination on both sides of the border
- Surveillance intensification:
- Activate fever-rash surveillance at all health facilities
- Weekly reporting of cases to district health office
- Report to higher authorities:
- Notify state and national health authorities; report to IDSP (Integrated Disease Surveillance Programme)
Q6. Epidemiology vs. Clinical Medicine + Point-Source Epidemic + Periodic Fluctuations + Geographic Distribution + Descriptive Epidemiology (2+3+4+5+1=15)
Part 1: Two Distinct Differences Between Epidemiology and Clinical Medicine (2 marks)
| Feature | Epidemiology | Clinical Medicine |
|---|
| Unit of study | Population/community (groups of people) | Individual patient |
| Objective | Identify causes and risk factors in populations; prevent disease at community level | Diagnose and treat disease in individual patients |
(Additional: Epidemiology uses statistical measures like rates and ratios; clinical medicine uses individual clinical findings. Epidemiology focuses on distribution and determinants; clinical medicine on pathophysiology and treatment.)
Part 2: Primary Epidemiological Characteristics of a Point-Source Epidemic (3 marks)
A point-source epidemic (also called common-source epidemic) has these features:
- Exposure is simultaneous - all cases exposed to the same source at approximately the same time (e.g., a contaminated feast)
- Sharp, rapid rise in the epidemic curve with a single peak - cases cluster within one incubation period of each other
- Rapid decline after the source is removed
- High attack rate in those exposed to the source
- Incubation period can be estimated from the epidemic curve (time from exposure to peak)
- Secondary spread is usually absent or minimal (unlike propagated epidemics)
- Classic examples: food poisoning outbreaks, cholera from a single contaminated water source
Part 3: Periodic Fluctuations of Epidemics with Real-World Examples (4 marks)
Periodic (cyclic) fluctuations are regular recurrent increases in disease frequency, occurring predictably at regular intervals.
Two types:
(A) Seasonal Fluctuations (within a year):
- Mechanism: Related to seasonal changes in environment (temperature, humidity, rainfall) affecting vector breeding, pathogen survival, or host behaviour
- Examples:
- Influenza - peaks in winter months in temperate regions (cold, dry conditions favour viral survival and indoor crowding)
- Cholera/Diarrhoeal diseases - peak in summer (higher temperatures favour bacterial multiplication; contamination of water during floods)
- Malaria - peaks in and after monsoon season (Anopheles mosquito breeding in stagnant water)
- Japanese Encephalitis - peaks during paddy cultivation season when Culex mosquitoes breed extensively
(B) Multi-year Cyclic Fluctuations:
- Mechanism: As epidemic attacks a population, susceptibles are reduced (through immunity); over time, a new birth cohort accumulates susceptibles until a threshold is reached, triggering the next epidemic
- Examples:
- Measles (pre-vaccination era): epidemic every 2-3 years when sufficient susceptibles accumulated
- Whooping cough (Pertussis): epidemic peaks every 3-4 years
- Influenza pandemics: occur every 10-40 years due to major antigenic shift in influenza A virus (e.g., 1918, 1957, 1968, 2009)
- Dengue: cycles of 3-5 years in endemic areas
Part 4: How Geographic Distribution Affects Descriptive Epidemiology Findings (5 marks)
Geographic distribution (place) is one of the three pillars of descriptive epidemiology (time-place-person). It affects findings in several ways:
-
Endemic zones and endemicity: Some diseases are restricted to specific geographic areas due to the presence of necessary vectors, reservoirs, or environmental conditions. Examples:
- Malaria endemic in sub-Saharan Africa, India (rural areas) but absent in cold climates (no Anopheles)
- Iodine deficiency disorders (IDD) in hilly areas with iodine-depleted soil (Himalayan belt, sub-Himalayan belt)
- Fluorosis in areas with high natural fluoride in groundwater
-
Urban-rural differences: Disease patterns differ by urbanization:
- Communicable diseases (cholera, TB) historically higher in crowded urban slums
- Non-communicable diseases (CAD, diabetes, obesity) now higher in urban areas due to sedentary lifestyle and dietary changes
- Occupational diseases concentrated in industrial clusters
-
Geographic clustering (spot maps): Clustering of cases in a specific neighborhood or around a particular source (contaminated well, industrial unit) points to a common environmental cause - as in John Snow's famous 1854 cholera investigation mapping cases around the Broad Street pump.
-
International variation: International comparisons reveal etiological clues:
- Low cancer rates in countries with specific dietary practices (e.g., lower colorectal cancer in Japan traditionally vs. US) - migrant studies helped confirm genetic vs. environmental roles
- High coronary disease rates in UK vs. Mediterranean countries - led to discovery of Mediterranean diet effect
-
Reporting and access artefacts: Geographic variation may reflect differences in health care access, diagnostic capacity, disease notification systems, or reporting practices - which must be accounted for when interpreting geographic data.
Part 5: One Major Function of Descriptive Epidemiology (1 mark)
Generation of hypotheses - Descriptive epidemiology (by characterizing disease distribution by time, place, and person) generates etiological hypotheses that can then be tested by analytical studies (case-control, cohort studies).
Q7. Air Pollution and Bronchial Asthma in School Children (3+6+3+3=15)
Part 1: Most Appropriate Study Design and Justification (3 marks)
A Prospective Cohort Study is the most appropriate design.
Justification:
- The hypothesis involves long-term exposure (chronic urban air pollution) preceding an outcome (development of bronchial asthma) - cohort design directly captures this temporal sequence
- Allows direct measurement of incidence of new asthma cases in exposed (high pollution area) vs. unexposed (low pollution area) children
- Can calculate Relative Risk - a direct measure of association
- School children can be enrolled, exposure documented objectively (air quality monitoring data), and followed prospectively
- Ethical: unlike an experimental study, no manipulation of exposure is needed (purely observational)
(A cross-sectional or case-control study cannot establish temporality as well; ecological study lacks individual-level data.)
Part 2: Step-by-Step Methodology (6 marks)
Step 1 - Define study population:
School-going children (age 6-14) in urban areas, divided into:
- Exposed cohort: Children living and attending school in high-pollution urban zones (near busy roads, industrial areas) - objectively verified by PM2.5/PM10 monitoring data
- Unexposed cohort: Children from comparable urban areas with lower pollution levels
Step 2 - Baseline assessment (entry criteria):
- All children must be free of diagnosed asthma at baseline
- Spirometry (FEV1, FVC, FEV1/FVC ratio) at entry
- Questionnaire: family history of asthma/atopy, socioeconomic status, indoor pollution (cooking fuel, passive smoking), nutritional status
- Exclude children with pre-existing wheeze, eczema, or confirmed atopy if they will confound results
- Blood tests: eosinophil count, total IgE
Step 3 - Exposure measurement:
- Continuous air quality monitoring (PM2.5, PM10, NO2, SO2, O3) at study sites using government/CPCB data or personal monitors
- Personal exposure assessment: time-activity diaries (time spent outdoors, near traffic)
- Indoor exposure: type of cooking fuel, household ventilation, tobacco smoke
Step 4 - Follow-up:
- Follow all children annually for 3-5 years
- Annual spirometry, clinical examination, and questionnaire
- Outcome definition: "New diagnosis of bronchial asthma confirmed by physician + reversible airflow obstruction on spirometry (≥12% improvement in FEV1 post-bronchodilator)"
Step 5 - Data collection:
- Standardized data collection forms at each annual visit
- Blinded assessment of outcomes (respiratory physician unaware of exposure group)
- Track dropouts and reasons for loss to follow-up
Step 6 - Analysis:
- Calculate cumulative incidence of asthma in each exposure group
- Relative Risk (RR) = incidence in high-pollution group / incidence in low-pollution group
- Dose-response analysis: does higher PM2.5 exposure correlate with higher asthma incidence?
- Multivariate regression to adjust for confounders (family history, SES, indoor pollution, passive smoking)
Part 3: Strengths in Establishing Temporal and Causal Relationship (3 marks)
- Temporality established: Exposure (air pollution) is documented before disease onset (asthma) - the most critical criterion for causality (Hill's criterion of temporality)
- Incidence rates calculable: Provides true RR (not odds ratio), the strongest measure of association
- Dose-response relationship: Gradient in exposure levels allows testing for biological gradient (another Hill criterion)
- Multiple outcomes: Can simultaneously examine other respiratory outcomes (rhinitis, reduced FEV1, COPD risk)
- Bias reduction: Prospective data collection reduces recall bias and reduces the risk of exposure misclassification over time
Part 4: Potential Sources of Bias (3 marks)
-
Selection bias:
- Healthy worker/healthy child effect - children with pre-existing respiratory problems may already live in cleaner areas (reverse causation in selection)
- Volunteer bias - families consenting to study may differ systematically
-
Information/measurement bias:
- Exposure misclassification: outdoor PM2.5 data may not reflect actual personal air pollution exposure (children spend time indoors)
- Outcome ascertainment bias: parents in high-pollution areas may be more likely to report/seek care for respiratory symptoms
-
Confounding:
- Indoor air pollution (biomass cooking, passive smoking) is a major confounder - children in poor urban areas may have both high outdoor and indoor pollution
- Socioeconomic status - affects nutrition, healthcare access, housing quality
- Family history of atopy - strong genetic predisposition to asthma confounds the association
-
Attrition bias (loss to follow-up): If children who are more ill (or healthier) are more likely to drop out, the final cohort is not representative
-
Ecological fallacy: Using area-level pollution data as a proxy for individual exposure introduces exposure misclassification
Q8. Osteoarthritis of Knee Associated with Obesity - Study After Cross-Sectional Survey (2+8+5=15)
Part 1: Study to Accept or Reject Hypothesis (2 marks)
The next study should be a Case-Control Study (retrospective analytical study).
Why: A cross-sectional study has already shown an association but cannot establish temporality (did obesity precede OA, or did OA lead to reduced activity and obesity?). A case-control study is efficient, relatively quick, and can test the hypothesized exposure-disease relationship with reasonable strength. Alternatively, a cohort study could be done but requires more time and resources.
(Note: If time and resources are available, a prospective cohort study would provide even stronger evidence with better temporal clarity.)
b. Steps of Case-Control Study (8 marks)
Step 1 - Case definition:
- Cases: Patients with clinically and radiologically confirmed osteoarthritis of both/one knee joint (Kellgren-Lawrence grade ≥2 on X-ray)
- Source of cases: Orthopedic OPD, radiology registers of a large hospital
Step 2 - Selection of controls:
- Controls: Individuals of similar age and sex without OA of knee, from the same hospital (other OPDs) or community
- Matched to cases on: age (±5 years), sex, place of residence
- Controls must be free of OA at the time of selection; source population identical to that of cases
Step 3 - Sample size calculation:
- Determine required sample size based on expected prevalence of obesity in controls, expected odds ratio, desired power (80%) and significance level (α=0.05)
Step 4 - Obtaining data on exposure (obesity):
- Measure current BMI (height, weight)
- Obtain past weight history (10-20 years ago) through structured interviews - since OA develops over years, past obesity is the relevant exposure
- Review medical records for historical BMI measurements
- Assess confounders: age, sex, occupation, joint injury history, dietary habits, physical activity
Step 5 - Data collection instrument:
- Structured questionnaire: dietary habits, occupation, physical activity, family history, age of onset of obesity, duration of obesity, any prior knee injury
Step 6 - Analysis:
| OA (Cases) | No OA (Controls) |
|---|
| Obese (exposed) | a | b |
| Not obese (unexposed) | c | d |
- Calculate Odds Ratio (OR) = (a×d)/(b×c)
- OR >1 suggests association; test significance with chi-square and 95% CI
- Multivariate logistic regression to control for confounders
Step 7 - Interpret and report:
- If OR is significantly >1, the data support the hypothesis that obesity is associated with OA
- Calculate population attributable risk percent to estimate the proportion of OA attributable to obesity
c. Three Advantages and Three Disadvantages (5 marks - 3+2 split or 5 total)
Advantages:
- Relatively quick and inexpensive - retrospective design; no long follow-up needed
- Efficient for rare diseases - OA is not extremely rare but the study is well-suited; especially good if OA were rarer
- Can study multiple exposures simultaneously (obesity, joint injury, occupation, diet) from the same study
Disadvantages:
- Cannot calculate incidence or true relative risk - only odds ratio (an approximation of RR)
- Recall bias - cases may remember past exposures (obesity, diet) differently from controls (differential recall)
- Selection bias - hospital-based controls may not represent the general population from which cases arise
- Temporal relationship not always clear - in retrospective design, hard to confirm that obesity preceded OA vs. OA-related immobility causing obesity
Q9. Epidemiology + Classification + Asbestos and Lung Cancer Study + Outcome + Advantages/Disadvantages (2+3+6+1+3=15)
Part 1: What is Epidemiology? (2 marks)
Epidemiology is defined (Last, 2001) as:
"The study of the distribution and determinants of health-related states or events in specified populations, and the application of this study to the control of health problems."
Key elements:
- Study - scientific method using observation
- Distribution - frequency and pattern by time, place, and person
- Determinants - risk factors and causes
- Populations - groups, not individuals
- Application - to prevention and control
Part 2: Classification of Epidemiological Studies (3 marks)
Epidemiological Studies
├── Observational
│   ├── Descriptive
│   │   ├── Case reports / Case series
│   │   ├── Cross-sectional survey
│   │   └── Ecological (correlational) study
│   └── Analytical
│       ├── Case-Control (retrospective)
│       ├── Cohort (prospective/retrospective)
│       └── Cross-sectional (can be analytical)
└── Experimental (Interventional)
    ├── Randomized Controlled Trial (RCT)
    ├── Field trial
    └── Community trial
Part 3: Study Design for Asbestos and Lung Carcinoma (6 marks)
A Retrospective Cohort Study (Historical Cohort Study) is most appropriate and efficient.
Why retrospective cohort?
- Asbestos exposure occurred in the past (occupational records exist)
- Lung cancer has a long latency (20-40 years after asbestos exposure)
- Prospective study would take decades; historical records allow fast, cost-effective study
Study Design with Diagram:
Past                    Present
  |_________________________|
  Exposed to             → Lung cancer: YES/NO
  asbestos (a+b)
  (asbestos workers)        Relative Risk = [a/(a+b)] / [c/(c+d)]

  Not exposed to         → Lung cancer: YES/NO
  asbestos (c+d)
  (unexposed workers)
Steps:
- Identify exposed cohort: Workers employed in asbestos mines, textile mills, or shipyards with documented asbestos exposure from occupational records (25-40 years ago)
- Identify unexposed cohort: Workers in the same factory/area without asbestos exposure (e.g., administrative staff), matched for age, sex, smoking status
- Baseline: Both cohorts free of lung cancer at start of exposure
- Ascertain outcomes: Review death certificates, hospital records, cancer registry data for lung cancer diagnoses and deaths
- Exposure quantification: Duration and intensity of exposure from industrial hygiene records
- Analysis: Calculate RR; dose-response relationship; adjust for smoking (major confounder)
Part 4: Outcome of Such Study (1 mark)
The study will demonstrate Relative Risk (RR) of lung cancer in asbestos-exposed workers compared to unexposed. Historical data shows RR is approximately 5-10 times higher in asbestos workers; with heavy smoking and asbestos exposure combined, RR can be as high as 50-fold (synergistic effect). The primary carcinoma associated with asbestos is mesothelioma (pleural/peritoneal) and also bronchogenic carcinoma (particularly in smokers).
Part 5: Advantages and Disadvantages (3 marks)
Advantages:
- Establishes temporal sequence (exposure precedes disease)
- Allows calculation of true relative risk and incidence rates
- Retrospective cohort is faster and cheaper than prospective cohort while maintaining the analytical strength
Disadvantages:
- Historical records may be incomplete or inaccurate (exposure data quality depends on old industrial records)
- Loss to follow-up over the long latency period
- Confounding by smoking - asbestos workers also tend to smoke more; rigorous adjustment needed
Q10. Time Trends in Disease Occurrence + Interpreting Time Trends (12+3=15)
Part 1: Salient Features of Different Time Trends with Examples (12 marks)
(Comprehensive version - builds on Q3 Part 1)
1. Secular Trends (Long-term trends)
-
Definition: Gradual, directional change in disease frequency over many years or decades
-
Duration: Decades to centuries
-
Causes:
- Changes in agent virulence or new emergence of organisms
- Changes in host immunity (vaccination programmes)
- Changes in environment (urbanization, industrialization, sanitation, nutrition)
- Changes in diagnostic technology and case ascertainment
- Demographic changes (aging population)
-
Downward secular trends (favourable):
- Tuberculosis: mortality declined progressively in England from 1850, long before streptomycin (1947), due to improved nutrition and housing
- Maternal mortality: dramatic decline over 20th century due to antiseptic technique, blood transfusion, antibiotics, safe abortion
- Smallpox: declining and ultimate global eradication (1980) due to vaccination
-
Upward secular trends (unfavourable):
- Coronary artery disease: epidemic rise in 20th century, now plateauing/declining in developed countries
- Type 2 Diabetes mellitus: global epidemic driven by obesity, sedentary lifestyle
- Lung cancer in women: rising trend following increase in female smoking rates after World War II
2. Seasonal Fluctuations
- Definition: Regular recurring increases in disease frequency at certain seasons
- Duration: Within one year, annually recurring
- Causes: Seasonal variation in vector density, pathogen survival, host immune function, human behaviour, rainfall, temperature
| Season | Disease | Mechanism |
|---|
| Winter | Influenza, pneumonia, RSV | Viral survival in cold-dry air; indoor crowding |
| Summer | Cholera, typhoid, food poisoning | Bacterial growth; flies; water contamination |
| Monsoon | Malaria, dengue, JE, leptospirosis | Vector breeding; flooding |
| Pre-monsoon | Chickenpox | Increased susceptibility; dry conditions |
3. Cyclic (Periodic) Fluctuations
- Definition: Recurring epidemics separated by intervals of lower incidence (years between peaks)
- Mechanism: Epidemic depletes susceptibles → relative immunity in population → new susceptibles accumulate (through births) over years → threshold crossed → new epidemic
- Examples:
- Measles: 2-3 year cycles pre-vaccination (large cities) or 3-5 years (small towns) based on speed of susceptible accumulation
- Pertussis: 3-4 year cycles
- Influenza: minor annual variation with occasional pandemic spikes every 10-40 years when antigenic shift occurs (1918 H1N1, 1957 H2N2, 1968 H3N2, 2009 H1N1)
- Dengue: 3-5 year cycles in hyperendemic regions
4. Short-term Fluctuations (Epidemic Waves/Point Epidemics)
- Definition: Sudden sharp increase over hours/days related to a common source
- Examples: Food poisoning outbreak; cholera outbreak from contaminated water; chemical disaster
5. Irregular/Sporadic Occurrence
- Definition: Occasional cases without any discernible pattern
- Examples: Rabies (dependent on stray dog bites), tetanus, occasional imported plague
Part 2: Possible Changes to Keep in Mind While Interpreting Time Trends (3 marks)
When observing time trends, the following artefactual changes (not true biological changes) must be excluded:
-
Changes in diagnostic criteria and methods:
- Introduction of new diagnostic tests (e.g., PCR, ELISA) may suddenly increase reported incidence of a disease (more sensitive detection, not true increase)
- Changed case definitions alter apparent disease frequency
-
Changes in notification and reporting systems:
- A disease that becomes notifiable will appear to "increase" simply due to improved reporting
- Changes in surveillance intensity or completeness of reporting can create false trends
-
Changes in age structure of population:
- Aging population will show increased rates of age-related diseases (coronary disease, cancers) even without true biological change
- Age-standardization required for valid comparisons
-
Changes in population size:
- Use of rates (not absolute numbers) corrects for population growth
- Denominator changes must be accounted for
-
Changes in treatment efficacy:
- Improved treatment reduces case fatality rate and mortality, even if incidence is unchanged - declining mortality trend does not mean declining incidence
-
Changes in coding practices:
- ICD revision changes may shift deaths between categories (e.g., some COPD deaths previously coded as heart failure)
Q11. Define Epidemiology + Classify Types + Steps of One Observational Study (2+3+10=15)
Part 1: Define Epidemiology (2 marks)
(See Q9 Part 1 - identical answer)
Epidemiology is the study of the distribution and determinants of health-related states or events in specified populations, and the application of this study to the prevention and control of health problems. (Last, 2001)
Part 2: Classify Types of Epidemiological Studies (3 marks)
(See Q9 Part 2 - identical classification table)
Part 3: Steps of Cohort Study (Observational Study) - 10 marks
(See Q1b for concise version; expanded below)
A Prospective Cohort Study is one of the most important analytical observational studies. The steps are:
Step 1 - Formulate hypothesis and objectives:
- Based on prior descriptive or case-control evidence, formulate a specific hypothesis (e.g., "Cigarette smoking increases risk of lung cancer")
- Define study objectives, exposure variable, outcome variable
Step 2 - Define the study population and cohorts:
- Exposed cohort: Individuals exposed to the factor under study (e.g., smokers); free of disease at baseline
- Unexposed cohort: Comparable individuals not exposed (e.g., non-smokers), free of disease; matched or comparable for confounders
Step 3 - Baseline assessment:
- Medical examination to exclude existing disease
- Document: exposure status, degree of exposure, demographic variables, confounders
- Collect biological specimens (blood, urine) for storage
Step 4 - Obtaining data on exposure:
- Interviews, questionnaires (e.g., smoking history)
- Review of medical/occupational records
- Environmental measurements
- Medical examination / special tests (e.g., blood pressure, cholesterol)
Step 5 - Follow-up:
- Both cohorts followed for a defined period under identical surveillance conditions
- Regular recall visits at predetermined intervals
- Track vital status, new diagnoses, hospitalizations
- Minimize loss to follow-up: maintain participant registers, use multiple contact methods, employ field workers
Step 6 - Outcome ascertainment:
- Define outcomes precisely before study starts
- Use standardized diagnostic criteria (e.g., confirmed histopathology for cancer)
- Blind outcome assessors to exposure status where possible (to avoid detection bias)
Step 7 - Data management:
- Maintain study register
- Record all dropouts, withdrawals, deaths (for competing risk analysis)
- Periodic data quality checks
Step 8 - Analysis:
- Calculate disease incidence rates in each cohort
- Compute Relative Risk (RR) = Incidence rate (exposed) / Incidence rate (unexposed)
- Compute Attributable Risk (AR) = Incidence rate (exposed) - Incidence rate (unexposed)
- Compute Population Attributable Risk (to estimate burden in population)
- Dose-response analysis if applicable
- Multivariate analysis to control for confounders
Step 9 - Interpretation:
- Assess causality using Hill's criteria
- Consider potential biases (selection, information, confounding)
- Apply findings to make public health recommendations
Step 10 - Dissemination and application:
- Publish findings, communicate to policy makers
- Formulate evidence-based prevention strategies
Q12. AEFI - MR Vaccine - Anaphylaxis + Investigation + Prevention + Types of Reactions (2+6+4+3=15)
a. Most Probable Diagnosis in First Child (2 marks)
Anaphylaxis - a severe, life-threatening systemic hypersensitivity reaction (AEFI - Adverse Event Following Immunization).
Justification:
- Onset within 30 minutes of vaccination (anaphylaxis typically within 15-30 minutes)
- Triad of features present:
- Difficulty in breathing (bronchospasm/laryngeal edema)
- Generalized rash (urticaria/angioedema)
- Loss of consciousness (anaphylactic shock - cardiovascular collapse)
- The temporal relationship to vaccination is classic
- This is a Type I hypersensitivity (IgE-mediated) reaction to vaccine components (gelatin, neomycin, egg protein in some vaccines)
- It is the most severe form of AEFI requiring immediate emergency management (adrenaline/epinephrine IM)
b. Field-Level Investigation (6 marks)
Immediate field investigation steps following an AEFI:
Step 1 - Notify:
- Immediately report to Medical Officer in-charge, District Immunization Officer, and state/national AEFI committee
- Fill AEFI reporting form within 24 hours of detection
Step 2 - Clinical investigation:
- Review the case history: prior vaccine doses, allergies, family history of atopy
- Confirm clinical diagnosis: anaphylaxis criteria (NIAID/WAO criteria)
- Document: time of vaccination, time of onset of symptoms, clinical features, treatment given, outcome
Step 3 - Vaccine and cold chain investigation:
- Quarantine all vaccine vials from the same batch used at the session site
- Check vaccine details: manufacturer, batch number, expiry date, VVM status
- Inspect cold chain: temperature records of cold chain equipment, VVM status at time of use
- Check reconstitution: Was the correct diluent used? Was reconstituted vaccine used within 4 hours? Was the vial contaminated?
- Collect remaining vials from the same batch for quality testing by CDSCO/NPQC
Step 4 - Review vaccination session:
- Check injection technique: correct site (anterolateral thigh/deltoid), correct route (SC for MR)
- Check if vaccine was reconstituted with correct diluent
- Verify if other children from same session developed reactions (4 others developed mild fever + local swelling - these are expected local reactions, not programmatic errors)
Step 5 - Causality assessment:
- AEFI causality classification (WHO 2013 methodology):
- Vaccine product-related reaction
- Vaccine quality defect
- Immunization error (programme error)
- Immunization anxiety-related reaction
- Coincidental event
- In this case: Vaccine product-related reaction (anaphylaxis)
Step 6 - Further lab investigation:
- Serum tryptase levels (elevated in anaphylaxis) if feasible
- Specific IgE testing to vaccine components (post-recovery)
- Send quarantined vaccine vials for quality testing
c. Preventive Measures for Future Sessions (4 marks)
-
Screen for contraindications before vaccination:
- Ask about previous vaccine reactions, known allergies (especially egg, gelatin, neomycin, latex)
- Do not vaccinate children with known history of anaphylaxis to previous dose of same vaccine
-
Ensure emergency kit availability:
- Every vaccination site must have a functioning anaphylaxis kit: Adrenaline (Epinephrine) 1:1000, syringes, oxygen, IV fluids, antihistamines, corticosteroids
- Vaccinator must be trained to recognize and manage anaphylaxis
-
Observation period:
- All vaccinated children must be observed for at least 30 minutes post-vaccination at the session site before being allowed to leave
-
Train vaccinators:
- Regular AEFI management training including anaphylaxis recognition and epinephrine administration
- Skill drills for emergency response
-
Cold chain maintenance:
- Ensure proper cold chain at all times; check VVM before each use
- Use reconstituted vaccine within 4 hours; discard remainder
-
Documentation:
- Maintain complete vaccination records including batch numbers
- This enables rapid tracing in case of cluster AEFI events
d. Types of Reactions Following Immunization (3 marks)
According to the WHO AEFI classification:
1. Local reactions:
- Pain, redness, swelling at injection site
- Usually self-limiting; caused by adjuvants
2. Systemic reactions:
- Mild: fever, malaise, irritability, headache (within 24-48 hours)
- Moderate: febrile convulsions (usually in susceptible children)
- Severe: hypotonic-hyporesponsive episode (HHE), thrombocytopenic purpura (MMR), intussusception (rotavirus vaccine - rare)
3. Severe allergic/anaphylactic reactions:
- Urticaria, angioedema, bronchospasm, anaphylaxis
- IgE-mediated; within 30 minutes
4. Vaccine-strain disease:
- Vaccine-associated paralytic polio (VAPP) with OPV - 1 in 2.4 million
- Vaccine-strain measles encephalitis (extremely rare)
5. Programme errors (Injection site errors):
- Abscess, cellulitis, septicaemia, toxic shock - due to contamination or incorrect technique
6. Coincidental events:
- Not causally related to vaccine; occur by temporal coincidence (fever from concurrent infection)
Q13. Ceramics Industry Workers with Cough + Silicosis - Study Design + Confounding (2+6+2+2+3=15)
Part 1: Suitable Epidemiological Study Design (2 marks)
A Retrospective Cohort Study (Historical Cohort Study) is suitable to establish association between silica dust exposure (ceramics industry) and silicosis/pulmonary disease.
Diagram:
         PAST RECORDS                    PRESENT

[Ceramics workers]                    → Silicosis/CXR changes: Yes/No
Exposed to silica dust (a+b)
                                        Relative Risk = [a/(a+b)] ÷ [c/(c+d)]
[Control workers]                     → Silicosis/CXR changes: Yes/No
Not exposed to silica dust (c+d)
(e.g., administrative staff in same factory)
A Case-Control study can also be used (as cross-sectional findings suggest an association - next logical step):
- Cases: Workers with silicosis (CXR showing ground glass + typical features + symptoms)
- Controls: Workers without silicosis from same ceramics industry
- Exposure: quantified silica dust exposure by job category and duration
b. Step-by-Step Epidemiological Study (6 marks)
(Using Case-Control Study design as the "next step" after observational cross-sectional findings)
Step 1 - Define cases:
Workers in ceramics industry with:
- Symptoms: chronic cough, dyspnoea, chest pain
- CXR: ground glass opacities / nodules (ILO classification grade ≥1/1)
- Confirm diagnosis: HRCT chest, PFT (restrictive pattern), exclude TB, COPD
Step 2 - Define controls:
Workers in the same ceramics facility (or similar industry) without respiratory disease, no CXR changes, matched for age, sex, smoking status, duration of employment.
Step 3 - Sample size:
Calculate based on expected exposure prevalence in controls, desired OR to detect, significance level (α=0.05), power (80%). Usually 1:1 or 1:2 matching.
Step 4 - Data collection (exposure history):
- Job title and department (polishing, grinding, kiln work = higher silica exposure)
- Duration of employment in high-exposure areas
- Availability of personal protective equipment (PPE) and its usage
- Industrial hygiene records: airborne silica dust concentrations
- Smoking history (important confounder)
Step 5 - Confounders:
Control for: age, sex, smoking, duration of employment, use of PPE, co-existing TB
Step 6 - Analysis:
- 2×2 table; calculate Odds Ratio
- Logistic regression to adjust for confounders
- Dose-response: Does longer silica exposure → higher grade of silicosis?
c. Types of Association (2 marks)
In epidemiology, an observed association between exposure and disease may be:
-
Spurious (Artefactual) Association:
- Due to chance (sampling error - p-value alone)
- Due to bias (selection bias, information bias)
- Not a real biological association
-
Indirect (Non-causal) Association:
- Due to confounding - a third variable (confounder) is associated with both exposure and outcome
- Example: Coffee drinking appears associated with lung cancer only because both are linked to smoking
-
Direct (Causal) Association:
- The exposure actually causes the disease
- Assessed using Hill's criteria (strength, consistency, temporality, dose-response, plausibility, etc.)
d. What is Confounding? (2 marks)
Confounding is a distortion in the estimated measure of association between exposure and disease, caused by a third variable (confounder) that is:
- Associated with the exposure
- Independently associated with the disease (risk factor)
- Not an intermediate in the causal pathway between exposure and disease
Example: In studying silica-silicosis association, smoking is a confounder - it is associated with working in dusty environments AND independently causes lung disease.
e. How to Remove Confounding (3 marks)
At study design stage:
- Randomization - only in experimental studies; equally distributes confounders between groups
- Restriction - restrict study to one category of confounders (e.g., only study non-smokers)
- Matching - match each case with a control on potential confounders (age, sex, smoking)
At analysis stage:
- Stratification (Mantel-Haenszel method) - analyse data separately for each stratum of confounder; compute pooled summary OR/RR
- Multivariate statistical analysis - logistic regression, Cox regression, multiple linear regression - statistically adjust for multiple confounders simultaneously
- Standardization - used for population comparisons; standardize rates by age/sex distribution
(Source: Park's Textbook of Preventive and Social Medicine)
---All 13 LAQ model answers are written above. Here is a quick reference summary of what each question tests and the key study design involved:
Quick Reference Summary
| Q# | Core Theme | Key Study Design | Source Institution |
|---|
| 1 | Radiation study in nuclear workers | Prospective Cohort Study | JNM |
| 2 | Village diarrhoea outbreak post-feast | Retrospective Cohort / Outbreak Investigation | MMC |
| 3 | Time trends + transmission dynamics + cohort indications | Descriptive epidemiology concepts | MldMCH |
| 4 | Framingham Study + Hill's criteria | Prospective Cohort + Causal criteria | KPC |
| 5 | Fever + rash + bronchopneumonia in under-5 (Measles) | Outbreak investigation + containment | SRIMS |
| 6 | Epi vs clinical medicine + point-source epidemic + periodic fluctuations | Descriptive epidemiology | SSKM |
| 7 | Air pollution + bronchial asthma in children | Prospective Cohort Study + bias | SCCGMCH |
| 8 | OA knee + obesity after cross-sectional survey | Case-Control Study | NRS |
| 9 | Epidemiology definition + asbestos-lung cancer | Retrospective (Historical) Cohort | RPHGMCH |
| 10 | Time trends (detailed) + interpretation pitfalls | Secular/seasonal/cyclic trends | RGKar |
| 11 | Define epi + classify studies + cohort steps | Cohort Study steps (full) | JIMSH |
| 12 | AEFI after MR vaccine - anaphylaxis | AEFI investigation + prevention | JIMSH |
| 13 | Silicosis in ceramics workers + confounding | Retrospective Cohort / Case-Control + confounding | JHARGRAM |
Key recurring themes across all questions:
- Cohort study (prospective and retrospective) is the most commonly examined study design - master all its steps, advantages, disadvantages
- Outbreak investigation 8-step protocol is tested repeatedly with different scenarios
- Hill's causal criteria appear in Q4 and underlie all causal association questions
- Confounding and bias are tested explicitly in Q7 and Q13
- Time trends (secular, seasonal, cyclic) appear in Q3, Q6, Q10
- AEFI classification and anaphylaxis management is a standalone clinical-epidemiology topic (Q12)
All answers are based on Park's Textbook of Preventive and Social Medicine (the gold standard for PSM/Community Medicine examinations in India).