
- Explain various buffers of body fluids, the role of plasma buffers and renal mechanisms in maintenance of acid-base balance
- Add a note on regulation of pH in the body
bicarbonate buffer system body fluids pH regulation diagram
A pathophysiology diagram illustrating the regulatory mechanisms of the innate immune system influenced by the microbiome. Centered on the term 'Regulation of the Innate Immune System,' the chart branches into several key physiological modulators: Alteration of Anatomic Barriers, Activation of Cell Signaling Cascades (leading to host control over microbiota and changes in the local environment/pH), Changes to Tissue-Specific Mediators, Hormonal Regulation, and Changes to Hematopoiesis. Two detailed inset panels provide cellular-level context. The left panel depicts 'Interactions Between Metabolites and Host Immune Cells,' showing products of microbial metabolism interacting with various immune cell types above an epithelial barrier. The right panel demonstrates the molecular interaction between a microbe and an immune cell, specifically highlighting a Microbe-Associated Molecular Pattern (MAMP) binding to a Pattern Recognition Receptor (PRR). This binding event is shown to trigger the 'Release of Antigens' and the 'Release of Immune Regulating Molecules.' The diagram serves as an educational summary of how commensal or pathogenic microbes provide synergistic signals that maintain immune homeostasis and functionality.
This composite diagnostic image displays functional magnetic resonance imaging (fMRI) data mapping cardiovascular regulatory centers in the human hypothalamus and brainstem. Panel (a) shows a hypothalamic cluster encompassing the paraventricular nucleus (PVN) and posterior hypothalamic area (PH) in a coronal view (y=-5). Panels (b), (c), and (d) utilize axial slices of the medulla oblongata to demonstrate connectivity changes during lower body negative pressure (LBNP). Panel (b) illustrates increased functional connectivity between the hypothalamus and a cluster in the lateral medulla (z=-51), including the rostral ventrolateral medulla (RVLM) and nucleus ambiguus (Amb), represented by t-values. Panel (c) shows a matched independent component (mICA) probability map identifying this functional cluster. Panel (d) reveals increased functional connectivity within the medulla (z=-57), specifically targeting the nucleus of the solitary tract (NTS), as further detailed in the accompanying anatomical diagram. The color scales indicate statistical significance (t-values from 1.5 to 6.0) or mixture model (MM) probability (0.5 to 1.0). This material serves to illustrate central baroreflex pathways and autonomic nervous system regulation.
A pathophysiology diagram illustrating the dual role of melatonin as an 'immunological buffer.' The visual is organized into two contrasting sections separated by a central yin-yang symbol with a double-headed arrow, representing dynamic equilibrium. The left side, labeled 'Basal conditions' in red text, features a balance scale weighted toward 'Immunostimulant' (red box) over 'Anti-inflammatory' (blue box). It lists scenarios requiring immune enhancement: immunodepression (due to corticoids, aging, or pathology), early viral/parasitic infections, vaccination, and cancer. The right side, labeled 'Septic shock' in blue text, features a scale weighted toward 'Anti-inflammatory' (blue box) over 'Immunostimulant' (red box). This side lists conditions of exacerbated inflammation, including experimental models of SLE, EAE, Type 1 Diabetes (T1D), acute inflammation, and transplantation. The diagram demonstrates melatonin's pleiotropic ability to stimulate the immune system under basal/suppressed states while providing anti-inflammatory regulation during hyper-inflammatory crises.
ACID BASE BALANCE
Buffers of Body Fluids, Role of Plasma Buffers, Renal Mechanisms & Regulation of pH
1. Definition of a Buffer
- Tietz Textbook of Laboratory Medicine, 7th Ed.
2. Normal pH of Body Fluids
| Fluid | pH Range |
|---|---|
| Arterial blood | 7.35 - 7.45 |
| Venous blood | 7.32 - 7.38 |
| Intracellular fluid | ~7.0 - 7.2 |
| Urine | 4.5 - 8.0 (avg ~6.0) |
| Gastric juice | < 2.0 |
| Pancreatic juice | ~8.0 |
3. BUFFERS OF BODY FLUIDS
A. Bicarbonate/Carbonic Acid Buffer System (Most Important Plasma Buffer)
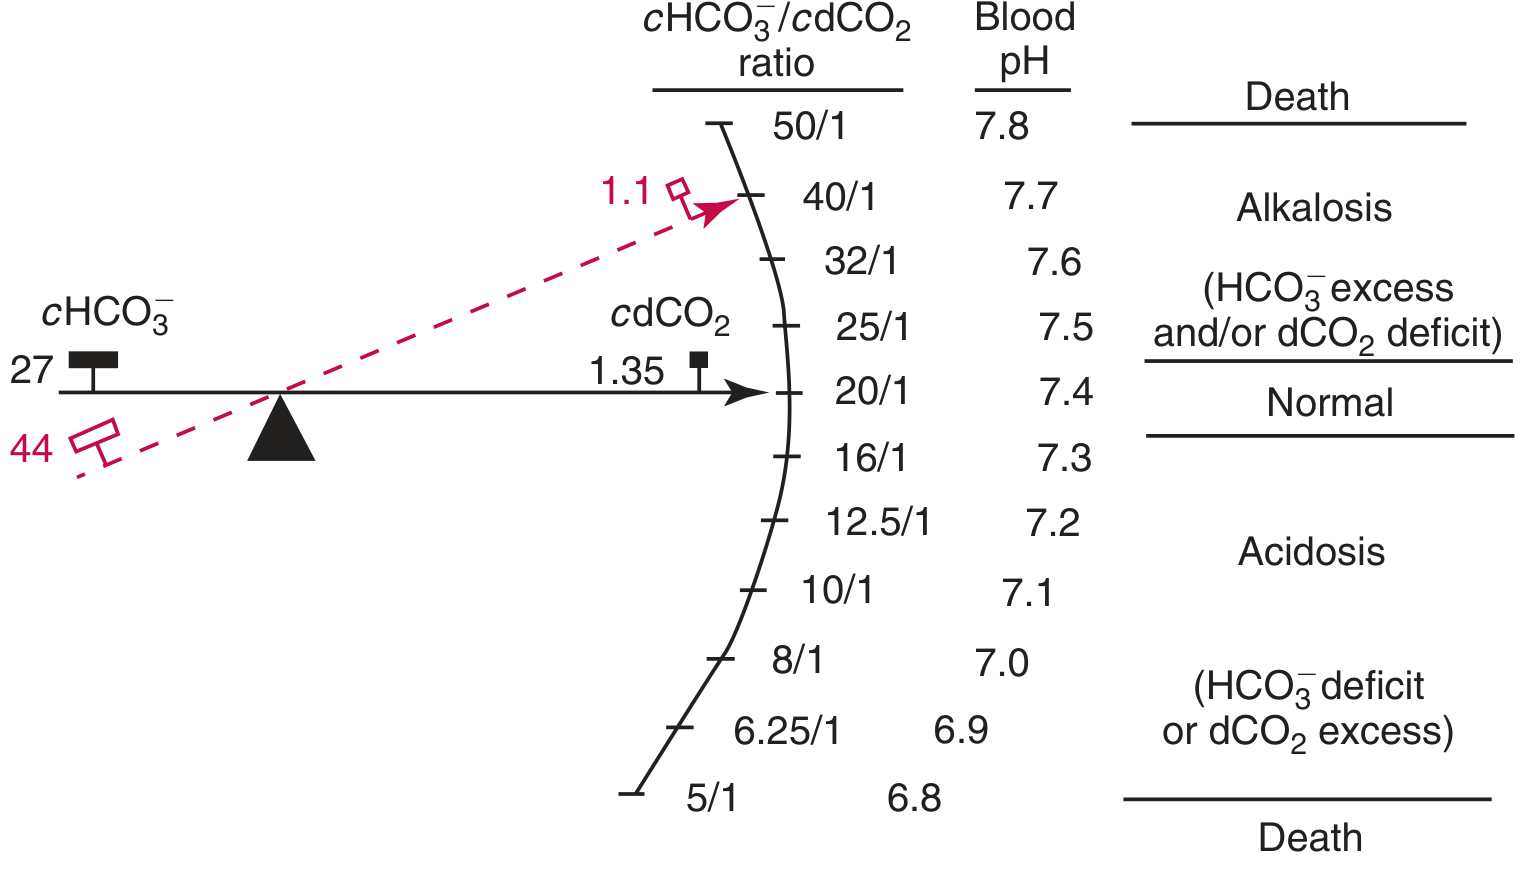
- The lungs can rapidly dispose of or retain CO2 (open system - far greater buffering power)
- It is present at high concentrations (24 mmol/L HCO3-)
- The kidneys can increase or decrease bicarbonate reclamation
- Buffer value (β) of the bicarbonate buffer in plasma = 55.6 mmol/L
- PCO2 - regulated by the lungs (respiratory component)
- [HCO3-] - regulated by the kidneys (metabolic/renal component)
- Tietz Textbook of Laboratory Medicine, 7th Ed.
B. Phosphate Buffer System
- pKa = 6.8 (close to plasma pH of 7.4, making it a good buffer)
- At plasma pH 7.4, ratio HPO4²-/H2PO4- = 4:1
- Total concentration accounts for ~5% of the nonbicarbonate buffer value of plasma
- Organic phosphate (2,3-DPG in erythrocytes at ~4.5 mmol/L) accounts for ~16% of the nonbicarbonate buffer value of erythrocytes
- Most important in the titration and excretion of acids in urine (urinary buffer)
C. Plasma Protein Buffer System
- Buffer value (β) of nonbicarbonate buffers of plasma = ~7.7 mmol/L at pH 7.40
- Albumin accounts for >90% of the nonbicarbonate buffer value of plasma
- Plasma proteins have multiple titratable groups (imidazole groups of histidine residues are key)
- Reaction during CO2 equilibration: $$\text{CO}_2 + \text{H}_2\text{O} \rightarrow \text{H}_2\text{CO}_3 \rightarrow \text{HCO}_3^- + \text{H}^+$$ $$\text{HPr} \rightarrow \text{H}^+ + \text{Pr}^-$$
- For each HCO3- generated, one nonbicarbonate buffer base disappears
- In alkalosis, excess nonbicarbonate buffer base; in acidosis, negative excess (base consumed)
D. Hemoglobin Buffer System
-
The most abundant nonbicarbonate buffer in blood (present in erythrocytes)
-
Buffer value (β) of nonbicarbonate buffers of erythrocyte fluid = ~63 mmol/L
-
Non-HCO3- buffering power of whole blood = ~25 mM/pH unit
-
Non-HCO3- buffering power of plasma alone = only ~5 mM/pH unit (lacks cellular elements)
-
Hemoglobin buffers the H+ generated when CO2 enters red blood cells in peripheral tissues: $$\text{CO}_2 + \text{H}_2\text{O} \xrightarrow{\text{carbonic anhydrase}} \text{H}^+ + \text{HCO}_3^-$$
-
The H+ is then buffered by deoxyhemoglobin (Hb): Hb + H+ → HHb
-
Isohydric shift (Hamburger phenomenon): HCO3- exits the RBC and Cl- enters to maintain electroneutrality
-
Tietz Textbook of Laboratory Medicine, 7th Ed.; Medical Physiology (Boron)
4. RESPIRATORY REGULATION OF pH
- Acidosis (↓ pH or ↑ CO2) → stimulates peripheral and central chemoreceptors → hyperventilation → ↑ CO2 blown off → pH rises
- Alkalosis (↑ pH or ↓ CO2) → hypoventilation → CO2 retained → pH falls
5. RENAL MECHANISMS IN ACID-BASE REGULATION
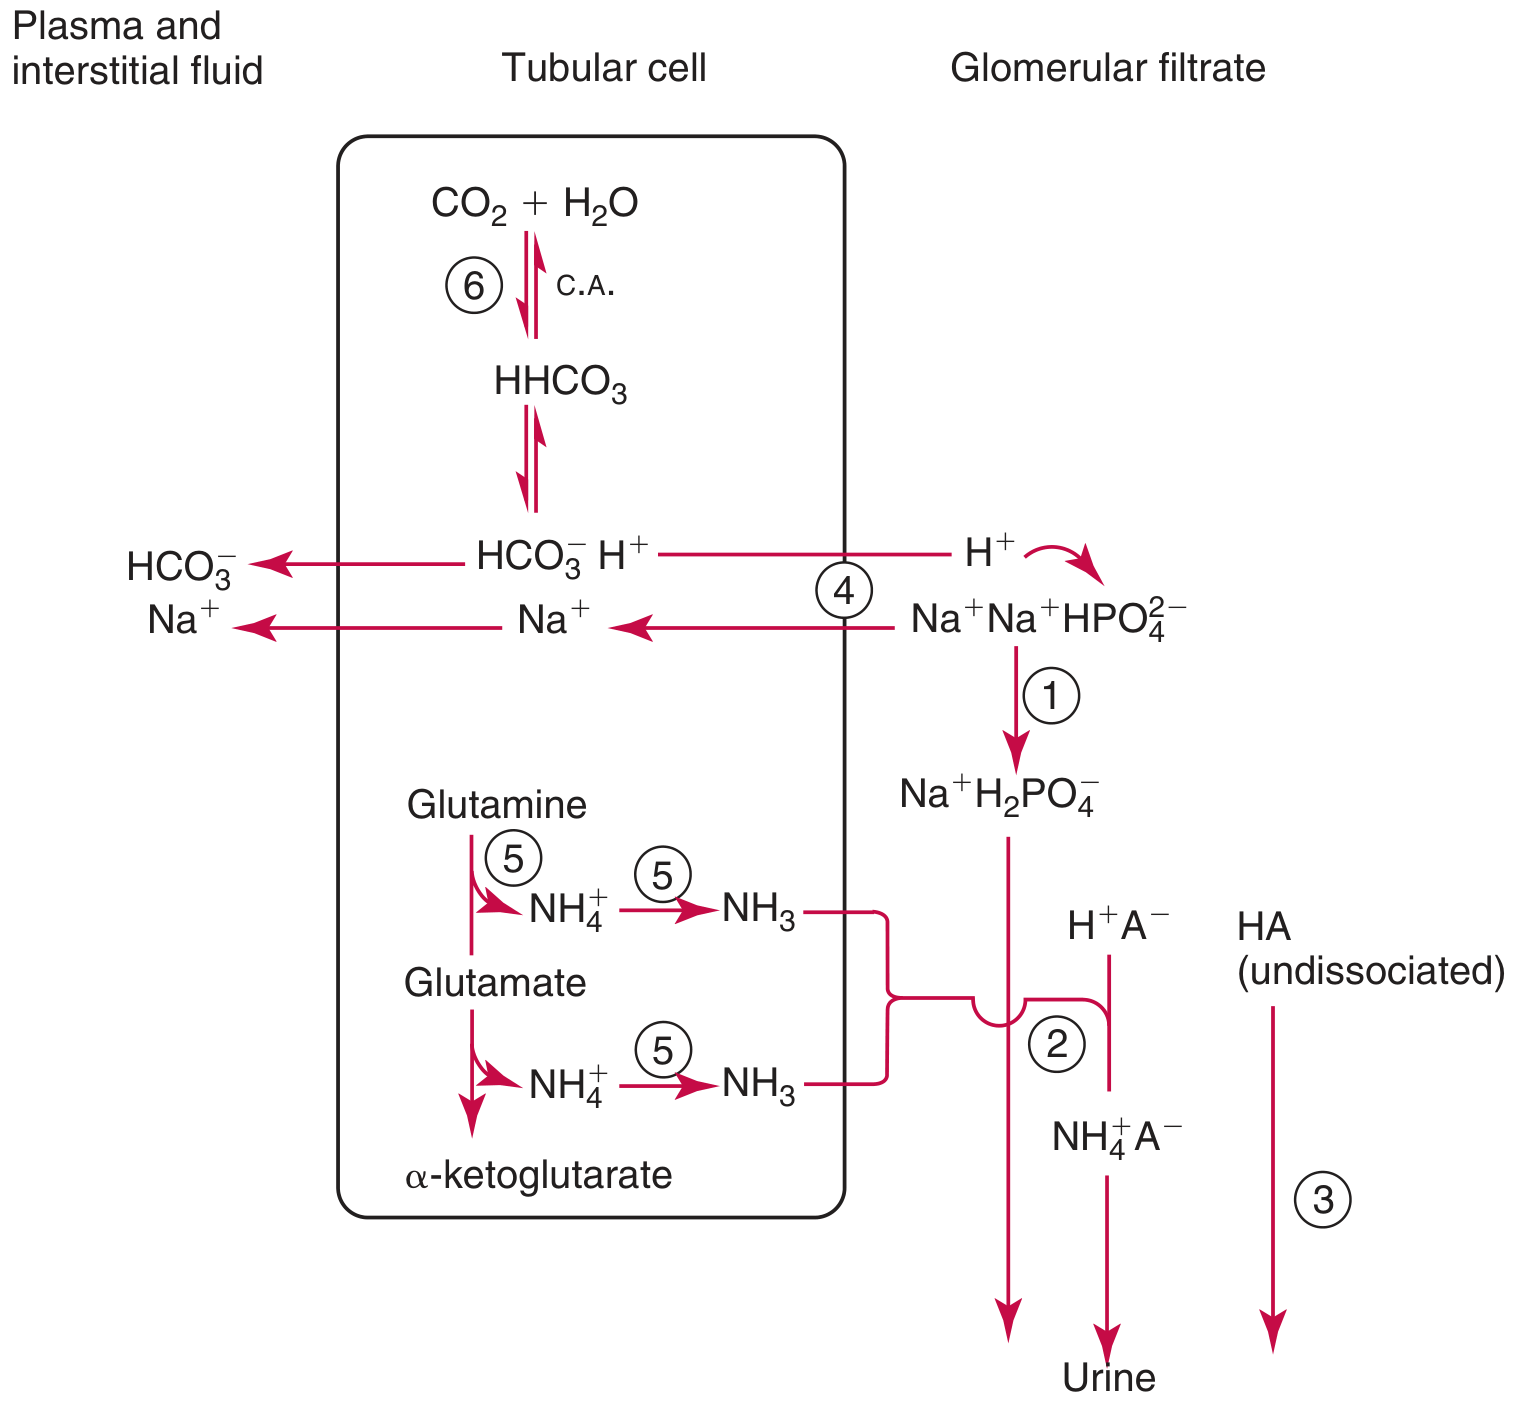
Mechanism 1: Na+-H+ Exchange
- The Na+/H+ exchanger (NHE) exchanges luminal Na+ for intracellular H+
- Isoforms NHE-1 and NHE-3 are predominant in renal tubules
- Enhanced in acidosis, inhibited in alkalosis - both isoforms are transcriptionally upregulated by acidosis
- The proximal tubule cannot maintain >1 pH unit gradient; distal tubules can maintain up to 3 pH units
- Maximum urine acidity reached at ~pH 4.4
- Defective in Type 1 and Type 4 Renal Tubular Acidosis (RTA)
- K+ competition: Hyperkalemia → more K+ exchanged for Na+ → less H+ excreted → acidosis; Hypokalemia → more H+ exchanged → urine acidified → alkalosis
Mechanism 2: Ammonia Production and NH4+ Excretion
- Renal tubular cells deamidate glutamine → NH3 + glutamate (or alpha-ketoglutarate)
- NH3 (lipid-soluble) diffuses freely into tubular lumen
- In the lumen: NH3 + H+ → NH4+ (trapped, cannot diffuse back = ionic trapping)
- NH4+ is excreted in urine, carrying H+ out of the body
- This process is upregulated in chronic acidosis (up to 10-fold increase in glutamine deamidation)
Mechanism 3: Reclamation of HCO3-
-
~4500 mEq of HCO3- is filtered daily at the glomerulus
-
85-90% reabsorbed in the proximal tubule, remainder in distal tubule/collecting duct
-
Mechanism: H+ secreted into lumen combines with filtered HCO3- → H2CO3 → CO2 + H2O (catalyzed by carbonic anhydrase on brush border)
-
CO2 diffuses into tubular cell → recombines with H2O → H2CO3 → H+ + HCO3- (catalyzed by intracellular carbonic anhydrase)
-
HCO3- exits to peritubular capillary via basolateral membrane; H+ is secreted again
-
In acidosis: HCO3- reclamation is maximized
-
In alkalosis: excess HCO3- is excreted in urine
-
Tietz Textbook of Laboratory Medicine, 7th Ed.
6. NOTE ON REGULATION OF pH IN THE BODY
| Defense Mechanism | Speed | Extent |
|---|---|---|
| Chemical buffers (bicarbonate, phosphate, protein, Hb) | Immediate (seconds) | Partial - "first responder" |
| Respiratory regulation (CO2 elimination/retention) | Minutes | Partial - 75% correction |
| Renal regulation (HCO3- reclamation, H+ excretion) | Hours to days | Complete - "final defense" |
- pH is controlled by the ratio: HCO3- (kidney) / PCO2 (lungs)
- Acidemia = pH < 7.35 | Alkalemia = pH > 7.45
- Acidosis/alkalosis can be metabolic (primary HCO3- disturbance) or respiratory (primary PCO2 disturbance)
- Compensation always moves the pH back toward normal but rarely to exactly 7.40 by a single mechanism
- Tietz Textbook of Laboratory Medicine, 7th Edition - Sections on Buffer Systems, Acid-Base Balance, and Renal Mechanisms in Regulation of Acid-Base Balance
- Medical Physiology (Boron & Boulpaep) - Chapter on Acid-Base Physiology (Walter Boron), pp. 921-924