Give an actual real life example of how ppv gets affected by prevalance of disease
Reading File
Finding Sources
Searching the Web
PPV positive predictive value prevalence real life clinical example mammography HIV
Reading File
Reading File
Reading File
Reading File
Here's a concrete, real-world walk-through of how PPV is crushed by low prevalence — using three actual clinical examples.
PPV and Prevalence: The Core Relationship
PPV = TP / (TP + FP)
The sensitivity and specificity of a test are fixed properties. But the PPV changes dramatically depending on how common the disease is in the population you're testing. When prevalence is low, false positives pile up and swamp the true positives — even with an excellent test.
Example 1: Cardiac Troponin / AMI Marker — Same Test, Two Populations
(Henry's Clinical Diagnosis and Management by Laboratory Methods)
Use a cardiac marker with sensitivity 98%, specificity 90% and test 1000 people.
| Population | Prevalence | True Positives | False Positives | PPV |
|---|---|---|---|---|
| Hospital ward (high suspicion) | 50% (500 with AMI) | 490 | 50 | 91% |
| General outpatient clinic | 5% (50 with AMI) | 49 | 95 | 34% |
The test didn't change. The patients did. At 5% prevalence, almost 2 out of 3 positive results are false alarms. A patient flagged as having an AMI in a low-prevalence setting is more likely not to have one.
Example 2: HIV Testing — Adolescents vs. High-Risk Adults
This is perhaps the most cited real-life example. A 2025 study of US HIV Ag/Ab testing found:
- Overall PPV: 68.4%
- Adolescents aged 13–14: PPV only 26.7%
- High-risk adults: PPV much higher
Why? HIV prevalence among 13–14-year-olds is extremely low. Even though the test performs well in high-risk groups, in a low-prevalence population, most reactive results are false positives. This is precisely why reactive HIV screening tests always require confirmatory testing before a diagnosis is made — the PPV of the screening test alone is unacceptably low in low-prevalence groups.
Example 3: Choriocarcinoma Screening After Molar Pregnancy
(Tietz Textbook of Laboratory Medicine, 7th ed.)
Using a test with sensitivity = specificity = 99% in 1000 women:
| Population | Prevalence | True Positives | False Positives | PPV |
|---|---|---|---|---|
| Women with prior molar pregnancy | 8% | 79.2 | 9.2 | 89.6% |
| General population | 1% | 9.9 | 9.9 | 50.0% |
Even with a near-perfect test (99%/99%), PPV drops from ~90% to just 50% when prevalence falls from 8% to 1%. Screening the general population would mean that half of all "positives" are actually disease-free women — causing enormous harm from unnecessary treatment.
This is exactly why choriocarcinoma screening is restricted to women with a prior molar pregnancy (prevalence ~3–10%) — a deliberate strategy to keep PPV high.
The Universal Rule
| Prevalence | PPV (test sensitivity 90%, specificity 90%) |
|---|---|
| 0.01% | 0.09% |
| 0.1% | 0.9% |
| 5% | 32% |
| 50% | 90% |
(Henry's Clinical Diagnosis, Table 8.6)
The takeaway: A positive test result in a low-prevalence population (e.g., screening a healthy general population) is far more likely to be a false positive than a true positive — regardless of how good the test is. This is why most cancer screening programs target high-risk subgroups, and why any positive screen requires confirmatory testing before clinical action.
Sensitivity and specificity are inversely proportional?
Finding Sources
Searching the Web
sensitivity specificity tradeoff cutoff threshold ROC curve inverse relationship explained
Finding Sources
Reading File
Loading Image
Yes — but with a critical nuance. They are not inherently inversely proportional as fixed properties of a test. They are inversely related within the same test when you move the cutoff threshold. Here's the precise explanation:
The Correct Statement
Sensitivity and specificity trade off against each other when you change the cutoff point of a quantitative test. They are NOT fixed, absolute inverses — they are properties that move in opposite directions as you shift the decision threshold.
Tietz Textbook actually flags this as a commonly confused point in an MCQ:
"When the cut-off value of a quantitative test is increased, the specificity increases and the sensitivity declines."
Why This Happens — The Overlapping Distributions
Imagine a test (e.g., blood glucose, troponin, PSA) that produces a numerical result. Diseased and non-diseased people have overlapping distributions. You draw a cutoff line:
- Lower the cutoff → You call more results "positive" → You catch more true cases (↑ sensitivity) → But you also flag more healthy people (↓ specificity)
- Raise the cutoff → Fewer results are "positive" → You miss some true cases (↓ sensitivity) → But you correctly exclude more healthy people (↑ specificity)
This is a tradeoff, not a mathematical inverse formula. It's a consequence of the overlap between the two populations.
The ROC Curve Visualizes This Tradeoff
The ROC curve plots every possible cutoff simultaneously — sensitivity (y-axis) vs. 1−specificity (x-axis):
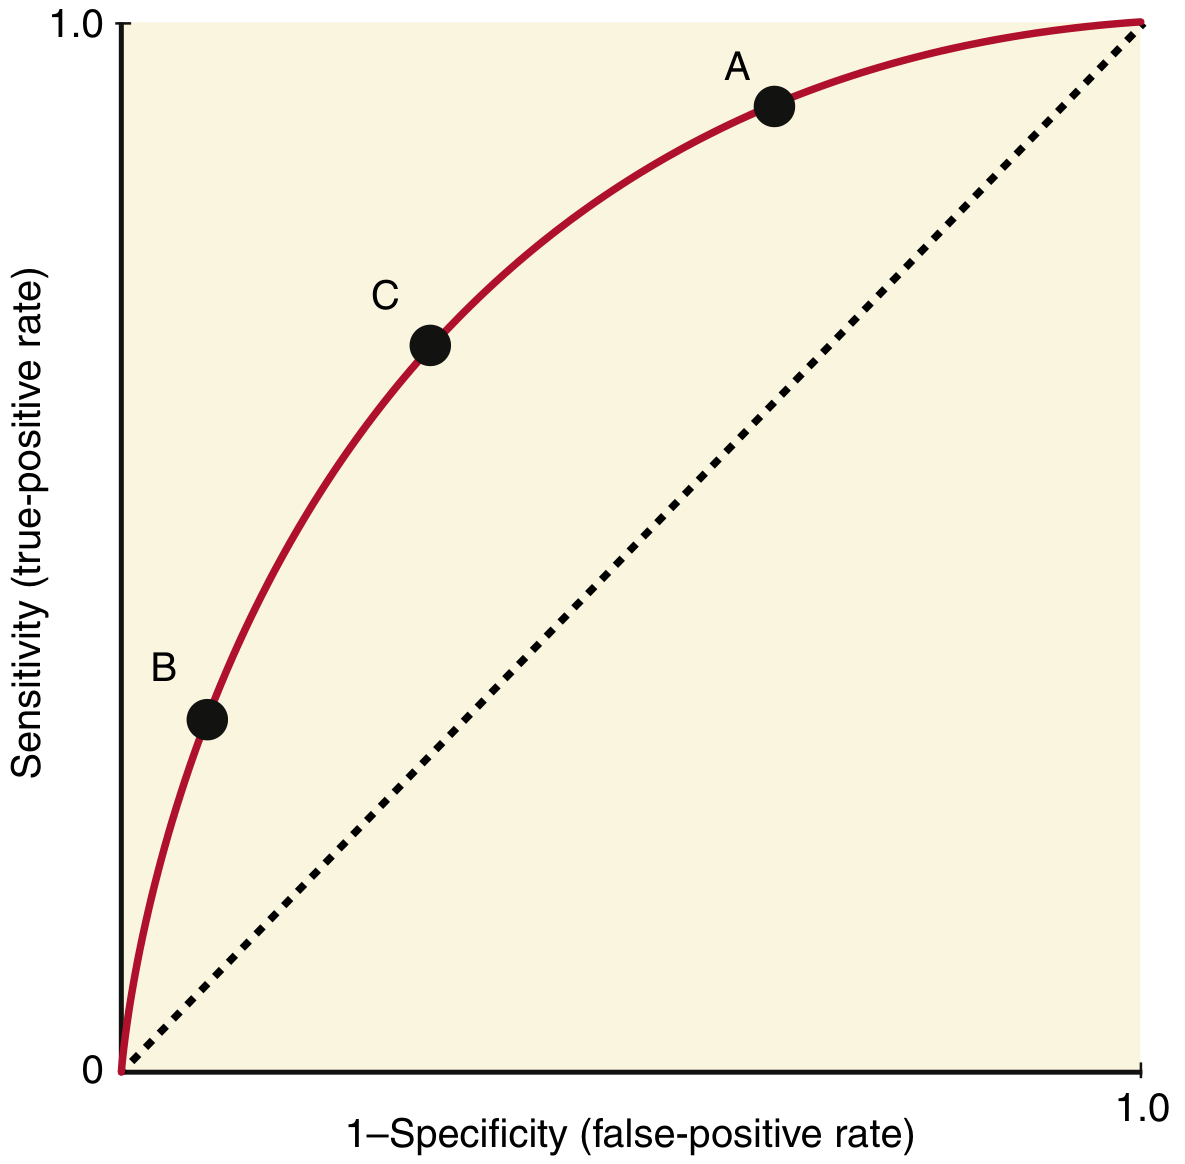
- Point A: Cutoff is low → high sensitivity, low specificity (many false positives)
- Point B: Cutoff is high → low sensitivity, high specificity (many false negatives)
- Point C: Optimal cutoff — maximizes both simultaneously (farthest point from the diagonal)
(Henry's Clinical Diagnosis and Management by Laboratory Methods)
When They Are NOT Inversely Related
Sensitivity and specificity are independent for different tests. You can have:
- Test X: sensitivity 95%, specificity 95% (a better test)
- Test Y: sensitivity 60%, specificity 40% (a worse test)
Test X beats Test Y on both metrics — no tradeoff. This is captured by a higher AUC (area under the ROC curve). A test with a larger AUC is superior to another at all cutoff points, not just some.
Clinical Application
| Goal | Adjust cutoff | Effect |
|---|---|---|
| Screening (don't miss disease — "rule out") | Lower cutoff | ↑ sensitivity, ↓ specificity |
| Confirmation (rule in disease before toxic treatment) | Raise cutoff | ↑ specificity, ↓ sensitivity |
Bottom line: Sensitivity and specificity trade off within a test as the cutoff moves. They are not inversely proportional in an absolute mathematical sense — a better test can have both higher simultaneously.
This is a shared conversation. Sign in to Orris to start your own chat.