
Explain dialysis to me
hemodialysis peritoneal dialysis mechanism diagram
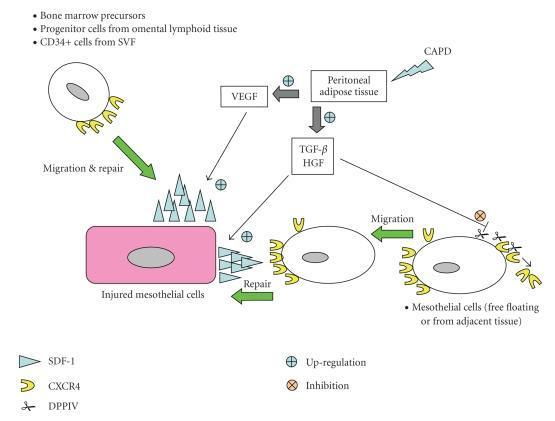
This pathophysiology diagram illustrates the signaling pathways and cellular mechanisms involved in the repair of injured mesothelial cells during continuous ambulatory peritoneal dialysis (CAPD). The schematic shows the interplay between peritoneal adipose tissue and mesothelial regeneration. Peritoneal adipose tissue, influenced by CAPD and up-regulated by VEGF, secretes TGF-̢ and HGF. These factors stimulate the up-regulation of the SDF-1 (stromal-derived factor-1) chemokine on injured mesothelial cells. SDF-1 (blue triangles) acts as a ligand for CXCR4 receptors (yellow U-shapes) on migrating cells, including bone marrow precursors, omental lymphoid progenitor cells, and CD34+ cells from the stromal vascular fraction (SVF). A regulatory mechanism is depicted where DPPIV (represented by scissors) cleaves the CXCR4 receptor to inhibit migration. The diagram highlights the SDF-1/CXCR4 axis as a critical driver for cell trafficking, recruitment, and subsequent repair and re-epithelialization of the peritoneal membrane after injury.
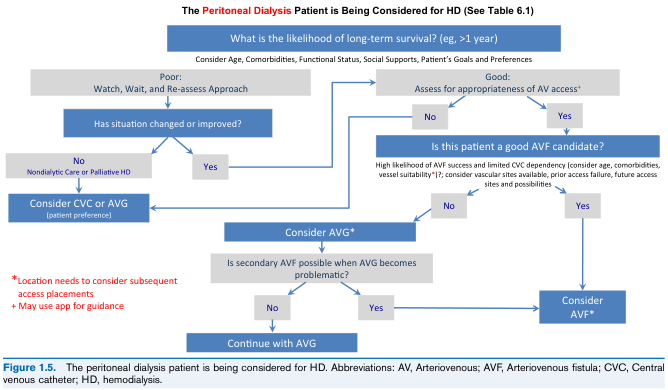
Summary : This flowchart outlines the decision-making process for selecting hemodialysis (HD) access in peritoneal dialysis patients, based on their likelihood of long-term survival, comorbidities, and suitability for arteriovenous (AV) access. flowchart: # Nodes : • Start (rectangle): "What is the likelihood of long-term survival? (eg, >1 year)" • Decision (rectangle): "Consider Age, Comorbidities, Functional Status, Social Supports, Patient’s Goals and Preferences" • Branch (rectangle): "Poor: Watch, Wait, and Re-assess Approach" • Branch (rectangle): "Good: Assess for appropriateness of AV access*" • Decision (rectangle): "Has situation changed or improved?" • Outcome (rectangle): "No: Nondialytic Care or Palliative HD" • Outcome (rectangle): "Yes" • Action (rectangle): "Consider CVC or AVG (patient preference)" • Decision (rectangle): "Is this patient a good AVF candidate?" • Outcome (rectangle): "No" • Outcome (rectangle): "Yes" • Action (rectangle): "Consider AVG*" • Decision (rectangle): "Is secondary AVF possible when AVG becomes problematic?" • Outcome (rectangle): "No" • Outcome (rectangle): "Yes" • Action (rectangle): "Continue with AVG" • Action (rectangle): "Consider AVF*" # Connectors : • The flow starts at the top with the likelihood of long-term survival. • If "Poor", proceed to "Watch, Wait, and Re-assess Approach". • From "Watch, Wait, and Re-assess Approach", ask "Has situation changed or improved?". – If "No", go to "Nondialytic Care or Palliative HD", then to "Consider CVC or AVG (patient preference)". – If "Yes", go to "Consider CVC or AVG (patient preference)". • If "Good", proceed to "Assess for appropriateness of AV access*". – If "No", go to "Consider CVC or AVG (patient preference)". – If "Yes", ask "Is this patient a good AVF candidate?". – If "No", go to "Consider AVG*". – Then ask "Is secondary AVF possible when AVG becomes problematic?". – If "No", go to "Continue with AVG". – If "Yes", go to "Consider AVF*". – If "Yes", go to "Consider AVF*". # Layout : • The chart is organized horizontally, starting from a central question at the top, splitting into two main branches ("Poor" and "Good"), with further decision nodes and outcomes. • Arrows indicate the direction of flow, with diamonds for decision points and rectangles for actions/outcomes. • Red asterisks and notes highlight that AV access location should consider future placements and that an app may be used for guidance. # Analysis : • The flowchart provides a structured approach to HD access selection, prioritizing AVF when possible, but allowing for AVG or CVC based on patient condition, prognosis, and vessel suitability. • The process emphasizes reassessment for patients with poor prognosis and careful evaluation for AV access in those with better survival likelihood. • Decision points ensure that patient preferences and future access needs are considered at each step.
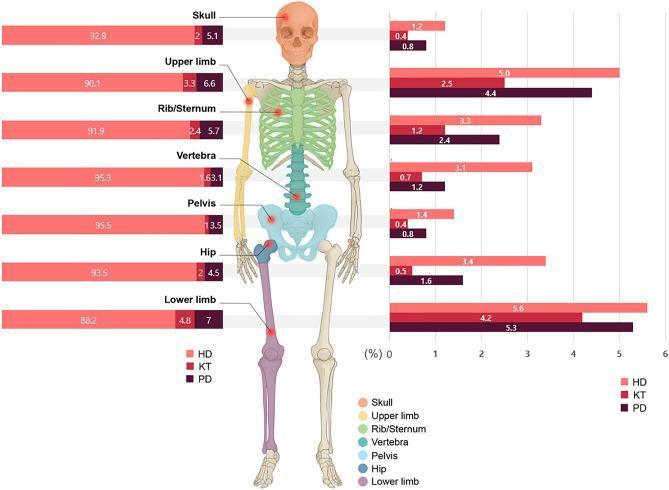
A multi-panel medical infographic illustrating the relationship between fracture anatomical sites and kidney replacement therapy (KRT) modalities: Hemodialysis (HD), Kidney Transplant (KT), and Peritoneal Dialysis (PD). The central element is a color-coded human skeletal diagram highlighting seven anatomical regions: skull, upper limb, rib/sternum, vertebra, pelvis, hip, and lower limb. The left panel features horizontal stacked bar charts showing the proportion (%) of each KRT modality within specific fracture cohorts, demonstrating that HD patients consistently comprise the vast majority (approx. 88-95%) of patients at every fracture site. The right panel displays clustered horizontal bar graphs showing the frequency (%) of fractures at each site stratified by modality. This data indicates that the HD group has the highest fracture frequency across all sites compared to PD and KT, with the upper and lower limbs being the most frequent sites of injury. This comparison chart serves as a clinical epidemiology resource for understanding bone mineral disorders and fracture risk in end-stage kidney disease (ESKD) populations.
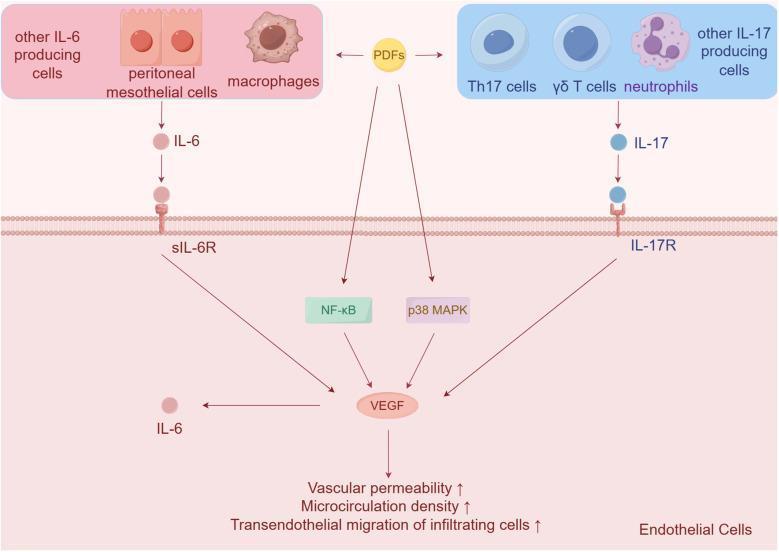
A pathophysiology diagram illustrating the signaling pathways within endothelial cells during peritoneal dialysis (PD). The schematic shows how peritoneal dialysis fluids (PDFs) and inflammatory cytokines drive vascular changes. On the left, IL-6 is produced by peritoneal mesothelial cells, macrophages, and other cells, subsequently binding to the soluble IL-6 receptor (sIL-6R). On the right, IL-17 is produced by Th17 cells, gamma-delta T cells, and neutrophils, binding to the IL-17 receptor (IL-17R). Both receptor-mediated pathways, along with the PDF-induced activation of NF-κB and p38 MAPK signaling, converge to upregulate Vascular Endothelial Growth Factor (VEGF). This increase in VEGF is shown to drive three key pathological alterations in the endothelial cells: increased vascular permeability, increased microcirculation density, and increased transendothelial migration of infiltrating cells. The diagram highlights the molecular mechanisms of peritoneal inflammation and angiogenesis, which can lead to reduced efficacy of peritoneal dialysis over time.
hemodialysis machine circuit blood flow dialyzer
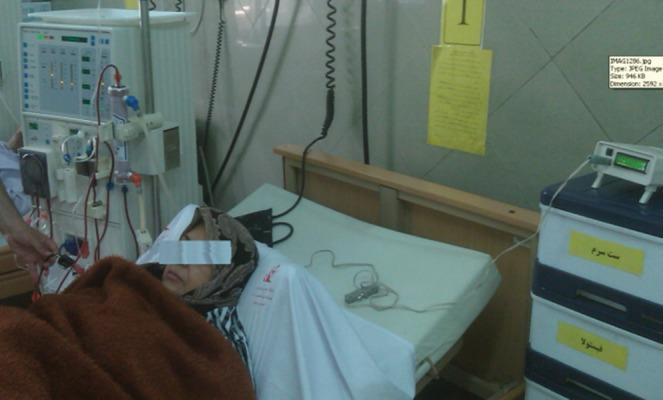
A clinical photograph depicting a patient undergoing hemodialysis in a hospital setting. The patient is lying in a semi-fowler's position on a clinical bed, with their eyes covered for privacy. To the left of the bed, a large hemodialysis machine is visible, featuring a complex arrangement of blood tubing, a dialyzer (artificial kidney), and a control panel with monitoring displays. A blood pressure cuff is applied to the patient's arm to monitor cardiovascular stability during the procedure. Positioned on a storage unit to the right is a specialized Relative Blood Volume (RBV) monitor, a research-oriented electronic device with a digital LCD, which is connected via sensors to the dialysis circuit. This setup illustrates the clinical integration of non-invasive optical sensors used to monitor hemoconcentration and fluid shifts in real-time to prevent complications like intradialytic hypotension. The background shows clinical infrastructure, including wall-mounted medical gas lines and labeled equipment drawers in a sterilized environment.
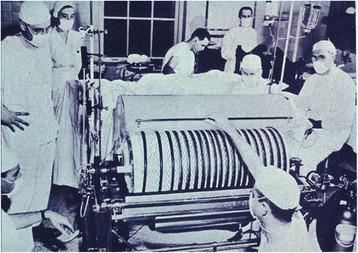
This historical clinical photograph depicts an early iteration of a medical dialyzer, specifically the Kolff-Alwall rotating drum kidney, used for hemodialysis. The device features a large, horizontally oriented cylindrical drum constructed with longitudinal ridges. Wrapped around this drum are numerous parallel windings of semi-transparent cellophane tubing, which served as the semi-permeable membrane for blood filtration. The tubing is visible as dark bands against the lighter drum surface, representing the path where blood would flow to facilitate solute exchange via osmosis and diffusion when submerged in a dialysate bath. The apparatus is surrounded by medical staff in surgical attire, including masks and caps, highlighting the clinical setting of early renal replacement therapy. Supporting infrastructure including intake/output pipes and a metal frame for drum rotation are visible, illustrating the mechanical complexity required to treat acute renal failure before the miniaturization of modern hollow-fiber dialyzers.
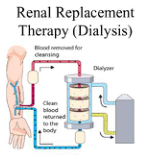
Summary : This illustration explains the process of renal replacement therapy (dialysis), showing how blood is removed from the body, cleansed in a dialyzer, and then returned. illustration: # Scene Overview : • Main subject is a schematic diagram of dialysis treatment. • Shows a human arm with blood vessels connected to a dialysis circuit. • The circuit includes a dialyzer (depicted as a cylindrical device) and a machine. # Technical Details : • Labels: "Blood removed for cleansing", "Dialyzer", "Clean blood returned to the body". • Blood flow is indicated by colored arrows: red (blood out), blue (clean blood in), yellow (waste removal). • The dialyzer is shown with internal layers, suggesting filtration. # Spatial Relationships : • Blood is drawn from the arm, passes through tubing to the dialyzer, then returns to the arm. • Waste products exit the dialyzer to a separate container/machine. # Analysis : • The diagram visually clarifies the dialysis process: blood is removed, filtered, and returned, with waste separated out. The flow is unidirectional and cyclical, emphasizing the cleansing function of the dialyzer in renal replacement therapy.
Dialysis - A Complete Guide
Why is Dialysis Needed?
How Dialysis Works - Core Mechanisms
1. Diffusion
2. Ultrafiltration / Convection
The Two Main Types of Dialysis
1. Hemodialysis (HD)
- Arteriovenous (AV) fistula - surgically joining an artery and vein, usually in the forearm. This is the preferred access as it is durable and has the lowest infection risk, but requires weeks to months to mature after creation.
- AV graft - a synthetic tube connecting artery to vein; used when fistula creation is not possible.
- Tunneled dialysis catheter - placed in the internal jugular or subclavian vein; used as a bridge while fistula matures (up to 6 months), but carries higher infection risk.
- Non-tunneled catheter - temporary access in femoral or jugular vein, used short-term (1-2 weeks) in the inpatient setting.
- 3-4 hours per session, three times per week for outpatient ESRD management
- Can remove approximately 3-4 L of fluid per session safely in hemodynamically stable patients
- Blood and dialysis solution flow in opposite directions (countercurrent) to maximize the concentration gradient and efficiency
URR = [(Pre-BUN - Post-BUN) / Pre-BUN] × 100
2. Peritoneal Dialysis (PD)
- The osmotic agent in most PD solutions is dextrose (1.5 to 4.25 g/dL), which draws fluid from blood vessels into the peritoneal cavity.
- Icodextrin is a non-glucose alternative that avoids hyperglycemia and offers better ultrafiltration, though it can interfere with blood glucose meter readings.
- Medications like insulin and antibiotics can be given directly via the intraperitoneal route for smoother absorption.
- Greater patient independence (done at home)
- No anticoagulation required
- Smoother, continuous solute removal without the rapid fluid and electrolyte shifts of HD
- Better for hemodynamically unstable patients
Continuous Renal Replacement Therapy (CRRT)
- CVVHD (continuous venovenous hemodialysis): diffusive clearance only
- CVVHDF (continuous venovenous hemodiafiltration): both diffusive and convective clearance
- SLED (sustained low-efficiency dialysis): 8-12 hours, a middle ground allowing some off-machine time for procedures
Indications for Emergency/Urgent Dialysis
| Indication | Details |
|---|---|
| Acidosis | Metabolic acidosis refractory to bicarbonate |
| Electrolytes | Hyperkalemia refractory to medical management |
| Intoxication | Methanol, ethylene glycol, salicylates, lithium |
| Overload | Pulmonary edema / volume overload refractory to diuretics |
| Uremia | Uremic encephalopathy, pericarditis, asterixis, uremic bleeding |
Hemodialysis vs Peritoneal Dialysis - Comparison
| Feature | Hemodialysis | Peritoneal Dialysis |
|---|---|---|
| Membrane | Synthetic dialyzer | Peritoneal membrane |
| Access | AV fistula, graft, or catheter | Tenckhoff peritoneal catheter |
| Location | Dialysis center or home | Primarily home |
| Schedule | 3x/week, 3-4 hr sessions | Daily exchanges (4-5/day) |
| Anticoagulation | Required | Not required |
| Fluid shifts | Rapid, intermittent | Slow, continuous |
| Main complication | Hypotension, access infection | Peritonitis |
| Glucose effects | Minimal | Hyperglycemia (dextrose-based) |
| Patient independence | Lower (usually center-based) | Higher |
Complications of Dialysis
- Hypotension during treatment - the most common; can worsen AKI by causing ischemic injury
- Access infections - fever and rigors during dialysis warrant empiric anti-staphylococcal coverage
- Disequilibrium syndrome - neurological symptoms from rapid osmotic shifts, especially in new patients
- Air embolism - rare but potentially fatal
- Clotting of the circuit - requires anticoagulation
- Peritonitis - abdominal pain, cloudy effluent; usually treated with intraperitoneal antibiotics
- Catheter-related infections - exit-site or tunnel infections
- Ultrafiltration failure - membrane loses efficiency over time
- Hernia formation - from raised intraabdominal pressure
Key Points Summary
- Dialysis replaces the filtration function of failed kidneys but not their hormonal functions (EPO production, vitamin D activation)
- Transport mechanisms: diffusion (waste removal down gradient) + ultrafiltration (fluid removal by pressure)
- Hemodialysis is more efficient but requires vascular access and intermittent sessions
- Peritoneal dialysis is gentler, home-based, and continuous, but risks peritonitis
- CRRT is reserved for hemodynamically unstable ICU patients
- Transplantation remains the best long-term treatment for ESRD when feasible
How to adjust the machine in hemodailysis
Adjusting the Hemodialysis Machine - The Prescription
The Components of a Hemodialysis Prescription
- Treatment duration
- Frequency
- Vascular access
- Dialyzer selection
- Blood flow rate (Qb)
- Dialysate flow rate (Qd)
- Ultrafiltration rate / target
- Dialysate composition
- Anticoagulation
- Dialysate temperature
- Intradialytic medications
1. Treatment Duration (Time on Machine)
- Never prescribe less than 3 hours - shorter sessions cause rapid electrolyte shifts, increased UF rate, hypotension, and myocardial stunning.
- Reducing session length below 3 hours reduces clearance of larger molecules (e.g., beta-2 microglobulin), increases cardiovascular risk, and increases intradialytic symptoms (nausea, cramps).
- Observational data show strong survival benefit for sessions ≥ 4 hours, partly because a lower UF rate (below 10 mL/kg/hour) improves cardiovascular stability.
- Efficiency declines after 4-5 hours (urea rebounds), so sessions >5 hours show diminishing returns for small-molecule clearance.
- Longer/more frequent sessions are used for: larger patients, severe volume overload, hyperphosphatemia, or when a higher Kt/V target is needed. - NKF Primer on Kidney Diseases, p. 600-601
| Regimen | Frequency | Session Length | Notes |
|---|---|---|---|
| Conventional | 3x/week | 3-4 hrs | Standard in-center |
| Short daily | 5-6x/week | ~3 hrs | Improves LV mass, BP, phosphate |
| Nocturnal | 3-5x/week | 6-8 hrs (while sleeping) | Best solute clearance; limited adoption |
2. Dialyzer Selection
- Membrane surface area - larger = higher clearance. Adjust up for larger patients or when Kt/V is inadequate.
- High-flux vs low-flux - high-flux membranes are now standard; they remove larger middle molecules (beta-2 microglobulin, cytokines) that low-flux membranes cannot.
- KoA (mass transfer coefficient) - a fixed property of the dialyzer indicating urea clearance capacity; choose a dialyzer with higher KoA when blood or dialysate flow rates cannot be increased further. - Comprehensive Clinical Nephrology 7th Ed., p. 1295
3. Blood Flow Rate (Qb)
- Increasing Qb directly increases solute clearance and dialysis efficiency (Kt/V).
- Minimum: 250 mL/min for adequate therapy (KDOQI).
- Typical target: 300-400 mL/min for most patients.
- Limited by the vascular access: AV fistulas can usually support 400+ mL/min; catheters are often limited to 300-350 mL/min due to flow resistance.
- When to increase Qb: Inadequate Kt/V or URR, large patient (high urea distribution volume V), or when Kt/V target is not being met.
- When to reduce Qb: Access dysfunction (poor arterial inflow), recirculation, or catheter malfunction.
Higher Qb = better clearance, but the gain diminishes at very high flow rates because the blood-dialysate concentration gradient falls as dialysate becomes saturated. - NKF Primer, p. 600
4. Dialysate Flow Rate (Qd)
- Counter-current flow maintains the concentration gradient between blood and dialysate throughout the dialyzer, maximizing diffusive clearance.
- At a Qb of 300 mL/min, increasing Qd from 500 to 800 mL/min raises urea clearance by approximately 10-15%.
- Adjustment: When Kt/V remains low despite adequate Qb and treatment time, increasing Qd to 800 mL/min is a simple intervention.
- At very high Qb (>400 mL/min), Qd may need to match proportionally to maintain gradient efficiency. - Tintinalli's Emergency Medicine
5. Ultrafiltration (UF) Rate and Target
Setting the UF Target:
- Weigh the patient on arrival.
- Compare to their dry weight (euvolemic target weight, assessed clinically).
- The difference = fluid to remove. E.g., if a patient gained 3 kg since last session, set UF target = 3 L.
UF Rate:
- UF target is spread evenly over the treatment time.
- Safe limit: ≤ 10 mL/kg/hour - exceeding this is associated with intradialytic hypotension, myocardial stunning, and increased mortality.
- Example: 70 kg patient needing 3 L removed over 4 hours = 3000/4 = 750 mL/hr = 10.7 mL/kg/hr - slightly high, so consider extending session to 4.5 hours.
When UF rate is too high:
- Extend treatment time - the primary intervention.
- Reduce interdialytic weight gain through sodium/fluid restriction counseling.
- Use sodium modeling (higher dialysate Na early in session) cautiously - maintains intravascular volume but increases thirst and interdialytic weight gain.
- Lower dialysate temperature (see below) to improve hemodynamic tolerance. - Washington Manual of Medical Therapeutics, p. 503-504
6. Dialysate Composition
A. Sodium (Standard: 138-140 mEq/L)
| Setting | Effect | Use when |
|---|---|---|
| Higher (140-145 mEq/L) | Hemodynamic stability, fewer cramps | Patient is hypotension-prone during HD |
| Lower (135-138 mEq/L) | Less thirst, less interdialytic weight gain, better BP control | Patient has chronic hypertension or high weight gains |
- Standard practice: match dialysate Na to patient's predialysis serum Na to avoid osmotic stress.
- Sodium modeling (ramping): Starting with higher Na (e.g., 145 mEq/L) and tapering down during the session - helps hemodynamic stability but increases weight gain and BP; now largely abandoned except in select patients.
B. Potassium (Individualized: 1-4 mEq/L)
| Setting | Use when | Caution |
|---|---|---|
| 2-3 mEq/L | Most patients (standard) | Balance between removal and arrhythmia risk |
| 1 mEq/L | Persistent predialysis hyperkalemia >6.5 mEq/L | Only after dietary and medication optimization; risk of arrhythmias |
| 3-4 mEq/L | Digoxin therapy; hypokalemia risk | Patients on digoxin should never be below 2 mEq/L |
| 0 mEq/L | Should be abandoned - associated with sudden death | - |
- Optimal predialysis serum K: 4.6-5.3 mEq/L.
- Potassium modeling (gradual step-down during session) may reduce arrhythmia risk by keeping the blood-to-dialysate gradient constant. - Brenner and Rector's The Kidney, p. 2734
C. Calcium (Standard: 1.25-1.5 mmol/L)
| Setting | Effect | Use when |
|---|---|---|
| Higher (1.5 mmol/L) | PTH suppression, better cardiac contractility, hemodynamic stability | Hypocalcemia, hemodynamically unstable patients |
| Lower (1.25 mmol/L) | Allows more calcium-containing phosphate binders | Hypercalcemia, vascular calcification, adynamic bone disease |
D. Bicarbonate (Standard: 35-40 mEq/L)
| Setting | Effect | Use when |
|---|---|---|
| Higher (38-40 mEq/L) | Better acidosis control | Persistent predialysis metabolic acidosis |
| Lower (35 mEq/L) | Avoids post-dialytic alkalosis | Post-dialytic alkalosis; both extremes are associated with increased mortality |
- Target: predialysis serum bicarbonate 22-26 mEq/L.
- Excessively high dialysate bicarb causes post-session alkalosis, which paradoxically increases mortality.
E. Glucose (Standard: 5.5 mmol/L, ~100 mg/dL)
- Matched to plasma glucose to avoid osmotic-driven fluid shifts.
- Lower in diabetics if intradialytic hyperglycemia is a concern.
- Higher may reduce disequilibrium risk in new patients.
F. Dialysate Temperature (Standard: 36.5-37°C)
- Lowering to 35-36°C significantly reduces intradialytic hypotension by causing peripheral vasoconstriction and improving cardiac output.
- Used routinely for hypotension-prone patients - a simple, effective adjustment that costs nothing. - Brenner and Rector's The Kidney, p. 2733
7. Anticoagulation
- Standard: Unfractionated heparin (UFH)
- Loading dose: 1,000-5,000 units IV bolus at start
- Maintenance: 500-1,500 units/hour during session
- Stopped 30-60 minutes before end to allow clotting at needle sites
- Heparin-free dialysis: For patients with active bleeding or post-surgery - rinse circuit with saline periodically; higher flow rates to prevent clotting
- Regional citrate anticoagulation: Used in CRRT; citrate chelates calcium in the circuit; ionized calcium must be monitored closely
- LMWH: Single pre-session dose; popular in Europe; not easily reversible
- Alternatives for HIT: Argatroban, bivalirudin, lepirudin - Brenner and Rector's The Kidney, p. 2733
8. Measuring Adequacy and Adjusting the Prescription
| Target | Minimum | Clinical meaning |
|---|---|---|
| spKt/V 1.4 per session | 1.2 minimum (KDOQI) | K = dialyzer clearance, t = time, V = urea distribution volume |
| URR ≥ 65% | - | Simpler bedside measure |
- First, check if the session was representative - was it cut short? Was there access recirculation?
- Check for vascular access problems (most common cause of low Kt/V).
- Check for blood sampling errors (delayed post-HD sampling gives falsely low Kt/V).
- Then adjust:
- Increase treatment time (most effective)
- Increase blood flow rate (Qb)
- Increase dialysate flow rate (Qd)
- Switch to a larger or more efficient dialyzer (higher KoA, higher surface area)
- Comprehensive Clinical Nephrology 7th Ed., p. 1295-1296
Quick Reference: Adjustment Summary
| Problem | Machine Adjustment |
|---|---|
| Low Kt/V / URR | Increase time, Qb, Qd, or dialyzer size |
| Intradialytic hypotension | Lower dialysate temp, increase Na, reduce UF rate, extend time |
| Hyperkalemia | Lower dialysate K (min 2 mEq/L; 1 mEq/L only if essential) |
| Persistent acidosis | Increase dialysate bicarbonate |
| Hypercalcemia | Lower dialysate calcium |
| High weight gains/hypertension | Lower dialysate sodium, limit UF rate by extending time |
| Bleeding risk | Heparin-free protocol or regional citrate |
| Phosphate uncontrolled | Longer/more frequent sessions |