
Icp monitoring 10 mark answer
intracranial pressure monitoring devices ventricular catheter intraparenchymal bolt
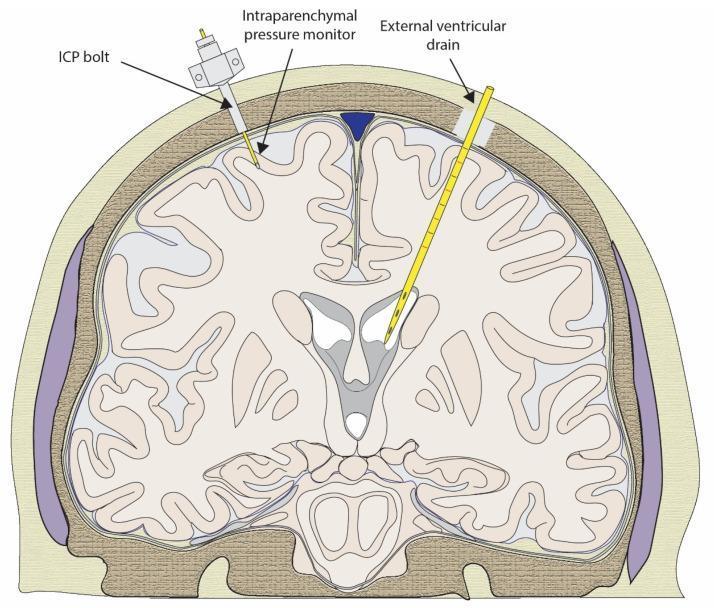
This medical diagram illustrates a coronal section of the human head, focusing on neurosurgical instrumentation for Intracranial Pressure (ICP) monitoring. The schematic depicts the skull, cerebral cortex, sulci, and the ventricular system. On the left side of the diagram, an 'ICP bolt' and 'intraparenchymal pressure monitor' are shown. The device is secured through the skull, with a sensor probe extending into the brain tissue (parenchyma) to monitor local tissue pressure. On the right side, an 'external ventricular drain' (EVD) is illustrated. This catheter is inserted through a burr hole in the skull, traversing the parenchyma to reach the lateral ventricle, allowing for both pressure measurement and drainage of cerebrospinal fluid (CSF). The diagram serves as an educational tool for neurotrauma management, demonstrating the anatomical placement and differences between parenchymal and ventricular monitoring systems in clinical settings such as traumatic brain injury.
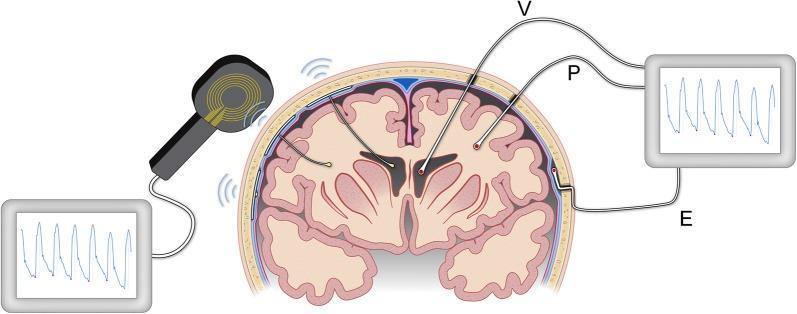
This medical anatomical diagram illustrates the various invasive methods and anatomical locations for monitoring intracranial pressure (ICP) in the human brain. The illustration highlights three primary wired sensor placements: intraventricular (V), where a catheter is placed within the cerebral ventricles; intraparenchymal (P), with a sensor implanted directly into the brain tissue; and epidural (E), where the sensor is positioned between the skull and the dura mater. These sensors are shown connected via physical wires to an external monitor displaying pulsatile ICP waveforms. Additionally, the diagram compares these traditional wired methods with wireless telemetric systems. On the left, implantable sensors in the ventricular or parenchymal spaces communicate via radiofrequency signals with an external receiver held against the scalp, which then transmits data to a digital monitor. This visualization demonstrates the technical evolution from wired catheter-based monitoring to wireless, minimally invasive telemetric technologies used in neurocritical care for managing conditions like hydrocephalus, traumatic brain injury, and subarachnoid hemorrhage.
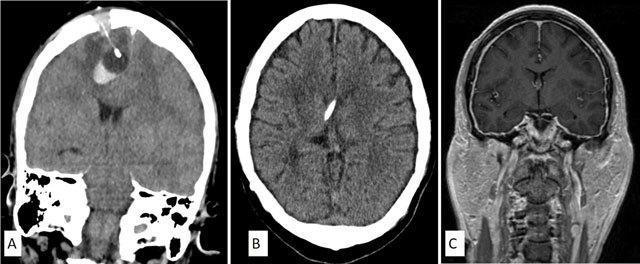
This composite figure consists of three diagnostic images illustrating complications from intracranial devices. Image A is a coronal non-contrast CT scan showing a linear, hyperdense intracranial pressure (ICP) monitoring probe inserted into the right frontal lobe. At the distal tip of the probe, a localized hyperdense ovoid area indicates an acute intraparenchymal hematoma. Image B is an axial CT scan showing a right parietal ventriculoperitoneal (VP) shunt catheter with its tip abutting the septum pellucidum. The lateral ventricles appear markedly compressed or 'slit-like.' Image C is a coronal post-contrast T1-weighted MRI demonstrating persistent slit-like ventricles and diffuse pachymeningeal (dural) thickening and enhancement. These findings are clinically diagnostic of intracranial hypotension resulting from cerebrospinal fluid (CSF) over-drainage via the shunt. This collection serves as an educational resource for identifying hardware-related complications, including placement-induced hemorrhage and shunt-induced hypotension.
Intracranial Pressure (ICP) Monitoring
Introduction and Physiological Basis
- Normal ICP: < 15 mmHg in a supine adult (measured at the level of the foramen of Monro, referenced to the tragus)
- Raised ICP threshold requiring treatment: > 20-22 mmHg (Brain Trauma Foundation 2016 guidelines use >22 mmHg as the treatment trigger)
- Cerebral Perfusion Pressure (CPP) = MAP - ICP; target CPP = 60-70 mmHg
Indications for ICP Monitoring
- Comatose patients (GCS ≤ 8) with structural brain injury on CT
- Severe TBI with abnormal CT scan - evidence of hematoma, contusion, edema, or herniation
- Severe TBI with normal CT but two or more of: age > 40 years, unilateral or bilateral motor posturing, systolic BP < 90 mmHg
- Moderate TBI patients undergoing urgent extracranial surgery (at risk for ICP rise under anaesthesia)
- Large intracranial mass lesions (hematoma, abscess, large infarction) with documented tissue shift - even without trauma
- Subarachnoid hemorrhage (SAH), intracerebral hemorrhage (ICH), or cerebellar stroke producing acute hydrocephalus - typically via ventriculostomy placed primarily for drainage
Methods / Devices
| Device | Location | Gold Standard? | Advantages | Disadvantages |
|---|---|---|---|---|
| External Ventricular Drain (EVD) / Ventriculostomy | Lateral ventricle | Yes | Precise, allows CSF drainage to lower ICP, allows re-zeroing | Risk of infection, hemorrhage, technically difficult in compressed/shifted ventricles |
| Intraparenchymal monitor (e.g., Camino, Codman) | Brain parenchyma | No | Easy to place, low infection risk, accurate | Cannot drain CSF, cannot re-zero in situ, costly |
| Subdural catheter/bolt | Subdural space | No | Less invasive | Less accurate, prone to damping |
| Epidural monitor | Epidural space | No | Least invasive, lowest hemorrhage risk | Least accurate; does not reflect true ICP |
ICP Waveforms
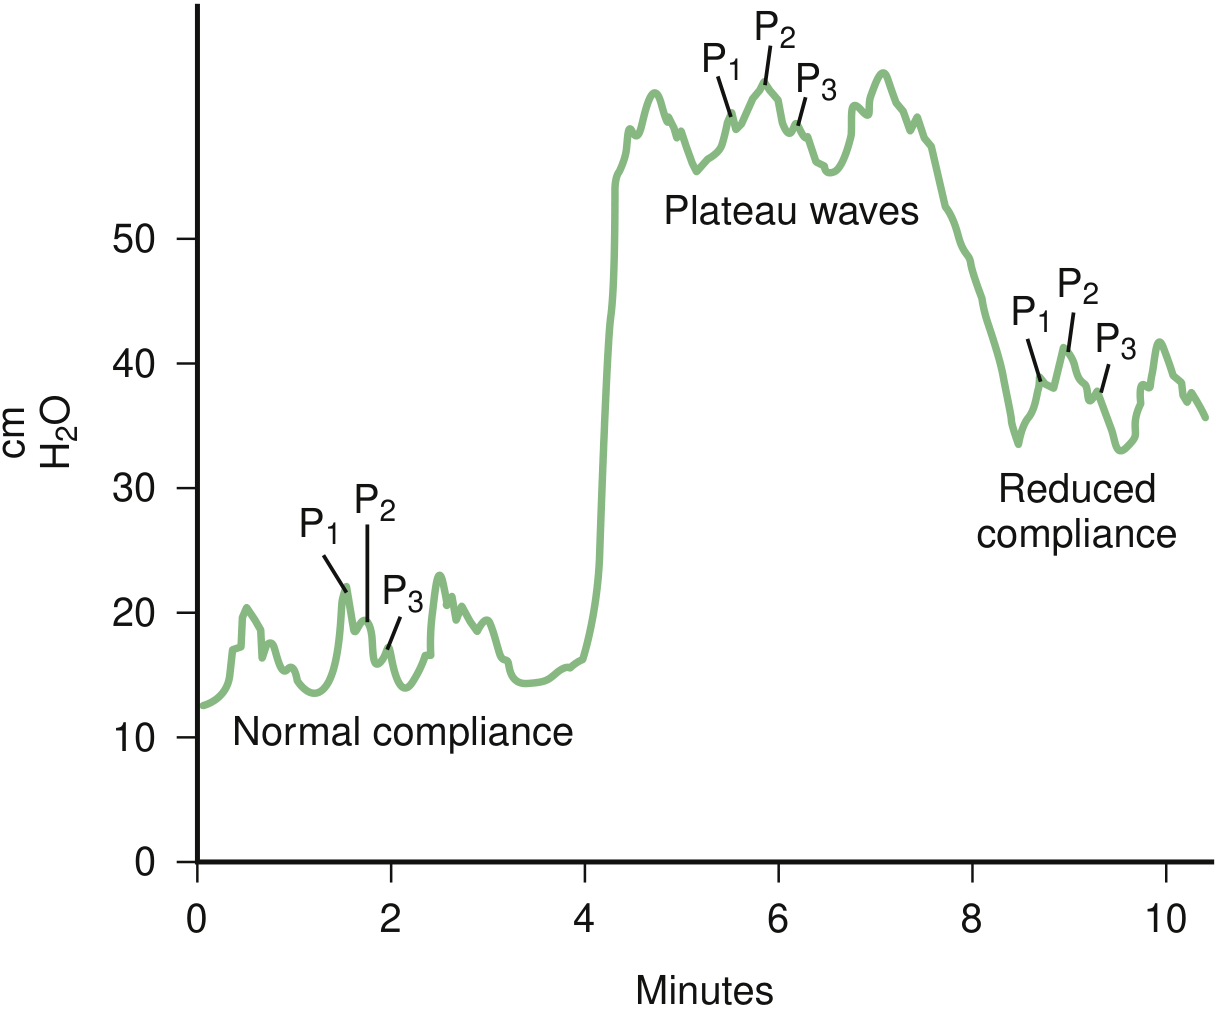
- P1 (Percussion wave) - arterial pulsation transmitted to CSF; normally the tallest peak
- P2 (Tidal wave) - reflects brain compliance; normally smaller than P1
- P3 (Dicrotic wave) - corresponds to the dicrotic notch of the arterial waveform; smallest
- A waves (Plateau waves): Sustained rises to 50-100 mmHg lasting 5-20 minutes - indicate critically reduced compliance and are ominous
- B waves: Oscillations of 20-50 mmHg at 0.5-2/min - associated with disturbed respiration and raised ICP but less immediately dangerous
- C waves: Small rhythmic waves at ~6/min - of less clinical significance
Management of Raised ICP (Three-Tiered Approach)
Tier 1 (First Line)
- Head of bed elevated to 30 degrees, head in neutral position (facilitates venous drainage)
- Short-acting sedation/analgesia (propofol, fentanyl) to reduce agitation and ICP spikes
- CSF drainage via EVD (intermittent or continuous)
- Normothermia, normoglycemia, normoxia
- Avoid jugular compression from cervical collars
Tier 2
- Hyperosmolar therapy:
- Mannitol 0.25-1 g/kg IV (monitor serum osmolality; hold if >320 mOsm/L)
- Hypertonic saline (3% NaCl) - monitor sodium; hold if Na > 160 mEq/L
- Neuromuscular blockade - test dose, followed by continuous infusion if effective
- Hyperventilation to PaCO2 30-35 mmHg - only as a temporizing measure (causes cerebral vasoconstriction; risk of ischemia)
- Cerebral autoregulation assessment
Tier 3 (Refractory ICP)
- Decompressive craniectomy - reduces mortality but may increase number of survivors in a vegetative or severely disabled state (DECRA trial, RESCUEicp trial)
- Barbiturate coma (pentobarbital/thiopental) - reduces cerebral metabolic demand; requires EEG monitoring
- Hypothermia - controversial; limited evidence for outcome benefit
Complications of ICP Monitoring
- Hemorrhage: Intraparenchymal hematoma at probe tip (see CT complication image below)
- Infection / Ventriculitis: More common with EVD; risk increases with duration > 5 days
- Catheter obstruction / malposition
- CSF over-drainage causing intracranial hypotension and slit ventricles (VP shunt complication)
- Mechanical failure / signal drift (intraparenchymal monitors cannot be re-zeroed)
Additional Neuromonitoring Adjuncts
- Jugular Bulb Oximetry (SjvO2): Measures venous O2 saturation draining the brain (normal 50-65%); SjvO2 < 50% for >15 min = cerebral ischemia; helps guide CPP optimization
- Brain tissue oxygenation (PbtO2): Direct parenchymal O2 tension; multiple RCTs ongoing (e.g., BOOST-3) to evaluate added benefit
- Transcranial Doppler (TCD): Non-invasive estimation of CPP and cerebrovascular reactivity
Key Numbers to Remember
| Parameter | Value |
|---|---|
| Normal ICP | < 15 mmHg |
| ICP treatment threshold (BTF 2016) | > 22 mmHg |
| Target CPP | 60-70 mmHg |
| Plateau wave amplitude | 50-100 mmHg |
| SjvO2 ischemic threshold | < 50% for > 15 min |
| Mannitol osmolality limit | 320 mOsm/L |
| Hypertonic saline Na limit | 160 mEq/L |