
You are a medical educator. Provide a clear, evidence-based overview of COPD treatment for a lay audience with no medical background. Include: 1) A concise explanation of what COPD is and its typical progression. 2) Core treatment goals (symptom relief, reduce exacerbations, improve quality of life, slow progression). 3) First-line pharmacologic therapies (short-acting and long-acting bronchodilators, inhaled corticosteroids when indicated) with basic usage guidance and common side effects. 4) Non-pharmacologic treatments (smoking cessation, vaccination, pulmonary rehabilitation, exercise, nutrition, oxygen therapy criteria if applicable). 5) A simple stepwise approach to typical management based on symptom burden and exacerbation history. 6) Practical safety tips and red flags that require medical attention. 7) A list of questions to discuss with a healthcare provider to personalize treatment. Keep language plain, define key terms, and avoid medical jargon where possible. Include a brief glossary at the end.
"COPD" AND "treatment" AND "guidelines"
COPD treatment guidelines 2025 GOLD stepwise management lay audience
https://www.ajmc.com/view/updated-gold-guidelines-and-novel-…
Understanding COPD: A Plain-Language Guide to Treatment
1. What Is COPD, and How Does It Progress?
-
Emphysema - The tiny air sacs (called alveoli) at the ends of the airways are destroyed. Think of a bunch of grapes turning into deflated balloons. The lungs lose their springiness, so air gets trapped inside. People with emphysema often feel constantly short of breath and have a "barrel-shaped" chest from overinflated lungs.
-
Chronic Bronchitis - The airways produce too much mucus and become inflamed. This causes a persistent cough with phlegm on most days for at least 3 months a year, for 2 or more years in a row.
- Early stage - Mild breathlessness during activity, an occasional morning cough. Many people dismiss this as "just getting older."
- Moderate stage - Breathlessness on most days, regular cough and mucus, reduced exercise tolerance.
- Severe stage - Breathlessness at rest or with minimal activity, frequent flare-ups (called exacerbations), possible need for oxygen therapy.
- Very severe stage - Significantly reduced quality of life, possible heart complications (the right side of the heart can be strained when the lungs work poorly).
2. Core Treatment Goals
| Goal | What It Means in Practice |
|---|---|
| Relieve symptoms | Reduce breathlessness, coughing, and mucus so daily life is more comfortable |
| Reduce flare-ups | Fewer emergency visits and hospital stays |
| Improve quality of life | Being able to walk, socialise, and do activities you enjoy |
| Slow progression | Preserve as much lung function as possible for as long as possible |
3. Medication Treatments (Pharmacologic Therapy)
Short-Acting Bronchodilators - "Rescue Inhalers"
-
Short-acting beta-agonists (SABAs) - e.g., albuterol (also called salbutamol). These work by signalling the airway muscles to relax. Used when you feel suddenly short of breath or before an activity that makes you breathless.
-
Short-acting anticholinergics (SAMAs) - e.g., ipratropium. These block signals that cause airway narrowing. They work especially well for COPD and are sometimes combined with a SABA in a single inhaler for extra relief.
Long-Acting Bronchodilators - "Maintenance Inhalers"
-
Long-acting beta-agonists (LABAs) - e.g., salmeterol, formoterol, indacaterol. Taken once or twice daily. They keep airways open throughout the day and night.
-
Long-acting anticholinergics / muscarinic antagonists (LAMAs) - e.g., tiotropium, umeclidinium, glycopyrrolate. Also once-daily in most cases. LAMAs tend to be particularly effective for COPD and are often the first choice.
Inhaled Corticosteroids (ICS) - "Anti-Inflammation Inhalers"
- You have had two or more serious flare-ups per year despite being on a long-acting bronchodilator.
- A blood test shows a high level of a type of immune cell called eosinophils (above 300 cells per microlitre is a key threshold), which suggests your airways are inflamed in a way that responds to steroids.
- You may have features of both asthma and COPD.
Triple Therapy (LABA + LAMA + ICS)
A Note on Inhaler Technique
4. Non-Medication Treatments (Non-Pharmacologic Therapy)
Smoking Cessation - The Single Most Important Step
- Help available: Nicotine replacement therapy (patches, gum, lozenges), prescription medications (varenicline / bupropion), and behavioural counselling all increase quit rates significantly. Ask your doctor - do not try to go it alone.
- Passive smoke and air pollution should also be avoided as much as possible.
Vaccinations
- Flu (influenza) vaccine - every year. Reduces hospitalisation and death significantly.
- Pneumococcal vaccine - protects against the most common cause of bacterial pneumonia.
- RSV (Respiratory Syncytial Virus) vaccine - newly recommended; RSV causes roughly 8% of COPD flare-ups and can lead to serious illness.
- COVID-19 vaccines - per current guidelines.
- Tdap (tetanus, diphtheria, pertussis) if not vaccinated as an adolescent.
- Shingles (herpes zoster) vaccine - for eligible adults.
Pulmonary Rehabilitation
- Supervised exercise training (walking, cycling, strength exercises) tailored to your fitness level.
- Breathing techniques to reduce breathlessness.
- Education about your condition, medications, and when to seek help.
- Nutritional and psychological support.
Exercise and Physical Activity
Nutrition
- Eat small, frequent meals rather than large ones (a very full stomach pushes up against the diaphragm and makes breathing harder).
- Stay well hydrated - fluids help thin mucus and make it easier to cough up.
- If you are overweight, gentle weight loss can reduce the effort of breathing.
- A referral to a dietitian can be helpful in more severe cases.
Long-Term Oxygen Therapy
- Resting blood oxygen (measured by a finger clip device called a pulse oximeter) falls to 88% or below (or a blood test shows a PaO2 at or below 55 mmHg).
- Or blood oxygen is between 88-90% AND there is evidence of strain on the heart or severe breathlessness.
5. A Simple Step-by-Step Approach to Management
| Group | Who Fits Here | Starting Treatment |
|---|---|---|
| Group A | Few symptoms, 0-1 mild flare-ups per year | A single bronchodilator (LAMA or LABA) used daily |
| Group B | More bothersome symptoms, 0-1 mild flare-up per year | Two bronchodilators together (LAMA + LABA) in one inhaler |
| Group E | 2 or more flare-ups per year, OR 1 flare-up requiring hospitalisation | LAMA + LABA (add ICS if eosinophils are high) |
- Check and correct inhaler technique first.
- Optimise non-medication treatments (quit smoking, start pulmonary rehab, get vaccinated).
- If on a single bronchodilator, add a second (LAMA + LABA dual therapy).
- If still having flare-ups with high eosinophils, add an ICS (triple therapy).
- If triple therapy is still not enough, a specialist may consider newer options like roflumilast (a different kind of anti-inflammatory tablet), azithromycin (a long-term low-dose antibiotic for certain patients who are non-smokers), or the newer inhaled medicine ensifentrine.
6. Safety Tips and Red Flags: When to Seek Medical Attention
Practical Safety Tips
- Never run out of your inhalers. Keep a spare, and always refill before the current one is empty.
- Rinse your mouth after every use of an ICS inhaler to prevent mouth infections.
- Avoid sick people during cold and flu season. Wash hands frequently.
- Know your baseline - understand what your "normal" breathing feels like so you can recognise changes early.
- Do not use supplemental oxygen without a prescription - it can be harmful in some COPD patients.
- Avoid open fires, strong chemical fumes, and indoor air pollution (gas stoves, wood smoke).
- Travel planning: If flying, speak to your doctor - cabin air pressure is lower than at sea level, and some patients need portable oxygen on board.
Red Flags - Seek Medical Attention Promptly
- Breathlessness that is worse than usual and not relieved by your rescue inhaler
- Breathlessness at rest or with minimal movement like talking
- Coughing up blood
- Increased mucus that has become thicker, darker (yellow or green), or has an unpleasant smell
- Confusion, drowsiness, or difficulty staying awake - this can signal dangerously high carbon dioxide in the blood
- Blue or grey colour on lips or fingernails (called cyanosis) - indicates very low oxygen
- Chest pain or racing heart
- High fever (above 38.5°C / 101.3°F) with worsening breathing
- Swollen ankles or legs - can signal the heart is under strain
7. Questions to Discuss With Your Healthcare Provider
- Diagnosis: "Do I have emphysema, chronic bronchitis, or both? How severe is my COPD on a scale?"
- Lung function: "What are my spirometry results and what do they mean for my daily life?"
- Smoking: "What support is available to help me quit smoking?" (even if you have tried before)
- Inhalers: "Can you watch me use my inhaler and tell me if I am doing it correctly?"
- ICS suitability: "Have you checked my blood eosinophil count to see if steroids would help me?"
- Pulmonary rehabilitation: "Am I a candidate for pulmonary rehabilitation, and can you refer me?"
- Oxygen: "Should my blood oxygen levels be checked, and do I need home oxygen?"
- Vaccinations: "Am I up to date on all recommended vaccines, including RSV and pneumococcal?"
- Flare-ups: "Do I have a written action plan for what to do when my symptoms worsen?"
- Warning signs: "What specific changes in my symptoms should make me call you versus go to an emergency department?"
- Other conditions: "Could any of my other health conditions or medications be making my breathing worse?"
- Nutrition and exercise: "Should I see a dietitian or physiotherapist to help with my exercise plan?"
Glossary of Key Terms
| Term | Plain-Language Definition |
|---|---|
| Alveoli | Tiny air sacs at the ends of your airways where oxygen passes into the blood |
| Bronchodilator | A medicine that widens the airways to make breathing easier |
| Chronic | Long-term, ongoing - the condition does not go away |
| Cor pulmonale | Right-sided heart failure caused by high blood pressure in the lungs from long-term low oxygen |
| Cyanosis | A bluish or greyish colour to the lips or fingernails, indicating low blood oxygen |
| Dyspnea | The medical word for breathlessness or difficulty breathing |
| Eosinophils | A type of white blood cell; higher counts suggest airway inflammation that may respond to corticosteroids |
| Emphysema | A type of COPD where air sacs are destroyed, causing air trapping and reduced lung elasticity |
| Exacerbation | A flare-up - a period when COPD symptoms suddenly become worse than usual |
| FEV1 | Forced Expiratory Volume in 1 second - the amount of air you can blow out in 1 second; a key measure of airflow in COPD |
| FVC | Forced Vital Capacity - the total amount of air you can blow out in one breath |
| GOLD | Global Initiative for Chronic Obstructive Lung Disease - the international body that publishes treatment guidelines for COPD |
| Hypoxia / Hypoxaemia | Low oxygen level in the blood |
| ICS | Inhaled Corticosteroid - an anti-inflammatory medicine delivered by inhaler |
| LABA | Long-Acting Beta-Agonist - a type of long-acting bronchodilator that works through beta receptors |
| LAMA | Long-Acting Muscarinic Antagonist (also called a long-acting anticholinergic) - a type of long-acting bronchodilator |
| Obstructive | In lung disease, this means airflow is blocked or slowed when breathing out |
| Pulmonary rehabilitation | A supervised programme of exercise and education for people with lung conditions |
| SABA | Short-Acting Beta-Agonist - a quick-relief ("rescue") bronchodilator |
| SAMA | Short-Acting Muscarinic Antagonist - a quick-relief anticholinergic bronchodilator |
| Spirometry | A breathing test that measures how much and how fast you can exhale; used to diagnose and monitor COPD |
| Triple therapy | Using three inhaled medicines together: a LABA + LAMA + ICS |
Abdominal Aortic Aneurysm EXPLAIN
abdominal aortic aneurysm diagram anatomy CT scan
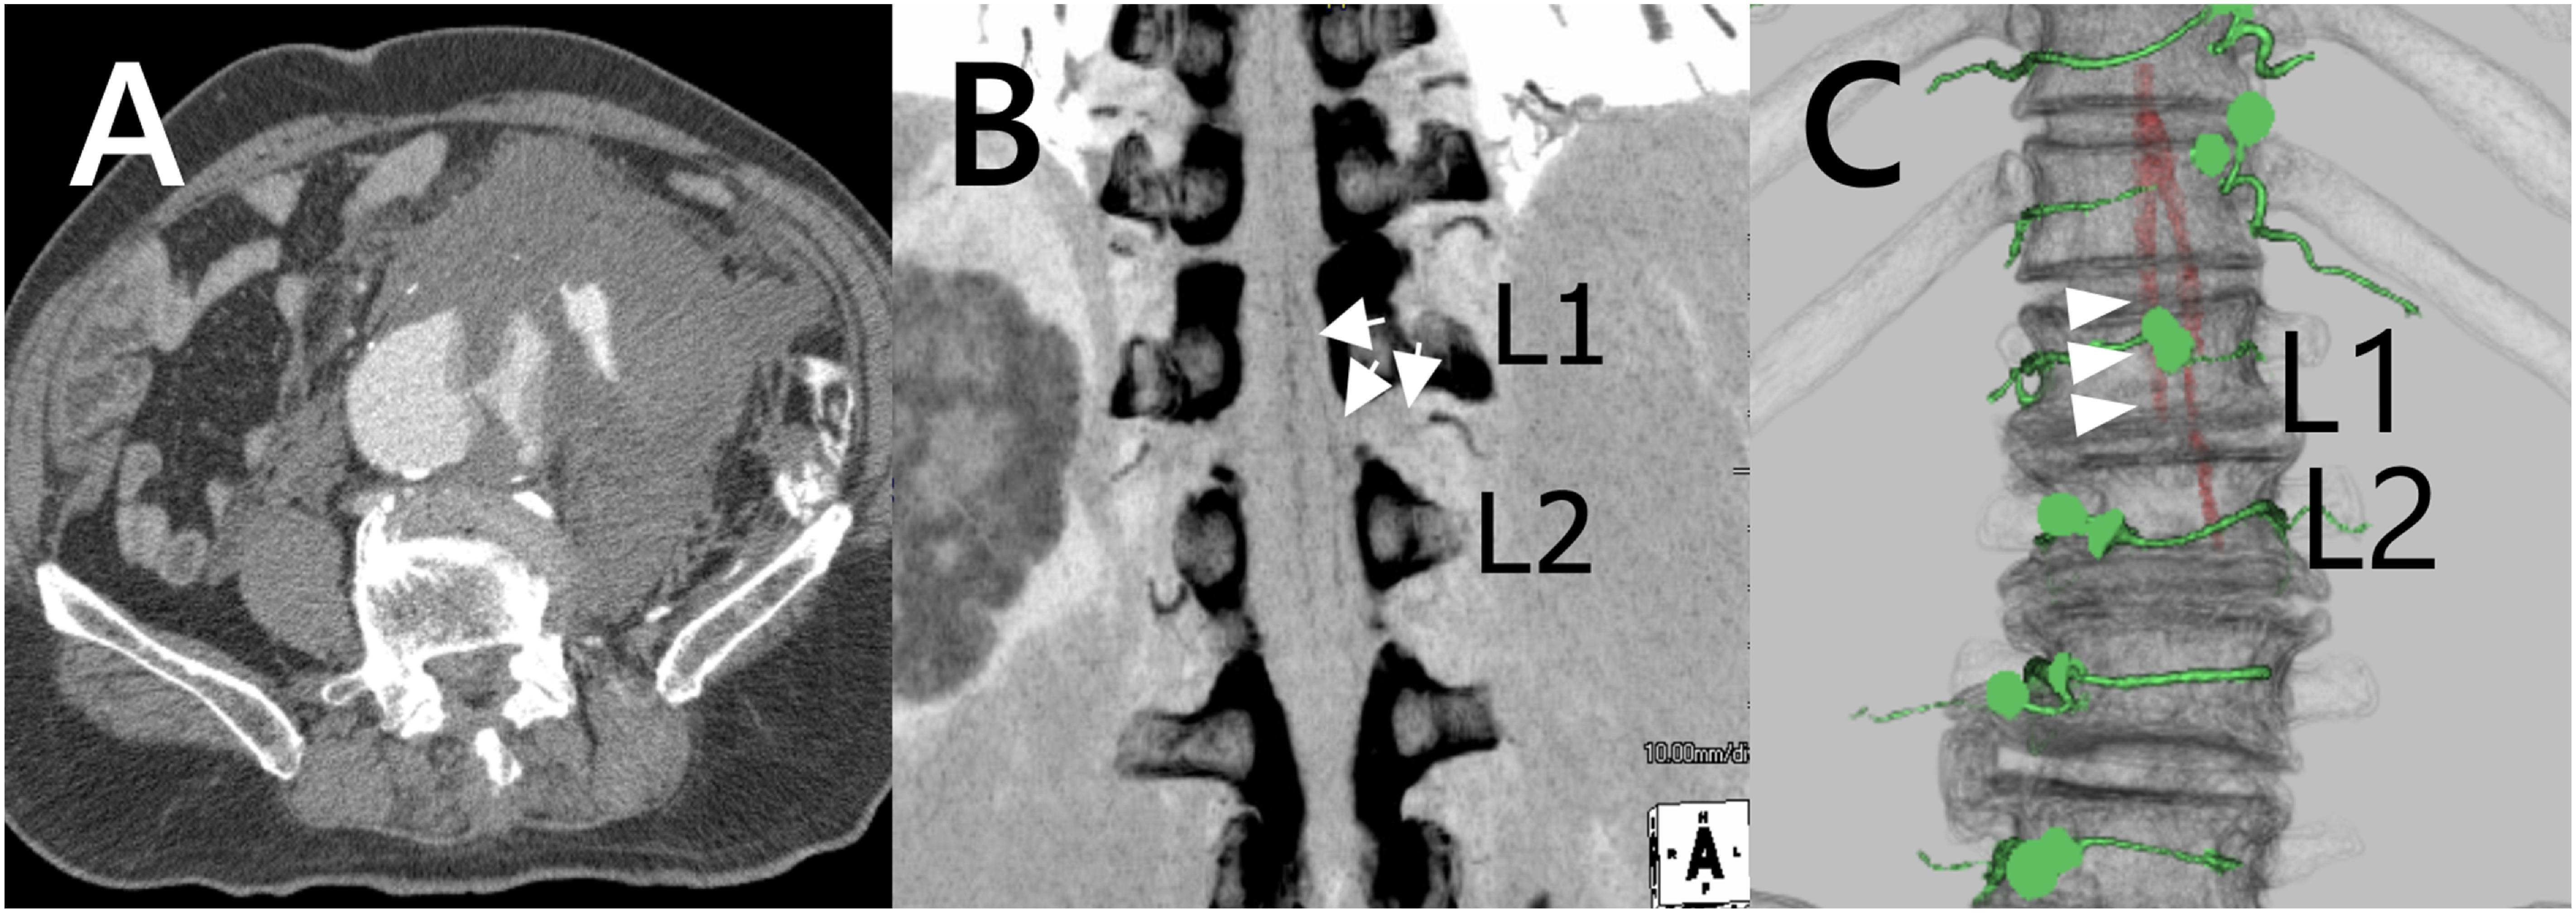
This composite of three diagnostic images illustrates a case of abdominal aortic aneurysm (AAA) and its vascular anatomy. Panel A is an axial contrast-enhanced computed tomography (CT) scan of the abdomen showing a large infrarenal abdominal aortic aneurysm with associated rupture, evidenced by a massive, high-attenuation retroperitoneal hematoma extending into the left flank. Panel B displays a coronal Maximum Intensity Projection (MIP) CT image focused on the spine, where white arrows identify the Artery of Adamkiewicz originating at the L1-L2 vertebral level. Panel C shows a three-dimensional (3D) CT reconstruction of the lumbar spine and vasculature, with the Adamkiewicz artery highlighted in green (marked by white arrowheads) and the aorta in red, providing a spatial representation of the vessel's origin and course relative to the bony anatomy. These images are clinically significant for preoperative planning in endovascular aneurysm repair (EVAR) to avoid spinal cord ischemia by identifying critical spinal blood supply.
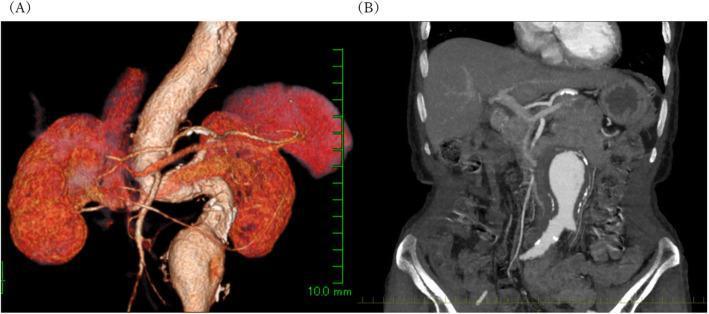
This diagnostic image provides a preoperative evaluation of an abdominal aortic aneurysm (AAA) using Computed Tomography (CT). Panel A shows a 3D volume-rendered CT reconstruction highlighting the vascular anatomy in a color-enhanced format. It clearly depicts the abdominal aorta, bilateral renal arteries, and both kidneys, with a focal aneurysmal dilation measuring approximately 47 mm located infrarenally. Panel B is a coronal CT scan with contrast enhancement, demonstrating the cross-sectional morphology of the infrarenal aortic aneurysm. This view reveals a significant intramural thrombus (mural thrombus) represented by a thick, low-attenuation layer along the vessel wall, which contributes to the narrowing of the true lumen and near-occlusion of the lumbar arteries. The relationship between the aneurysm and the renal artery origins is essential for surgical planning, such as endovascular aneurysm repair (EVAR). This imagery serves to teach vascular pathology, specifically the diagnostic features of AAA and the associated risk of spinal cord ischemia due to lumbar artery occlusion.
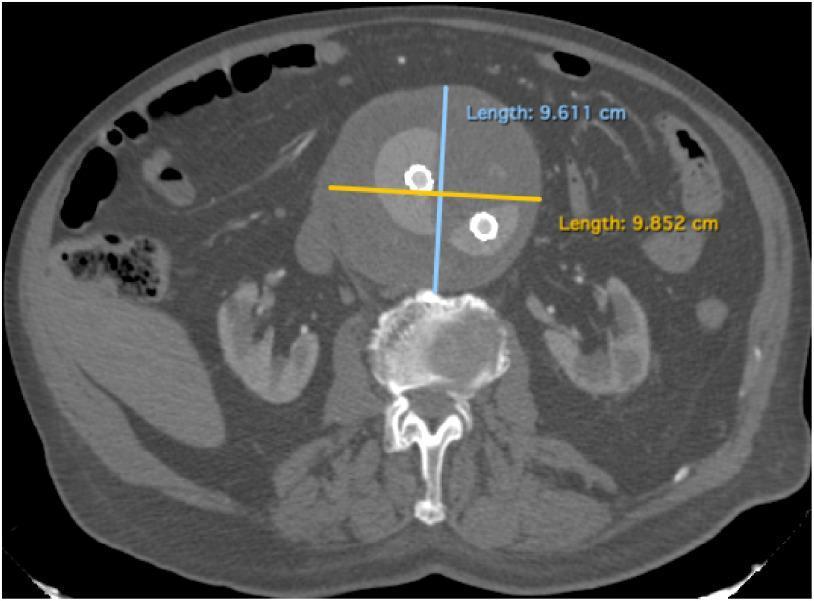
This axial computed tomography (CT) scan of the abdomen demonstrates a voluminous infrarenal abdominal aortic aneurysm (AAA). The image highlights a large, circular aneurysmal sac located anterior to the lumbar vertebral body. The sac is annotated with two perpendicular measurement calipers, indicating a transverse diameter of 9.852 cm and an anteroposterior diameter of 9.611 cm. Within the lumen of the aneurysm, two hyperdense circular foci are visible, consistent with endovascular aneurysm sealing (EVAS) devices or stent-graft components surrounded by endobags. The surrounding anatomy includes the vertebral column posteriorly, and the bilateral kidneys situated laterally to the aneurysm. The scan provides clinical evidence of aneurysm expansion during post-operative follow-up, suggesting potential complications such as a type Ia endoleak. This image serves as a diagnostic tool for monitoring stent-graft stability and sac morphology in patients treated for complex vascular pathologies.
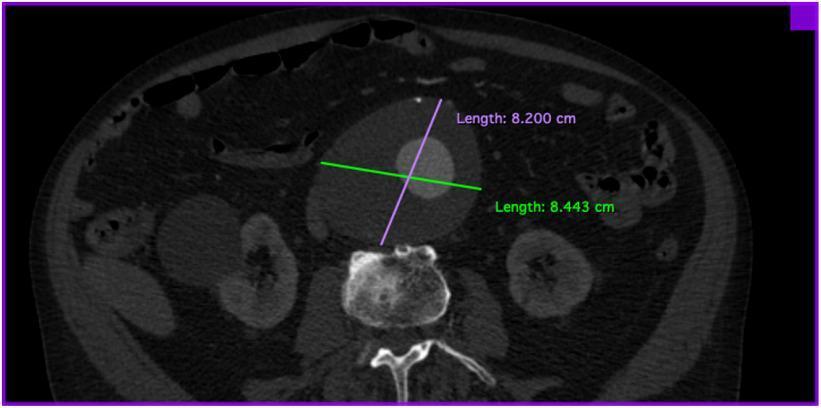
This diagnostic image is a preoperative axial computed tomography (CT) scan of the abdomen demonstrating a large infrarenal abdominal aortic aneurysm (AAA). The aneurysm is visualized as a significantly dilated vascular structure located anterior to the lumbar vertebral body. Digital calipers measure the transverse diameter of the aneurysm at approximately 8.2 cm by 8.44 cm. The scan reveals a contrast-enhanced patent lumen surrounded by a substantial layer of non-enhancing mural thrombus, which contributes to the overall vessel expansion. The surrounding abdominal anatomy shows the aneurysm's mass effect on adjacent soft tissues, with the kidneys visible bilaterally in their retroperitoneal positions. This image illustrates a high-risk vascular condition requiring surgical intervention, such as endovascular aneurysm repair (EVAR), and serves as a classic representation of advanced aortic pathology for medical training in vascular surgery and radiology.
"abdominal aortic aneurysm"[MeSH Terms] AND "management"
Abdominal Aortic Aneurysm (AAA) - A Complete Explanation
What Is an Abdominal Aortic Aneurysm?
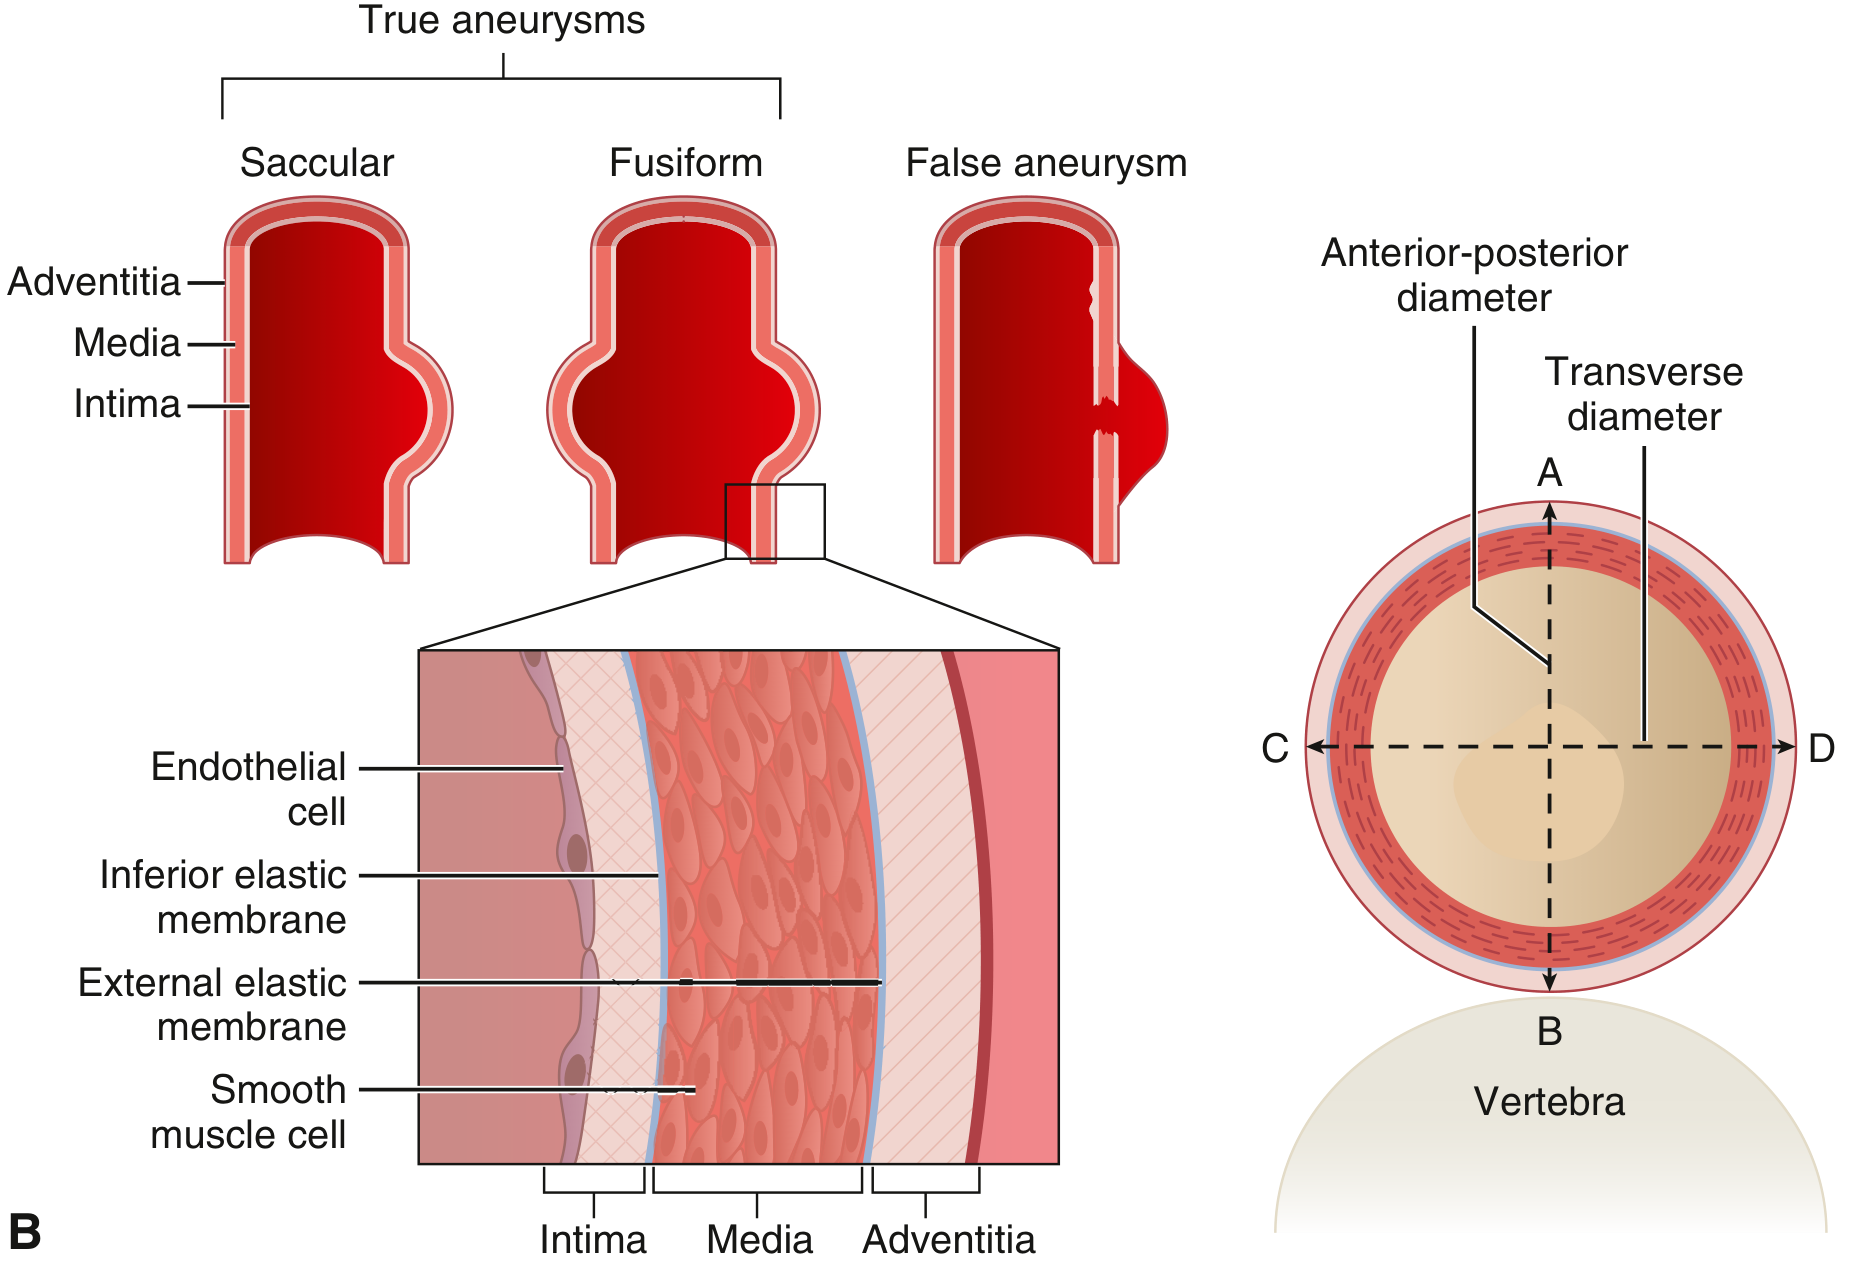
Shapes of Aneurysms
| Type | Description |
|---|---|
| Fusiform | Symmetric, spindle-shaped widening all the way around the vessel - most common in AAA |
| Saccular | Asymmetric balloon-like outpouching on one side of the vessel only |
| False aneurysm (pseudoaneurysm) | Not a true wall bulge - blood leaks through the wall and is contained only by surrounding tissue |
Who Gets AAA? Risk Factors
- Age - extremely uncommon before age 60; prevalence rises to ~6% in men aged 55-64 and ~18.5% in men aged 75-84
- Male sex - men are 4-5x more likely to develop AAA; when women do develop it, ~75% are small (3.0-3.9 cm)
- Family history - having a first-degree relative (parent, sibling) with AAA raises your own risk 3 to 5-fold; genome-wide studies have identified multiple genetic loci involved
- Race - more common in white populations
- Cigarette smoking - the single strongest modifiable risk factor, increasing AAA risk by 2.7-fold overall and by 5.6-fold for large aneurysms; current smokers carry 2.5x higher risk than former smokers
- Hypertension (high blood pressure) - moderately increases risk and strongly predicts rupture
- High cholesterol / atherosclerosis - 95% of AAAs show associated atherosclerotic degeneration of the aortic wall
- COPD - an independent risk factor for rupture
How Does It Develop? (Pathophysiology)
-
Matrix metalloproteinase (MMP) dysregulation - Enzymes that normally remodel the wall (MMPs 1, 3, 9, 13) become overactive, chewing up the structural proteins elastin and collagen. The wall loses tensile strength.
-
Chronic inflammation - Inflammatory cells (macrophages, lymphocytes, neutrophils) flood the aortic wall and produce even more of these destructive enzymes.
-
Renin-angiotensin pathway activation - This blood pressure-regulating system drives further vascular wall stress.
-
Oxidative stress - Reactive oxygen species (chemically aggressive molecules) damage the wall further.
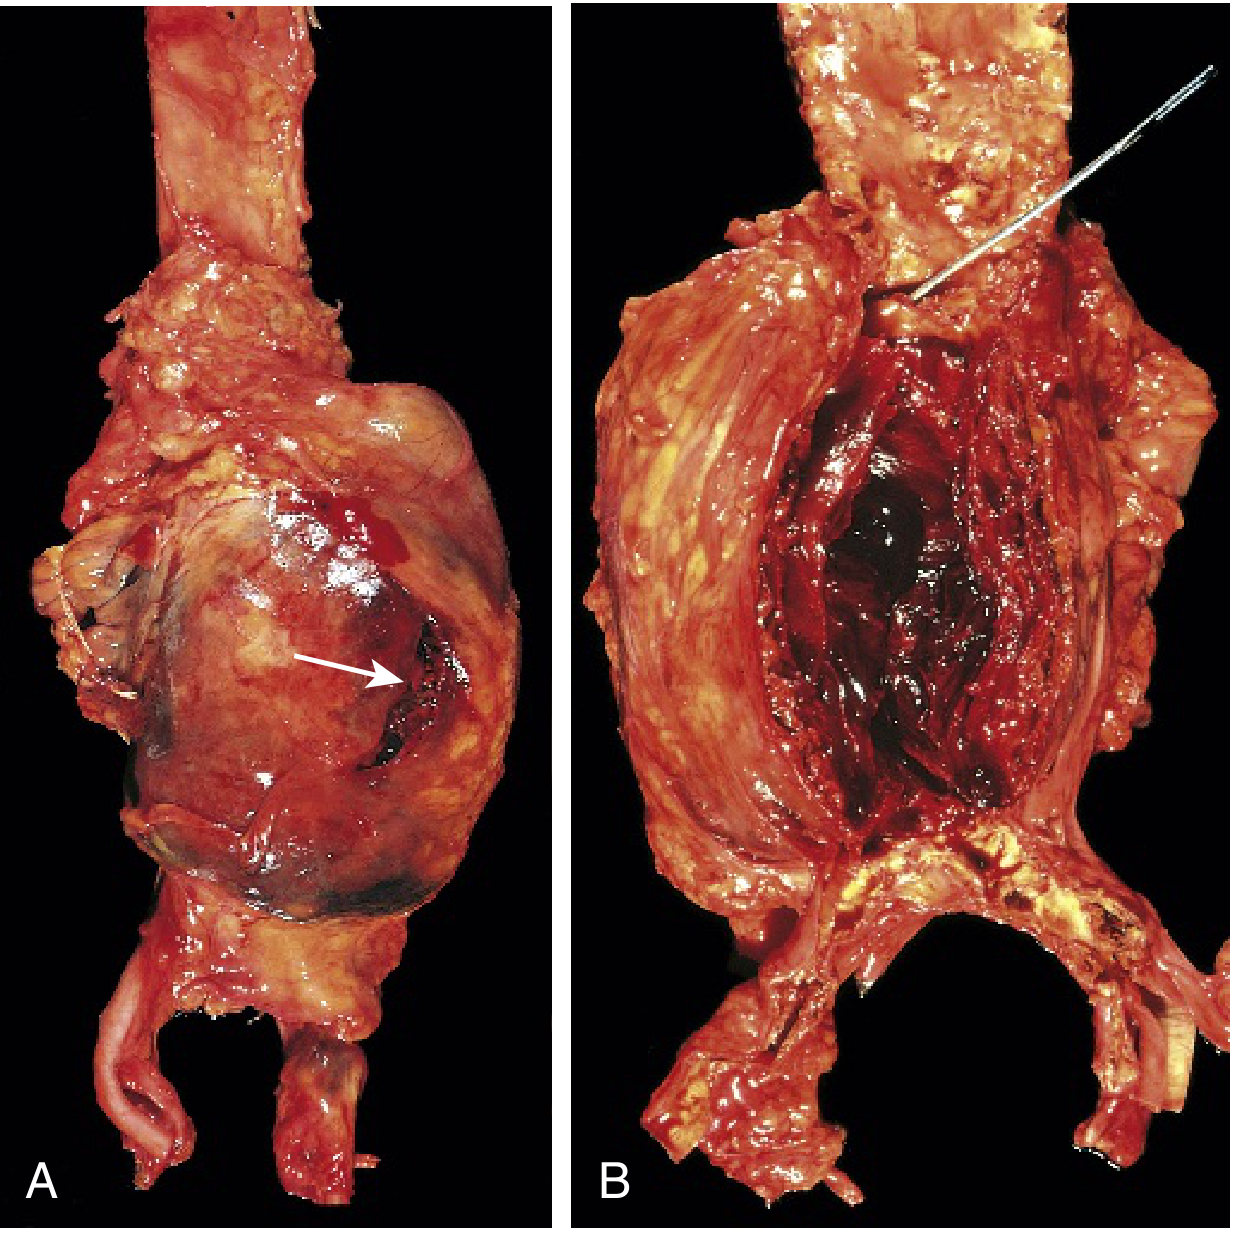
Subtypes of AAA
| Subtype | Features |
|---|---|
| Atherosclerotic AAA | Most common (~95%); extensive atheromatous plaques, thinned media; men >50 years who smoke |
| Inflammatory AAA | 5-10% of AAAs; dense periaortic fibrosis and inflammatory infiltrate; patients are typically younger |
| IgG4-related AAA | A subtype of inflammatory AAA; part of a systemic IgG4-related disease affecting multiple organs; responds to steroids and anti-B-cell therapy |
| Mycotic AAA | Caused by bacterial seeding (e.g. from infective endocarditis); rapidly expands and ruptures; high mortality |
Symptoms - "The Silent Killer"
- Persistent dull pain in the epigastrium (upper abdomen), back, or flanks - often misidentified as musculoskeletal back pain
- Pulsatile abdominal mass - a visible or palpable throbbing lump slightly above the navel; this is more detectable in thin patients
- Abdominal bruit (an abnormal whooshing sound with a stethoscope)
- Limb ischemia (blocked blood flow to legs) from embolism of clot fragments
- Kidney failure if renal arteries are involved
- Gastrointestinal bleeding from an aortoenteric fistula (the aneurysm erodes into the bowel - usually the duodenum) - often presents first as a "herald bleed" (small initial bleed) followed hours to days later by massive haemorrhage
The Most Feared Complication: Rupture
| Aneurysm Diameter | Annual Risk of Rupture |
|---|---|
| 3.0 - 3.9 cm | ~0% |
| 4.0 - 4.9 cm | ~1% |
| 5.0 - 5.9 cm | ~11% |
| 5.5 - 6.0 cm | ~5-10% |
| ≥ 7.0 cm | ~25% or more |
- Sudden, severe, tearing or ripping pain in the abdomen, back, or flanks
- Low blood pressure / shock (pale, sweating, rapid heart rate, collapse)
- Palpable pulsatile abdominal mass
Diagnosis
- Sensitivity 95-100%, specificity 100%, cheap, no radiation, no contrast dye
- Preferred for initial detection and for serial monitoring of known small aneurysms
- Limitation: cannot accurately plan surgery
- Provides precise measurements, maps the relationship to renal arteries, identifies mural thrombus, and detects rupture
- Required urgently when rupture is suspected
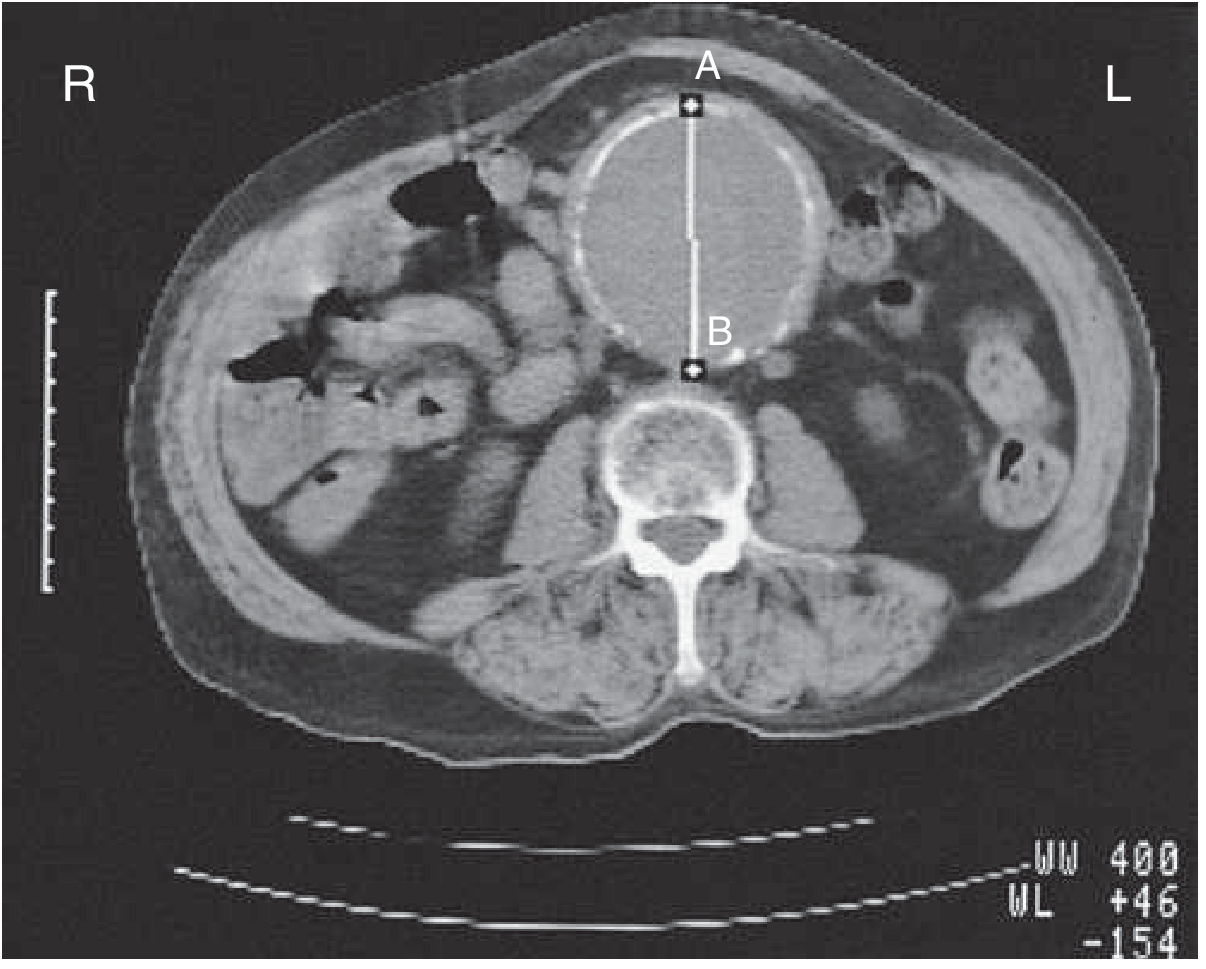
Screening Recommendations
- Men aged 65-75 years who have ever smoked - one-time abdominal ultrasound. This detects AAA in about 5.5% of examinations and reduces aneurysm-related mortality by 45%.
- Some guidelines also recommend screening for women aged 65-75 who have smoked or have a first-degree relative with AAA.
- Patients with known first-degree relative with AAA - discuss screening with your doctor even earlier.
Management
1. Surveillance (Watchful Waiting) for Small Aneurysms
| Size | Surveillance Interval |
|---|---|
| 3.0 - 4.4 cm | Ultrasound every 12 months |
| 4.5 - 5.4 cm | Ultrasound every 3-6 months |
| ≥ 5.5 cm (or symptomatic) | Refer for repair |
- Quit smoking - most important modifiable factor
- Control blood pressure aggressively
- Statins (cholesterol-lowering drugs) - reduce cardiovascular events and may slow aneurysm growth
- Avoid vigorous exertion that dramatically raises blood pressure (e.g. heavy lifting)
2. Surgical Repair - When and How
- AAA ≥ 5.5 cm in diameter in an otherwise fit patient
- Any symptomatic AAA (pain, tenderness) - these are at imminent risk regardless of size
- Rapidly growing AAA (>1 cm growth in 12 months) - even if below threshold
- Ruptured AAA - emergency surgery immediately
- A large cut is made in the abdomen; the aneurysm is opened; a synthetic tube graft is sewn in to replace the diseased segment
- Mortality 1-4% electively; 34-85% as emergency
- Durable - the graft lasts a lifetime; lower long-term re-intervention rate
- Preferred in younger, lower-risk surgical candidates
- A folded fabric-covered metal stent-graft is inserted via catheters through small groin incisions and deployed inside the aorta, lining it like a sleeve and excluding the aneurysm sac from blood flow
- Lower operative mortality, less blood loss, no general anaesthesia required, shorter hospital stay
- Higher long-term re-intervention rate (the graft can migrate, develop "endoleaks")
- Preferred in older, higher surgical risk patients
- Requires lifelong follow-up imaging (CT or ultrasound) to check for complications
- Open repair in patients at low-to-average surgical risk
- EVAR in those at high operative risk
CT Images of AAA
Complications of AAA (Beyond Rupture)
| Complication | Mechanism |
|---|---|
| Thromboembolism | Clot fragments from mural thrombus break off and block arteries in the legs, kidneys, or gut |
| Branch vessel occlusion | The expanding aneurysm can compress or kink renal, iliac, mesenteric arteries - causing kidney failure, leg ischaemia, bowel ischaemia |
| Aortoenteric fistula | Erosion into the duodenum → massive GI bleeding |
| Aortocaval fistula | Rare rupture into the inferior vena cava → loud abdominal bruit, heart failure, leg swelling |
| Vertebral erosion | Very large aneurysms can erode adjacent lumbar vertebrae |
| Ureteric obstruction | Compression of the ureter → kidney blockage and hydronephrosis |
Key Numbers to Remember
| Parameter | Value |
|---|---|
| Normal aortic diameter (infrarenal) | ~1.5 - 2.0 cm |
| Definition of AAA | ≥ 3.0 cm |
| Threshold for elective repair | ≥ 5.5 cm (asymptomatic) |
| Elective repair mortality | 1 - 4% |
| Emergency repair (ruptured) mortality | 34 - 85% |
| Rupture risk at ≥ 7 cm | ~25% per year |
| Average growth rate | ~0.35 cm / year |
| Screening: detect AAA rate | ~5.5% of screens |
| Screening mortality reduction | ~45% |
Quick Summary
An AAA is a dangerous dilation of the abdominal aorta, almost always below the kidneys, caused predominantly by atherosclerosis combined with genetic susceptibility, smoking, and ageing. It is usually silent until it ruptures - which carries catastrophic mortality. Screening ultrasound in at-risk older men is the key to catching it early. Small aneurysms are watched; those reaching 5.5 cm or causing symptoms are repaired - either by open surgery or the less invasive endovascular (EVAR) technique. Quitting smoking and controlling blood pressure are the most important steps patients can take to slow progression and reduce risk.
Hemorrhagic Shock Presents with: o Hypotension/Shock o Tachycardia o Multisystem organ failure (e.g. AKI or AMS , what is ams?
- Confusion - disorientation to person, place, or time
- Agitation or restlessness - often an early sign of poor brain perfusion
- Lethargy - abnormal drowsiness, sluggish responses
- Obtundation - reduced alertness, only responding to stimulation
- Stupor - very limited response to stimuli
- Coma - complete unresponsiveness
| Shock Class | Blood Loss | Mental Status |
|---|---|---|
| Class I | <750 mL | Normal |
| Class II | 750-1500 mL | Mild anxiety |
| Class III | 1500-2000 mL | Confusion, anxiety |
| Class IV | >2000 mL | Confusion → lethargy → coma |
Shock/hypotensive? Vasopressors and IVF are administered Goal: MAP > 65 mmHg , what is ivf?
Why IVF in Shock?
Common Types of IVF Used in Shock
| Fluid | Type | Key Use in Shock |
|---|---|---|
| Normal Saline (0.9% NaCl) | Crystalloid | Common first-line fluid |
| Lactated Ringer's (LR) | Crystalloid | Preferred in trauma/hemorrhagic shock - more physiologic |
| Packed Red Blood Cells (pRBCs) | Blood product | Best in hemorrhagic shock - replaces actual blood |
| Fresh Frozen Plasma (FFP) | Blood product | Replaces clotting factors lost with blood |
| Albumin | Colloid | Used in septic shock; stays in vessels longer |
In hemorrhagic shock specifically, blood products (pRBCs + FFP in a 1:1 ratio) are preferred over plain IVF because they replace what was actually lost - both the oxygen-carrying cells and the clotting factors.
The Goal: MAP > 65 mmHg
MAP = Diastolic BP + 1/3 (Systolic BP - Diastolic BP)
| MAP Level | Meaning |
|---|---|
| < 65 mmHg | Organs (kidneys, brain, heart) are underperfused - danger zone |
| ≥ 65 mmHg | Minimum pressure to keep vital organs alive |
| 65-70 mmHg | Target in most shock resuscitation protocols |
IVF + Vasopressors Together - Why Both?
| Treatment | How It Raises MAP | Analogy |
|---|---|---|
| IVF | Increases the volume of fluid in the blood vessels | Filling a deflated water balloon |
| Vasopressors (e.g. norepinephrine) | Squeeze/constrict blood vessels to increase resistance and pressure | Squeezing the balloon from outside |
MAP = Cardiac Output × Vascular Resistance
- IVF → ↑ Cardiac Output
- Vasopressors → ↑ Vascular Resistance
- Both together → ↑ MAP toward the ≥ 65 mmHg target
WHAT IS THE DIFFERENCE BETWEEN AAA RUPTURE AND AORTIC DISECTION?
aortic dissection vs AAA rupture diagram comparison
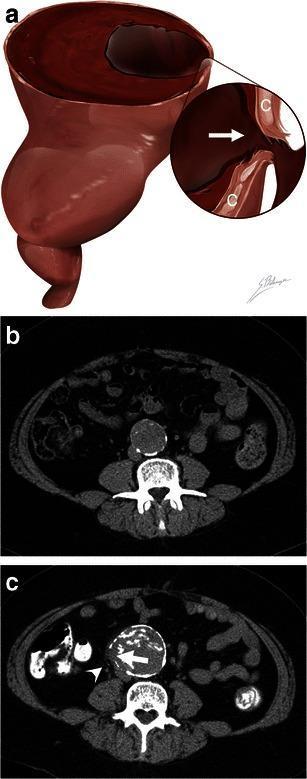
This educational composite focuses on the radiological markers of abdominal aortic aneurysm (AAA) rupture. Figure (a) is a pathophysiology diagram illustrating a focal discontinuity (arrow) in the calcified intima walls (C), which signifies a rupture site. Figures (b) and (c) provide a clinical comparison using axial unenhanced CT images of the same patient over a four-year interval. Image (b) shows the baseline state: an asymptomatic 4.2 cm AAA with intact, circumferential calcified walls appearing as a continuous hyperdense ring. Image (c) demonstrates progression to rupture, with the AAA enlarging to 5.7 cm. Key diagnostic signs of rupture are highlighted: a 1 cm focal gap or discontinuity in the calcification (white arrow) and associated periaortic fat infiltration/stranding (white arrowhead) indicating hemorrhage or inflammation into the surrounding retroperitoneal space. This comparison illustrates the importance of monitoring aneurysm diameter and wall integrity, specifically the 'focal wall discontinuity sign' in the context of acute lumbar pain.
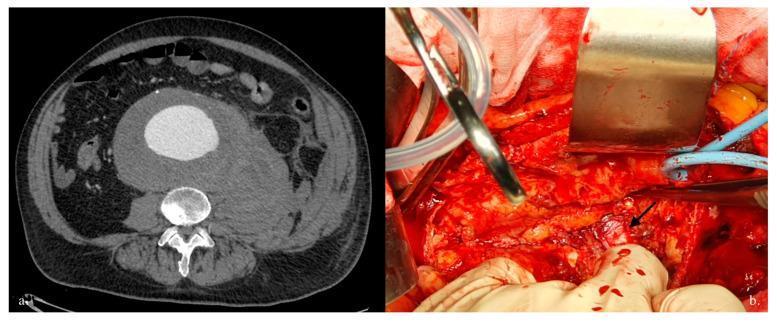
This dual-panel image provides a comparison between diagnostic imaging and intraoperative findings of a ruptured abdominal aortic aneurysm (RAAA). Panel (a) is an axial Computed Tomography Angiography (CTA) scan of the abdomen demonstrating a large abdominal aortic aneurysm (AAA) with a significant eccentric mural thrombus and a bright contrast-enhanced lumen. A large, ill-defined, hyperdense area is visible in the left retroperitoneum, characteristic of a postero-lateral rupture with an associated retroperitoneal hematoma. Panel (b) is a clinical photograph of the subsequent open surgical repair. The surgical field shows extensive dissection and hemorrhage consistent with acute rupture. A metallic retractor (Deaver or similar) provides exposure, and a black arrow indicates the exposed anterior surface of a lumbar vertebral body, a finding that occurs when the posterior wall of the aorta is breached and the hematoma dissects pre-vertebral tissues. Surgical instruments, suction tubing, and vessel loops are visible within the operative field, highlighting the complexity of emergency vascular reconstruction and hemorrhage control in RAAA cases.
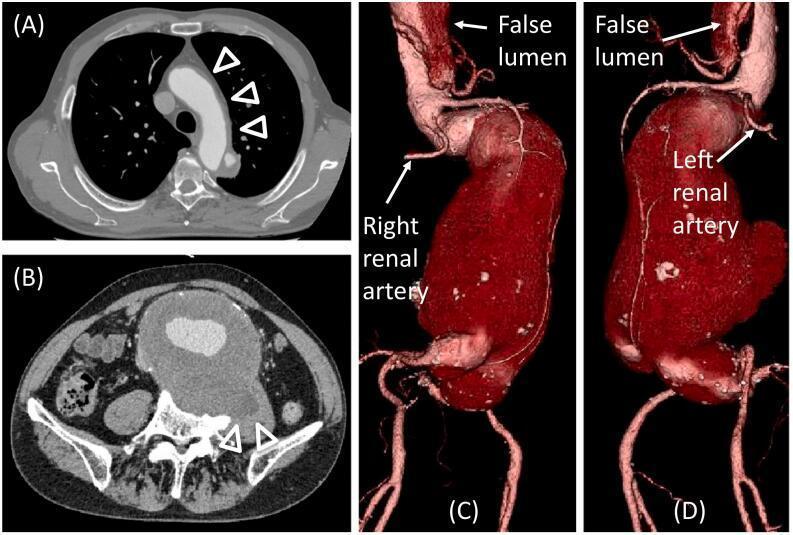
This composite of diagnostic images illustrates complex aortic pathology. (A) Axial contrast-enhanced CT of the chest shows an aortic dissection with a thrombosed false lumen (arrowheads) extending from the ascending aorta to the aortic arch. (B) Axial abdominal CT reveals a massive abdominal aortic aneurysm (AAA) with significant intramural thrombus. Evidence of chronic rupture is visible as erosion and remodeling of the adjacent lumbar vertebral body (arrowheads). (C and D) Volume-rendered CT angiography reconstructions provide a 3D anatomical overview from right and left anterior oblique perspectives. The images demonstrate the large infrarenal AAA extending to the common iliac arteries. Key vascular relationships are highlighted, including the patent false lumen near the origin of the right renal artery and the proximity of the left renal artery to the aneurysmal neck. These images represent typical findings in advanced aortic disease, focusing on Type A aortic dissection and juxtarenal AAA with chronic complications.
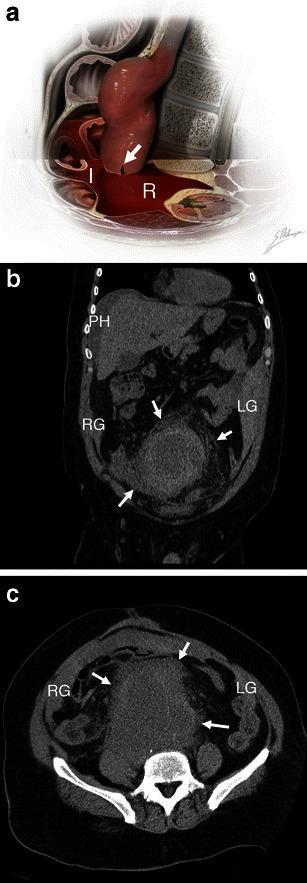
This educational image set illustrates the combined intraperitoneal and retroperitoneal hemorrhage resulting from an abdominal aortic aneurysm (AAA) rupture. Panel A is a pathophysiology diagram depicting a left anterolateral wall rupture (white arrow) of a large AAA, showing blood extending into both the retroperitoneal (R) and intraperitoneal (I) spaces. Panels B and C are unenhanced CT scans (coronal and axial views, respectively) of a 51-year-old male. The imaging demonstrates a high-attenuation (60 HU) acute intraperitoneal hematoma involving the perihepatic space (PH), right paracolic gutter (RG), and left paracolic gutter (LG). Concurrently, a large retroperitoneal hematoma is identified by white arrows surrounding the aneurysm and extending along the posterior abdominal wall. This content demonstrates key radiological signs of acute aortic rupture, specifically highlighting that anterior or anterolateral ruptures often lead to hemoperitoneum, complicating the typical retroperitoneal presentation of AAA emergencies.
aortic dissection true false lumen intimal tear diagram
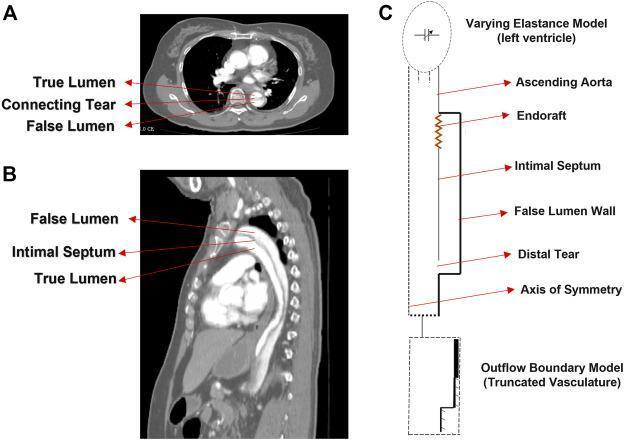
This composite educational resource illustrates Type B Aortic Dissection (TBAD) through diagnostic imaging and idealized modeling. Panel A is an axial contrast-enhanced CT scan of the thorax demonstrating a dissected descending aorta. It clearly identifies the True Lumen (TL), the typically larger False Lumen (FL), and the connecting intimal tear that allows communication between them. Panel B presents a sagittal CT reconstruction, showing the longitudinal extent of the dissection. The intimal septum is visible separating the anteriorly positioned true lumen from the posterior false lumen. Panel C is a corresponding schematic diagram used for hemodynamic modeling. It labels key anatomical and clinical features including the Varying Elastance Model (representing the left ventricle), the ascending aorta, an implanted endograft, the intimal septum, the false lumen wall, and the distal re-entry tear. The schematic outlines the axis of symmetry and the outflow boundary model for truncated vasculature. This content is designed to teach the spatial relationships of aortic dissection and the biomechanical parameters relevant to Thoracic Endovascular Aortic Repair (TEVAR).
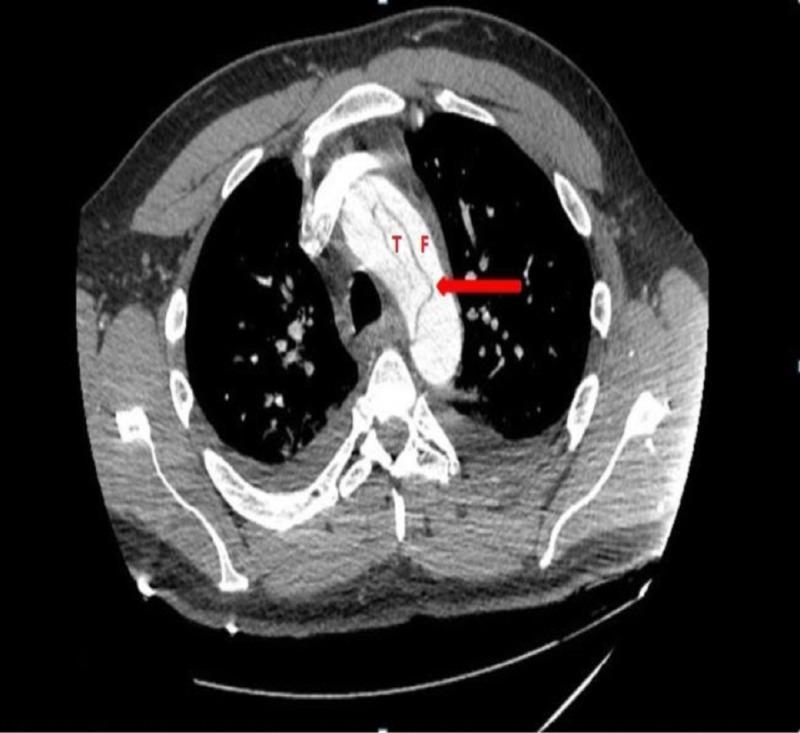
This diagnostic image is an axial contrast-enhanced computed tomography (CT) scan of the thorax at the level of the aortic arch, demonstrating an acute aortic dissection. The primary finding is a thin, linear, hypodense intimal flap that bisects the contrast-filled vessel into two distinct compartments: the true lumen (labeled 'T') and the false lumen (labeled 'F'). A red arrow specifically indicates the location of the intimal tear. The false lumen appears slightly more dilated than the true lumen, a common morphological feature in dissection. The image provides critical visual evidence for diagnosing Stanford Type A aortic dissection involving the arch, highlighting the spatial relationship between the primary entry tear and the newly formed vascular channels. This material is suitable for cardiovascular radiology education, specifically for teaching the identification of intimal flaps and differentiating true vs. false lumina in emergency vascular imaging.
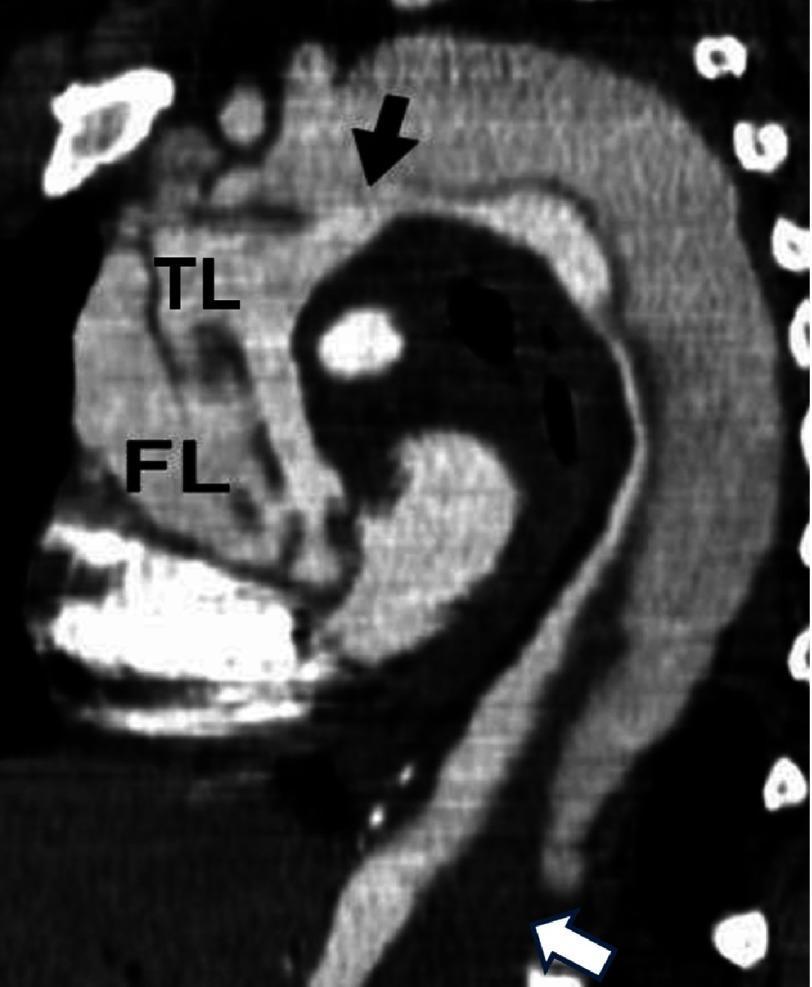
This diagnostic image is a contrast-enhanced CT scan of the thoracic aorta in a sagittal-oblique reconstruction, demonstrating a Stanford Type A Acute Aortic Dissection (AAD). The image reveals a clear intimal flap separating the aorta into a true lumen (TL) and a false lumen (FL). A primary entry tear is identified in the aortic arch, indicated by a black arrow. The dissection exhibits retrograde extension into the ascending aorta and antegrade extension into the descending thoracic aorta. The true lumen (TL) is identified by its smaller size and higher contrast density, whereas the larger false lumen (FL) displays heterogeneous density. A white arrow highlights a critical finding in the distal descending aorta: total thrombosis of the false lumen, characterized by a lack of contrast opacification. This radiological case illustrates the hallmark features used to classify aortic dissections and identify secondary complications like false lumen thrombosis, which is a key prognostic indicator in vascular surgery and emergency medicine.
AAA Rupture vs. Aortic Dissection
The Core Difference - One Analogy
- AAA Rupture = The hose has been slowly ballooning outward for years until it bursts - blood escapes completely outside the vessel
- Aortic Dissection = A tear in the inner lining of the hose allows blood to tunnel and split between the layers of the hose wall itself - creating two channels
Side-by-Side Comparison
| Feature | AAA Rupture | Aortic Dissection |
|---|---|---|
| What happens | A previously dilated (aneurysmal) aorta tears completely through its wall - blood escapes outside the vessel | A tear in the inner wall (intima) lets blood tunnel within the aortic wall, splitting the media into a true lumen and a false lumen |
| Starting problem | An existing aneurysm (bulge) that has grown too large and burst | A tear in the inner lining - the aorta may be normal-sized or only mildly dilated |
| Blood goes WHERE | Outside the aorta entirely - usually into the retroperitoneal space (behind the abdomen), or into the peritoneal cavity | Into the wall itself - between the intima and adventitia, creating a blood-filled false channel that can travel the entire length of the aorta |
| Location | Almost always abdominal aorta, below the kidneys (infrarenal) | Most commonly starts in the thoracic aorta - either just above the aortic valve (ascending) or just after the arch (descending) |
| Typical patient | Older man (65-80), smoker, known or unknown aortic aneurysm | Hypertensive patient (40-60 years), OR young patient with Marfan syndrome / connective tissue disorder |
| Pain character | Sudden severe abdominal or back pain, may have been preceded by weeks of dull ache | Sudden, tearing or ripping pain - classically described as the worst pain of life, radiates from chest to back |
| Pain location | Abdomen, flanks, lower back | Chest (anterior) for ascending, back/interscapular for descending - migrates as dissection travels |
| Blood pressure | Typically low (hypotension/shock) - major haemorrhage | Ascending: may be low; Descending: often markedly HYPERTENSIVE |
| Blood pressure in arms | Same in both arms | May be different in each arm (a key diagnostic clue - the dissection flap blocks one subclavian artery) |
| Pulsatile abdominal mass | Often palpable | Usually not palpable |
| Mortality if untreated | Near 100% - death from massive haemorrhage | Near 100% for Type A - death from cardiac tamponade, aortic regurgitation, or stroke |
| Key imaging | CT abdomen shows extravasation of blood outside the aorta, retroperitoneal haematoma | CT chest/abdomen shows intimal flap dividing aorta into true (T) and false (F) lumen |
| Emergency treatment | Immediate surgery (open or EVAR) - stop the bleeding | Type A (ascending): emergency cardiac surgery. Type B (descending): aggressive blood pressure control first (IV antihypertensives), surgery if complications develop |
Visualising the Difference
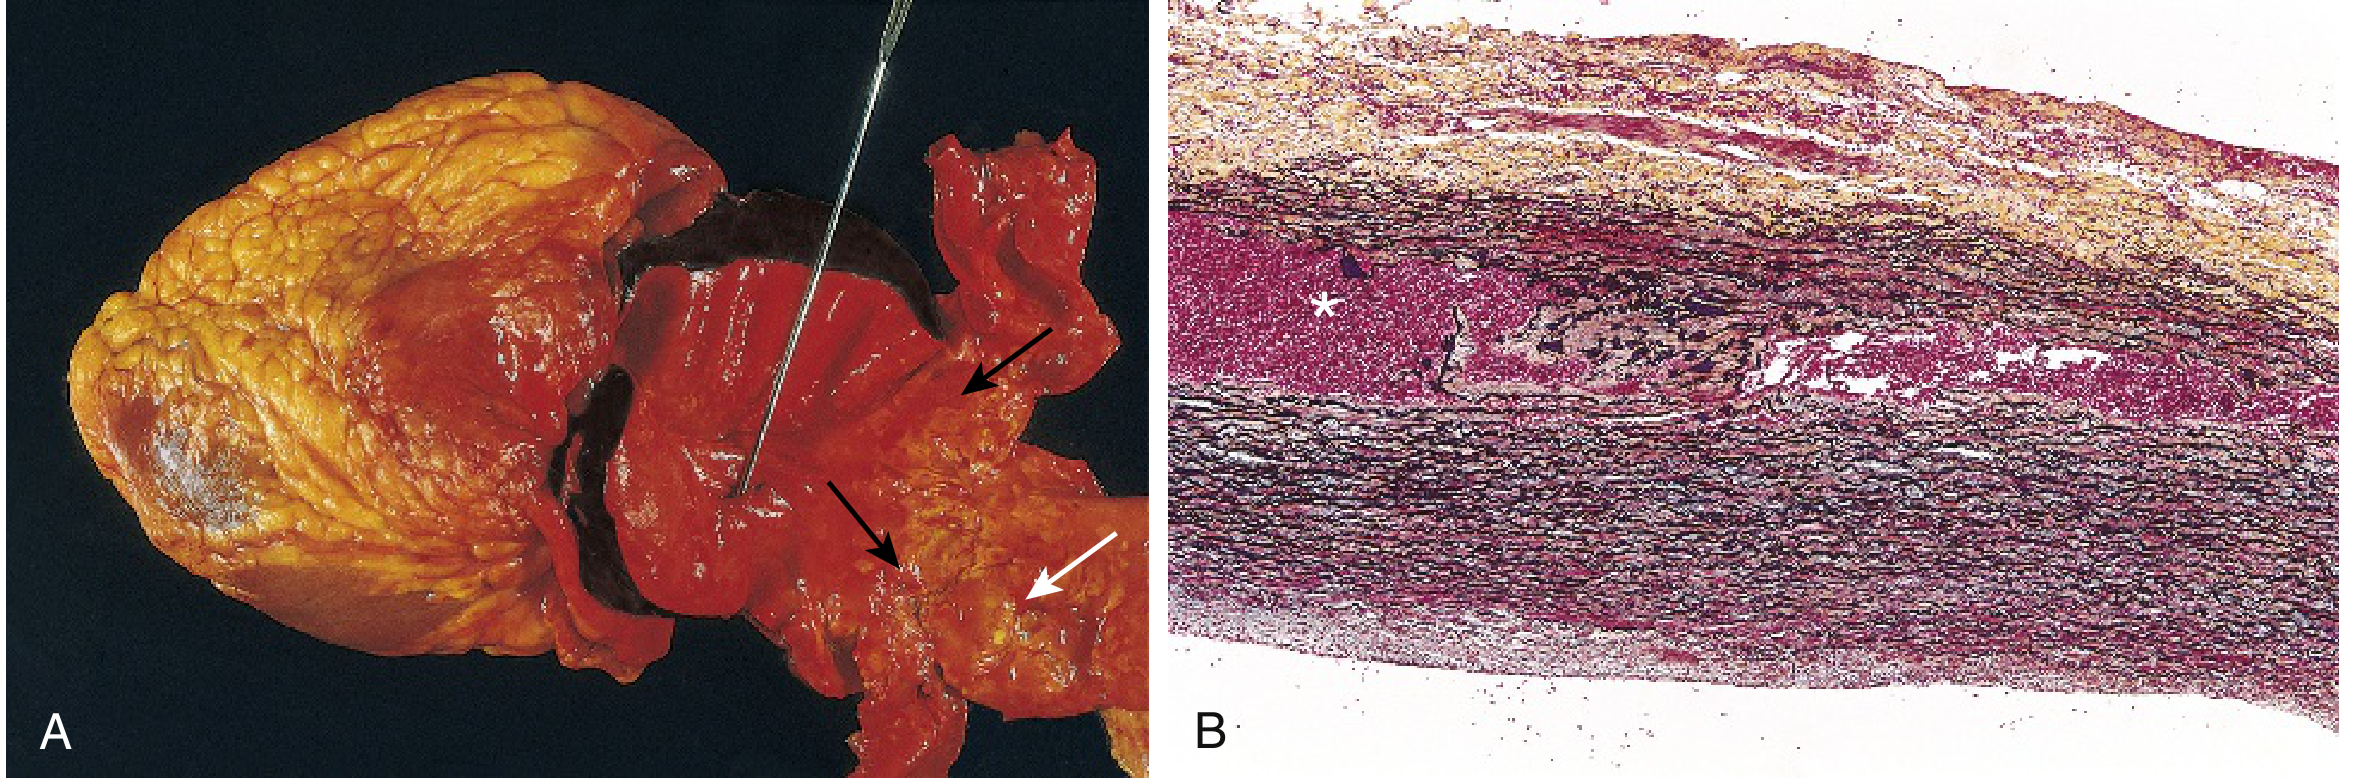
Aortic Dissection - Gross and Microscopic Pathology
Aortic Dissection on CT - True vs False Lumen
AAA Rupture on CT
Classification of Aortic Dissection (Stanford System)
| Type | Location | Treatment |
|---|---|---|
| Type A | Involves the ascending aorta (regardless of where it started) | Emergency open cardiac surgery within hours - mortality ~1-2% per hour without surgery |
| Type B | Involves only the descending aorta (does NOT involve ascending) | Medical management first - aggressive IV blood pressure lowering (beta-blockers, nitroprusside); surgery/EVAR only if complications arise |
- Track back to the aortic valve → acute aortic regurgitation (valve failure)
- Compress the coronary arteries → heart attack
- Fill the pericardial sac with blood → cardiac tamponade (the heart is squeezed and cannot pump)
- Block carotid arteries → stroke
Key Distinguishing Clinical Clues
| Clue | Suggests |
|---|---|
| Pulsatile abdominal mass + hypotension + abdominal/back pain | AAA Rupture |
| Tearing chest pain radiating to the back + blood pressure difference between arms | Aortic Dissection |
| Known history of aortic aneurysm | AAA Rupture |
| Young patient with tall/thin body type (Marfan) + chest pain | Aortic Dissection |
| Severe hypertension as the predominant finding | Aortic Dissection (especially Type B) |
| Haemorrhagic shock at presentation | More likely AAA Rupture |
| New aortic regurgitation murmur + chest pain | Type A Dissection |
Summary in One Sentence Each
AAA Rupture = An already-ballooned aorta finally bursts, spilling blood freely outside the vessel into the abdomen - causing rapid haemorrhagic shock.
Aortic Dissection = The inner lining of the aorta tears, and blood tunnels within the wall itself - the aorta hasn't burst outward yet, but the false channel can block branch vessels, rupture the valve, or eventually burst outward.
ABDOMINAL US IN AAA FOR SURVEILLANCE: WHAT IS THE MEANING OF SURVEILLANCE?
What Does "Surveillance" Mean in AAA?
"We know you have an aneurysm. It is not big enough to operate on right now. So we will check it regularly with ultrasound to see if it is growing - and the moment it reaches a dangerous size, we act."
The Simple Analogy
Why Not Just Operate on Every AAA Immediately?
| AAA Size | Annual Rupture Risk | Decision |
|---|---|---|
| 3.0 - 4.4 cm | ~0% | Surveillance only |
| 4.5 - 5.4 cm | ~1-5% | Closer surveillance |
| ≥ 5.5 cm | ~10-25%+ | Operate |
| Symptomatic (any size) | Imminent | Operate immediately |
What Surveillance Looks Like in Practice
- Cheap
- Safe (no radiation, no dye/contrast)
- Accurate for measuring aortic diameter (sensitivity 95-100%, specificity 100%)
- Repeatable as many times as needed
Surveillance Schedule (from Goldman-Cecil Medicine)
| Aneurysm Size | How Often to Scan |
|---|---|
| 3.0 - 3.9 cm | Every 2-3 years |
| 4.0 - 4.9 cm | Every 12 months |
| ≥ 5.0 cm | Every 6 months |
| ≥ 5.5 cm | Refer for repair - surveillance stops, treatment begins |
What Are We Looking for During Surveillance?
- Has it grown? - Average growth is ~0.35 cm/year, but some aneurysms grow faster
- Has it reached the repair threshold (5.5 cm)?
- Growth of >1 cm in 12 months (rapid expansion = higher rupture risk)
- Aneurysm becomes symptomatic (new back/abdominal pain = possible impending rupture)
- Size reaches 5.5 cm
In Summary
| Concept | Meaning |
|---|---|
| Surveillance | Repeated scheduled monitoring of a known AAA |
| Tool | Abdominal ultrasound |
| Goal | Catch dangerous growth before rupture occurs |
| Action threshold | ≥ 5.5 cm or symptomatic → stop surveillance, proceed to repair |
| Core principle | The risk of waiting < the risk of operating, until it isn't |
ANATOMU OF BR OF AORTA( MAIN BRANCH)
aorta main branches anatomy diagram ascending arch descending abdominal
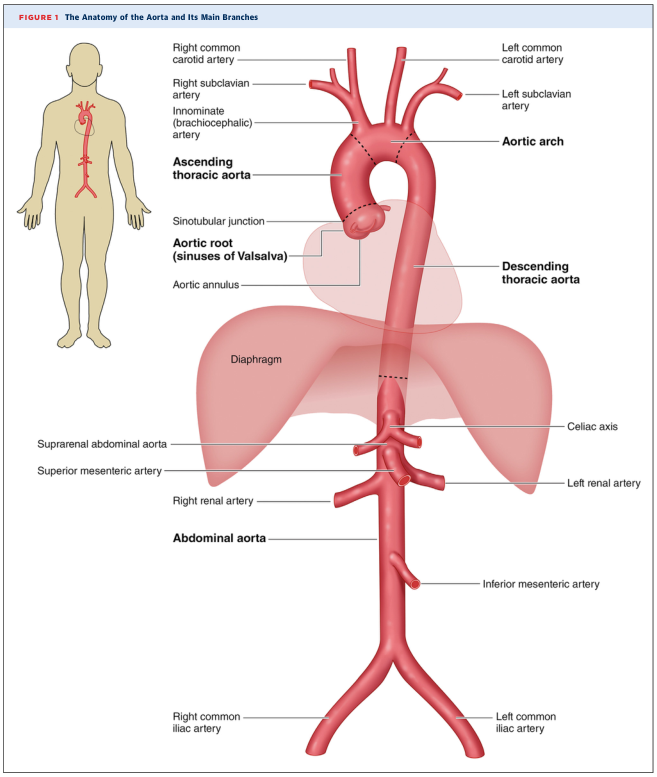
Summary : This figure illustrates the anatomy of the human aorta and its main branches, showing their spatial relationships to major organs and anatomical landmarks. illustration: # Main Structures : • The aorta is depicted as a large, central red vessel running vertically through the torso. • The aorta is divided into three main sections: ascending thoracic aorta, aortic arch, descending thoracic aorta, and abdominal aorta. • The diaphragm is shown as a translucent pink structure crossing the aorta. # Branches and Landmarks : • Ascending thoracic aorta: arises from the heart, includes the aortic root (sinuses of Valsalva) and aortic annulus. • Aortic arch: gives rise to three major branches: – Innominate (brachiocephalic) artery – Left common carotid artery – Left subclavian artery – Right common carotid artery and right subclavian artery branch from the innominate artery. • Descending thoracic aorta: continues downward through the chest. • Abdominal aorta: begins below the diaphragm and gives rise to several branches: – Celiac axis – Suprarenal abdominal aorta – Superior mesenteric artery – Right and left renal arteries – Inferior mesenteric artery – Right and left common iliac arteries (terminal branches) # Spatial Relationships : • The aorta passes posterior to the heart and anterior to the vertebral column. • The diaphragm separates the thoracic and abdominal portions of the aorta. • The abdominal aorta lies centrally and bifurcates into the right and left common iliac arteries at its lower end. # Annotations and Labels : • Each major branch and anatomical landmark is clearly labeled with leader lines. • A small human figure at left shows the aorta’s position within the body. # Analysis : • The figure provides a comprehensive overview of the aorta’s anatomy, highlighting its major branches and their order from the heart to the lower abdomen. • The spatial arrangement clarifies the transition from thoracic to abdominal aorta at the diaphragm. • The branching pattern demonstrates the aorta’s role as the main conduit for arterial blood from the heart to the rest of the body.
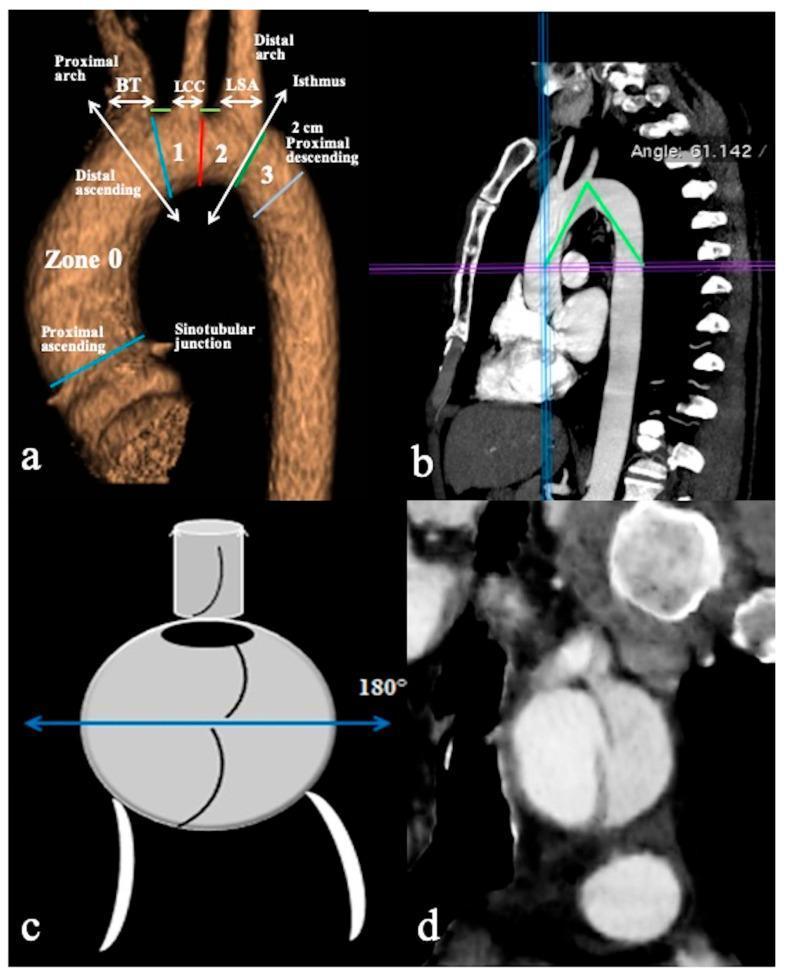
This composite figure illustrates normal and pathological aortic arch anatomy using Computed Tomography Angiography (CTA). Panel (a) is a 3D volume-rendered reconstruction in a parasagittal view identifying key landmarks: the sinotubular junction, proximal and distal ascending aorta (Zone 0), and supra-aortic branches including the brachiocephalic trunk (BT), left common carotid (LCC), and left subclavian artery (LSA). It delineates surgical zones (1, 2, 3) and distances between branch origins. Panel (b) is a parasagittal CTA reconstruction demonstrating the measurement of the aortic arch angle (61.142°), calculated between the arch's highest point and mid-luminal points of the ascending and descending aorta at the level of the pulmonary trunk bifurcation. Panel (c) provides a schematic cross-sectional diagram showing a primary entry tear at the 180° position (convexity) of the aortic arch, compared with tears at the concavity. Panel (d) shows a corresponding coronal CTA reconstruction depicting an aortic dissection flap with the primary entry tear located at the upper circumference of the arch. This educational material is designed for cardiovascular radiology and vascular surgery training regarding aortic dissection classification and morphometric analysis.
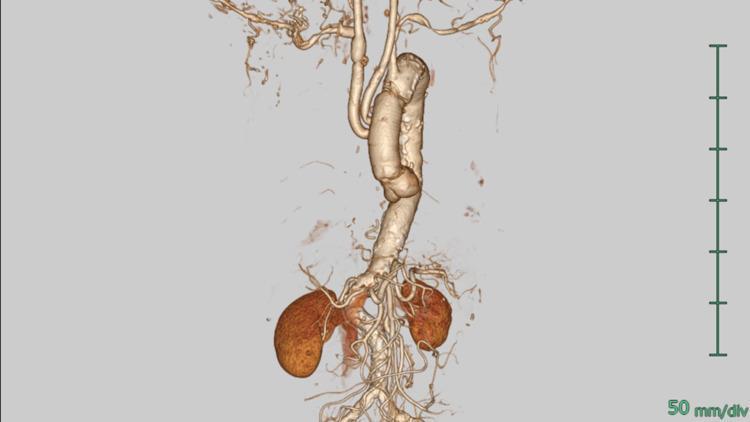
A postoperative 3D reconstructed computed tomography (CT) scan of the human aorta and its branches. The image highlights a partial arch replacement for acute aortic dissection in a patient with a bovine arch variant. The ascending aorta and a portion of the arch have been replaced with a vascular graft, which appears as a segmented tubular structure with distinct anastomotic lines. The supra-aortic vessels show surgical reconstruction: a branched graft is visible originating from the main aortic graft to supply the innominate artery (brachiocephalic trunk) and the left common carotid artery. This reconstruction followed the resection of a dilated proximal innominate artery. The descending aorta continues inferiorly, leading to the visualization of the abdominal aorta, bilateral renal arteries, and kidneys. There is no evidence of residual contrast-enhanced false lumen or dissection flaps within the reconstructed segments. This diagnostic visualization is used to assess surgical integrity and blood flow following complex cardiothoracic repair of the aortic arch.
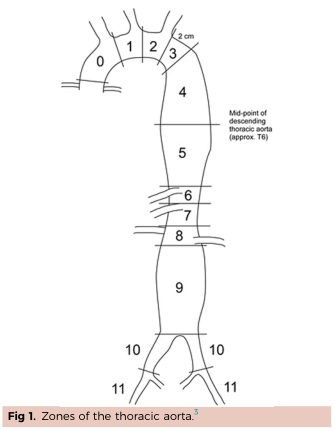
Summary : This illustration divides the thoracic aorta into anatomical zones, each labeled with a number from 0 to 11, to aid in clinical or surgical reference. diagram: # Zones of the Thoracic Aorta : • The aorta is segmented into 12 zones, numbered 0 through 11. • Zone 0: Proximal aortic arch. • Zones 1–3: Ascending aorta and arch, with zone 3 ending 2 cm distal to the left subclavian artery. • Zones 4–9: Descending thoracic aorta, with zone 4 starting after the arch and zone 9 ending before the bifurcation. • Zones 10–11: Abdominal aorta and iliac arteries. • The mid-point of the descending thoracic aorta is marked at approximately the T6 vertebral level. • Brachiocephalic, left common carotid, and left subclavian arteries branch from the arch near zones 0–3. # Annotations & Measurements : • "2 cm" is marked at the distal end of zone 3. • "Mid-point of descending thoracic aorta (approx. T6)" is labeled at zone 5. • Zones 10 and 11 correspond to the iliac arteries. # Layout : • The zones are arranged sequentially from the aortic root (top left) through the arch, descending thoracic aorta, and into the abdominal aorta and iliac arteries. • The diagram is a simplified line drawing, with each zone clearly demarcated by horizontal lines. # Analysis : • The figure provides a standardized anatomical reference for the thoracic and abdominal aorta, useful for describing the location of vascular pathology or interventions. • The segmentation highlights key anatomical landmarks, such as the arch branches and the aortic bifurcation. • The use of numbered zones facilitates precise communication in clinical and surgical contexts.
Anatomy of the Aorta and Its Main Branches
The 4 Segments of the Aorta
HEART (Left Ventricle)
↓
1. ASCENDING AORTA
↓
2. AORTIC ARCH
↓
3. DESCENDING THORACIC AORTA
↓
[passes through DIAPHRAGM]
↓
4. ABDOMINAL AORTA
↓
BIFURCATION at L4 vertebra
(level of the umbilicus)
↙ ↘
Right Common Left Common
Iliac Artery Iliac Artery
Segment 1: Ascending Aorta
| Branch | What It Supplies |
|---|---|
| Right coronary artery (RCA) | Right side of the heart, inferior wall |
| Left coronary artery (LCA) | Left side of the heart (divides into LAD + circumflex) |
These arise from the sinuses of Valsalva (the aortic root). Blockage = heart attack (myocardial infarction).
Segment 2: Aortic Arch
| Branch | What It Supplies |
|---|---|
| 1. Brachiocephalic trunk (also called innominate artery) | Divides into: Right common carotid (right side of brain/head) + Right subclavian artery (right arm) |
| 2. Left common carotid artery | Left side of brain and head |
| 3. Left subclavian artery | Left arm |
Memory trick: "Branches of the Arch" = Brachiocephalic, Left Common Carotid, Left Subclavian → "BLL" or think of them as "Two for the right, one for the left"
Clinical relevance: In aortic dissection, if the left subclavian is involved, blood pressure will be different in each arm - a key diagnostic sign.
Segment 3: Descending Thoracic Aorta
| Branch | What It Supplies |
|---|---|
| Bronchial arteries (paired) | Lung tissue itself (not gas exchange - that's the pulmonary circulation) |
| Oesophageal arteries | Oesophagus |
| Posterior intercostal arteries (×9 pairs) | Chest wall, ribs, intercostal muscles |
| Artery of Adamkiewicz | Major supply to the anterior spinal cord (lower thoracic/lumbar) - critically important in aortic surgery; damage = paraplegia |
| Superior phrenic arteries | Upper surface of diaphragm |
Segment 4: Abdominal Aorta
Unpaired ANTERIOR branches (supply gut organs):
| Branch | Origin Level | What It Supplies |
|---|---|---|
| Celiac trunk (axis) | T12 - just below diaphragm | Foregut: stomach, liver, spleen, upper duodenum, gallbladder, pancreas. Divides into: left gastric, splenic, common hepatic arteries |
| Superior Mesenteric Artery (SMA) | L1 - just below celiac | Midgut: small intestine, cecum, ascending colon, transverse colon |
| Inferior Mesenteric Artery (IMA) | L3 - below renal arteries | Hindgut: descending colon, sigmoid colon, upper rectum |
Memory trick for gut arteries: Celiac = Foregut, SMA = Midgut, IMA = Hindgut → "Fore, Mid, Hind"
Paired LATERAL branches (supply retroperitoneal organs):
| Branch | Origin Level | What It Supplies |
|---|---|---|
| Inferior phrenic arteries (paired) | Just below diaphragm | Underside of diaphragm, adrenal glands |
| Middle suprarenal arteries (paired) | Above renal arteries | Adrenal (suprarenal) glands |
| Renal arteries (paired) | L1-L2, just below SMA | Kidneys - the right renal artery is longer (crosses behind the inferior vena cava) |
| Gonadal arteries (paired) | Below renal arteries | Testes (testicular arteries) in males; Ovaries (ovarian arteries) in females |
POSTERIOR branches:
| Branch | What It Supplies |
|---|---|
| Lumbar arteries (4 pairs) | Posterior abdominal wall, spinal cord, muscles of the back |
| Median sacral artery | Sacrum, coccyx (tiny terminal branch) |
TERMINAL branches (where the aorta splits):
| Branch | What It Supplies |
|---|---|
| Right common iliac artery | Divides into right internal iliac (pelvic organs, buttocks) + right external iliac (→ right leg) |
| Left common iliac artery | Divides into left internal iliac + left external iliac (→ left leg) |
Bifurcation level: L4 vertebra, approximately at the level of the umbilicus. This is where AAA ends - 95% of AAAs are above the bifurcation, below the renal arteries (infrarenal).
Complete Summary Map
ASCENDING AORTA
├── Right Coronary Artery
└── Left Coronary Artery
AORTIC ARCH
├── Brachiocephalic Trunk → R. Common Carotid + R. Subclavian
├── Left Common Carotid Artery
└── Left Subclavian Artery
DESCENDING THORACIC AORTA
├── Bronchial arteries
├── Oesophageal arteries
├── Posterior intercostal arteries (×9 pairs)
└── Artery of Adamkiewicz (spinal cord)
ABDOMINAL AORTA
├── Inferior phrenic arteries (paired)
├── CELIAC TRUNK (foregut)
├── Superior Mesenteric A. (midgut)
├── Middle suprarenal arteries (paired)
├── Renal arteries (paired) ← AAA usually starts BELOW here
├── Gonadal arteries (paired)
├── Inferior Mesenteric A. (hindgut)
├── Lumbar arteries (×4 pairs)
├── Median sacral artery
└── BIFURCATION at L4
├── Right Common Iliac → Internal + External Iliac
└── Left Common Iliac → Internal + External Iliac
Why This Matters Clinically for AAA
| Branch | AAA Relevance |
|---|---|
| Renal arteries | 95% of AAAs are infrarenal (below these) - if the AAA extends above them, repair is far more complex |
| IMA | Often sacrificed in AAA repair - can cause left colon ischaemia if collaterals are poor |
| Common iliac arteries | AAAs often extend into iliac arteries - must be assessed at repair |
| Artery of Adamkiewicz | Risk of spinal cord ischaemia (paralysis) in thoracoabdominal repairs |
BRIEF LERICHE SYNDROME
Leriche syndrome aortoiliac occlusion diagram
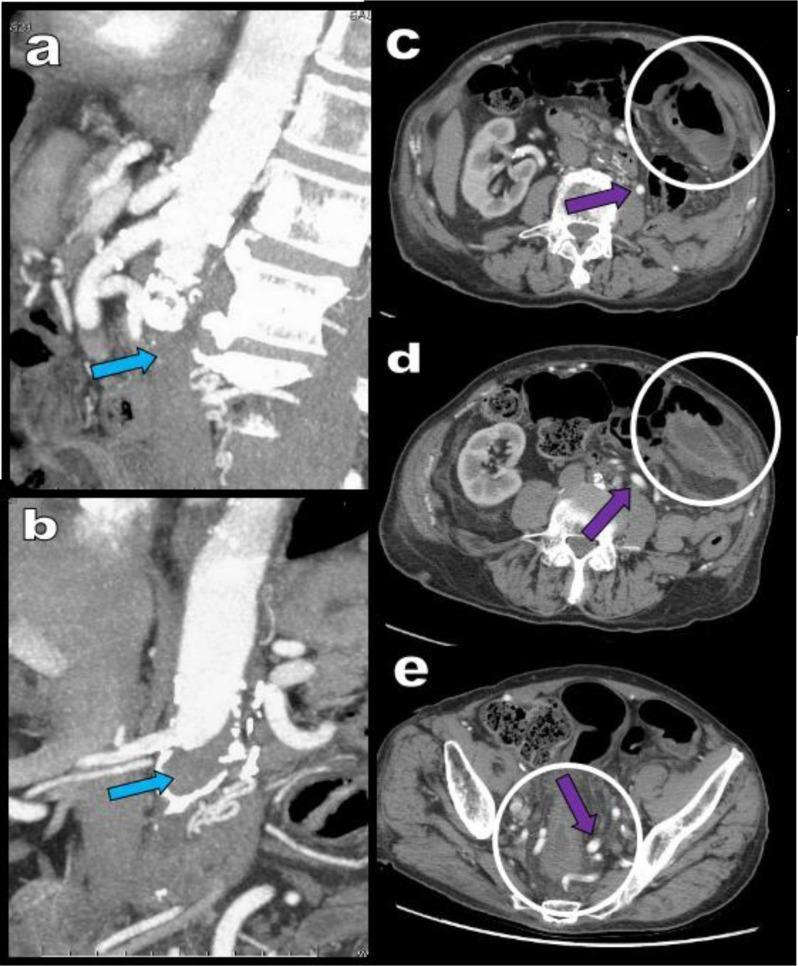
This composite diagnostic image features Multidetector Computed Tomography Angiography (MDCTA) views illustrating Leriche syndrome (aortoiliac occlusive disease) and its complications. Figures (a) sagittal and (b) coronal Multiplanar Reconstruction (MPR) demonstrate complete thrombotic occlusion of the abdominal aorta starting immediately distal to the origin of the renal arteries, indicated by blue arrows. Serial axial CT views (c, d, e) highlight secondary clinical manifestations. White circles denote significant thickening and hypodensity of the descending colonic wall, characteristic of ischemic colitis. Purple arrows point to massive, hypertrophied, and tortuous arterial collateralization along the expected course of the inferior mesenteric artery (IMA), representing compensatory vascular remodeling (e.g., meandering mesenteric artery) to bypass the aortic obstruction. The presence of these large collaterals underscores the chronic nature of the vascular occlusion. This educational material is suitable for vascular surgery and radiology instruction, focusing on aortic pathology and visceral ischemic consequences.
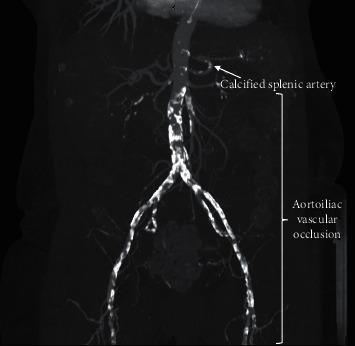
This diagnostic image is a Computed Tomography (CT) angiography reconstruction with maximum intensity projection (MIP) focusing on the abdominal and pelvic vasculature. The image demonstrates severe aortoiliac occlusive disease (AIOD), also known as Leriche syndrome. Key visual findings include extensive atherosclerotic plaque and mural calcification along the distal abdominal aorta, extending through the aortic bifurcation into the common and external iliac arteries bilaterally. The contrast opacification is significantly diminished or absent in these segments, indicating high-grade stenosis or complete vascular occlusion. Additionally, an arrow highlights a tortuous, calcified splenic artery in the upper left quadrant. The image serves as a clinical illustration of unsuitable pelvic vasculature for traditional renal transplantation, necessitating alternative surgical strategies such as orthotopic kidney transplantation (OKT) or autotransplantation. Educational focus is on vascular anatomy, atherosclerotic progression, and preoperative surgical planning for transplant recipients with complex vascular comorbidities.
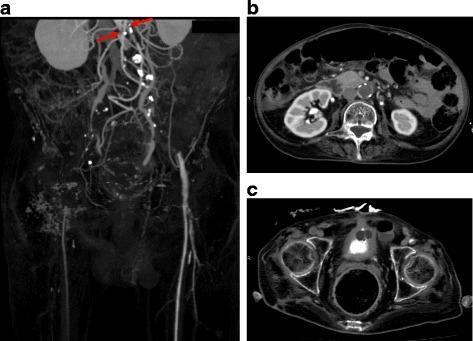
This diagnostic image composite includes a Computed Tomography Angiography (CTA) maximum intensity projection (MIP) in coronal view (a) and two axial contrast-enhanced CT slices (b, c) of the abdomen and pelvis. The images demonstrate Leriche syndrome, characterized by a complete occlusion of the infrarenal abdominal aorta. In panel (a), red arrows indicate the level of aortic termination immediately below the renal arteries. There is a bilateral absence of contrast opacification in the common, internal, and external iliac arteries, consistent with extensive aortoiliac occlusive disease. The right infrainguinal vessels are non-visualized, suggesting distal extension of the occlusion. Conversely, the left infrainguinal vessels (femoral artery) show patency, maintained via extensive collateral circulation. Panel (b) confirms the lack of contrast within the aortic lumen at the infrarenal level, while panel (c) shows the pelvic vascular distribution. These findings are clinically significant for evaluating acute or chronic limb-threatening ischemia and planning surgical or endovascular revascularization.
Leriche Syndrome - Brief Overview
What Is It?
The Classic Triad
| # | Feature | Why It Happens |
|---|---|---|
| 1 | Bilateral lower limb claudication | Legs (thighs, hips, buttocks, calves) don't get enough blood during walking → cramping pain that stops with rest |
| 2 | Erectile dysfunction / impotence | The internal iliac (hypogastric) arteries - which supply the pelvic organs and penis - are starved of blood |
| 3 | Absent or diminished femoral pulses | The femoral arteries (felt in the groin) receive no/little flow from the blocked aorta |
Memory: "The 3 Bs" - Buttock claudication, Bilateral absent femoral pulses, Boner dysfunction (impotence)
Where Exactly Is the Blockage?
Abdominal Aorta
|
↓
OCCLUSION HERE ← atherosclerotic plaque + thrombus
(at or just above aortic bifurcation)
|
----+----
↓ ↓
Right Left
Common Common
Iliac Iliac
↓
Legs, pelvis, buttocks → ISCHEMIC
CT Angiography Findings
Risk Factors
- Smoking (the most important)
- Diabetes
- Hypertension
- Hyperlipidaemia (high cholesterol)
- Male sex, age 50-60s
Symptoms in Detail
| Symptom | Character |
|---|---|
| Buttock/thigh/hip claudication | Cramping pain induced by walking, relieved within minutes of rest - not present at rest in early disease |
| Leg muscle atrophy | Chronic poor perfusion → muscles waste away |
| Impotence | Reduced or absent blood flow through internal iliac arteries → erectile failure in up to 30-50% of men |
| Absent femoral pulses | Hallmark physical exam finding - cannot feel the pulse in either groin |
| Pale, cool legs | Reduced perfusion → legs look washed out |
| Ischemic rest pain / gangrene | In severe/late disease - pain even at rest, non-healing ulcers, tissue death in feet/toes |
Diagnosis
| Test | Findings |
|---|---|
| Physical exam | Absent bilateral femoral pulses - the single most important bedside clue |
| Ankle-Brachial Index (ABI) | Ratio of ankle BP to arm BP - normal ≥1.0; Leriche typically <0.5 (severely reduced) |
| Duplex ultrasound | Shows absent/reduced flow in aorta and iliacs |
| CT Angiography (CTA) | Gold standard - shows exact level and extent of occlusion and collateral vessels |
| MR Angiography (MRA) | Alternative to CTA, no radiation |
Treatment
| Approach | Details |
|---|---|
| Medical management | Smoking cessation (most important), antiplatelet drugs (aspirin/clopidogrel), statins, blood pressure control, supervised exercise programme |
| Endovascular | Angioplasty + stenting of the aorta and iliac arteries (less invasive, for shorter occlusions) |
| Open surgery | Aortobifemoral bypass graft - a synthetic Y-shaped tube graft sewn from the aorta to both femoral arteries, bypassing the blockage entirely. This is the gold standard for complete occlusion - durable, long-term patency >80% at 10 years |
| Thromboendarterectomy | Surgical removal of the clot/plaque from inside the aorta - used in selected cases |
Key Differences: Leriche vs AAA vs Dissection
| Leriche Syndrome | AAA Rupture | Aortic Dissection | |
|---|---|---|---|
| Problem | Chronic blockage of aorta | Burst of dilated aorta | Tear in aortic wall layers |
| Flow | Too little (ischaemia) | Catastrophic blood loss | Disrupted - false lumen forms |
| Onset | Chronic, months-years | Sudden | Sudden |
| Pain | Cramping with walking | Severe abdominal/back pain | Tearing chest/back pain |
| Femoral pulses | Absent | Present (until shock) | May be unequal |
| Emergency? | Usually not (unless acute) | Yes - surgical emergency | Yes - surgical emergency |

Is the question wrong I mean the options because the aortoiliac causing buttock and thigh pain and common or internal iliac artery causing erectile dysfunction ?
You Are NOT Wrong in Your Anatomy - But Here Is the Full Picture
- Buttock/thigh claudication = aortoiliac disease
- Erectile dysfunction = internal iliac (hypogastric) artery compromise
The internal iliac artery IS a branch of the common iliac artery, which is itself a branch of the aortoiliac segment.
The Vascular Chain Explained
ABDOMINAL AORTA
|
OCCLUSION (Leriche)
|
↓
COMMON ILIAC ARTERY
|
┌────┴────┐
↓ ↓
EXTERNAL INTERNAL ILIAC
ILIAC (Hypogastric)
ARTERY ARTERY
| |
↓ ↓
Leg → Internal pudendal a.
Buttock/ → Penile blood flow
Thigh → ERECTILE DYSFUNCTION
claudication
Why the Other Options Are Wrong
| Option | Why Wrong |
|---|---|
| Femoropopliteal artery | Causes calf claudication (not buttock/thigh), and does NOT affect internal iliac → no erectile dysfunction |
| Tibial artery | Causes foot ischaemia, rest pain, gangrene - no buttock claudication, no erectile dysfunction |
| Superficial femoral artery (SFA) | Causes calf claudication only - the SFA does NOT supply the buttocks or internal pelvic organs |
| Aortoiliac artery ✓ | Causes buttock + thigh claudication (external iliac/femoral territory) AND erectile dysfunction (internal iliac territory) - the ONLY level that produces BOTH |
The Level = The Symptom Pattern
| Occlusion Level | Claudication Location | Erectile Dysfunction? |
|---|---|---|
| Aortoiliac | Buttock, thigh, hip | YES |
| Femoropopliteal | Calf | No |
| Tibial | Foot, rest pain | No |
Bottom Line
- Aortoiliac occlusion causes buttock/thigh claudication ✓
- The same occlusion starves the internal iliac artery (its branch), causing erectile dysfunction ✓

The approach said CTA FIRST why my answer is wrong?
The Key Issue: What Is the Question Really Asking?
Why This AAA Needs Surgery - The Critical Red Flag
| Time | Size |
|---|---|
| Initial scan | 3.2 cm |
| 6 months later | 4.5 cm |
| Growth | +1.3 cm in 6 months |
A growth of >1 cm in 12 months (or >0.5-1 cm in 6 months) = RAPID EXPANSION = indication for surgical repair, regardless of absolute size.
Why CTA Is NOT the Answer Here
| Option | Problem |
|---|---|
| "Perform CTA" | This is a diagnostic/planning step, not a management decision. The decision has already been made - this patient NEEDS surgery. CTA is a tool to prepare FOR surgery, not the answer to "what is the management?" |
| "Prepare for surgical intervention" ✓ | This is the correct management decision - CTA will happen as part of preparing for surgery, but the overarching answer is to proceed with surgical intervention |
"Prepare for surgical intervention" INCLUDES doing a CTA. The surgical preparation process involves CTA + blood work + anaesthesia assessment + consent etc.
Full Decision Framework for This Patient
AAA 3.2 cm → 4.5 cm in 6 months
↓
RAPID EXPANSION (>1cm/12mo threshold)
↓
DECISION: Prepare for surgery
↓
As part of preparation:
├── CTA (anatomical planning)
├── Blood tests + cross-match
├── Cardiology/anaesthesia assessment
├── Consent
└── EVAR vs Open repair decision
Why the Other Options Are Wrong
| Option | Why Wrong |
|---|---|
| Assure patient + medical treatment | Medical therapy alone is insufficient when rapid growth is documented |
| Continue follow-up for another year | Dangerous - this aneurysm is growing rapidly; waiting a year risks rupture |
| Perform CTA | Not wrong as a step, but it is a tool in preparation, not the management decision itself |
| Prepare for surgical intervention ✓ | Correct - rapid expansion is a clear surgical indication regardless of size |
Summary Rule to Remember
| Situation | Action |
|---|---|
| AAA < 5.5 cm, slow/no growth | Surveillance (US every 6-12 months) |
| AAA ≥ 5.5 cm, asymptomatic | Prepare for surgery |
| AAA any size, symptomatic | Prepare for surgery immediately |
| AAA any size, rapid growth (>1cm/year) | Prepare for surgery ← this question |
| AAA any size, ruptured | Emergency surgery NOW |

my answer will be color dublex is it wrong?
The Single Most Important Clue in This Question
Creatinine = 2.5 mg/dL (normal < 1 mg/dL)
Why Each Option Is Eliminated or Chosen
| Option | Verdict | Reason |
|---|---|---|
| Conventional Angiography | ❌ Wrong | Requires iodinated contrast (nephrotoxic) + invasive (arterial puncture) + radiation. Contraindicated with creatinine 2.5 - high risk of contrast-induced nephropathy worsening already damaged kidneys |
| CT Angiography (CTA) | ❌ Wrong | Also requires large volume of iodinated contrast - same nephrotoxicity risk. Normally excellent for PAD, but contraindicated in renal failure |
| Color Duplex Evaluation | ✅ CORRECT | No contrast, no radiation, non-invasive. Uses ultrasound + Doppler to visualise arteries and measure flow velocity. Safe in renal impairment. First-line for peripheral arterial disease (PAD) assessment |
| Hand-held Doppler | ❌ Wrong | Only gives a simple signal (present/absent flow) and calculates ABI - useful as a screening tool but does NOT give anatomical detail, localise the lesion, or assess severity adequately for a vascular clinic workup |
The Logic Pathway
50M + claudication + creatinine 2.5 (HIGH)
↓
NEEDS vascular imaging
↓
Can we use contrast? → NO (renal failure)
↓
Eliminates: CTA and Conventional Angio
↓
Remaining safe options: Duplex or Hand-held Doppler
↓
Which gives DETAILED anatomical + flow info?
↓
COLOR DUPLEX ✓
What Color Duplex Actually Shows
- B-mode ultrasound - visualises the vessel wall, plaques, calcification
- Color Doppler - shows direction and speed of blood flow (color-coded)
- Spectral waveform analysis - detects stenosis by measuring velocity changes
- Location of the occlusion/stenosis (aortoiliac, femoropopliteal, tibial)
- Severity of stenosis
- Presence of collateral flow
- Plaque characteristics
Key Rule to Remember
| Situation | Best Vascular Imaging |
|---|---|
| Renal impairment (high creatinine) | Color Duplex (no contrast) or MRA with gadolinium (but gadolinium also risky in severe CKD) |
| Normal renal function, pre-op planning | CTA or MRA |
| Quick bedside screening | Hand-held Doppler + ABI |
| Intervention planned in same sitting | Conventional angiography |
Bottom Line
- This patient has renal failure → contrast-based imaging (CTA, conventional angio) is dangerous
- Color duplex gives detailed anatomical and flow information - far superior to hand-held Doppler alone
- It is non-invasive, no radiation, no contrast, no nephrotoxicity risk
explain to me the pathophysiology of sepsis.
sepsis pathophysiology inflammatory cascade diagram organ failure
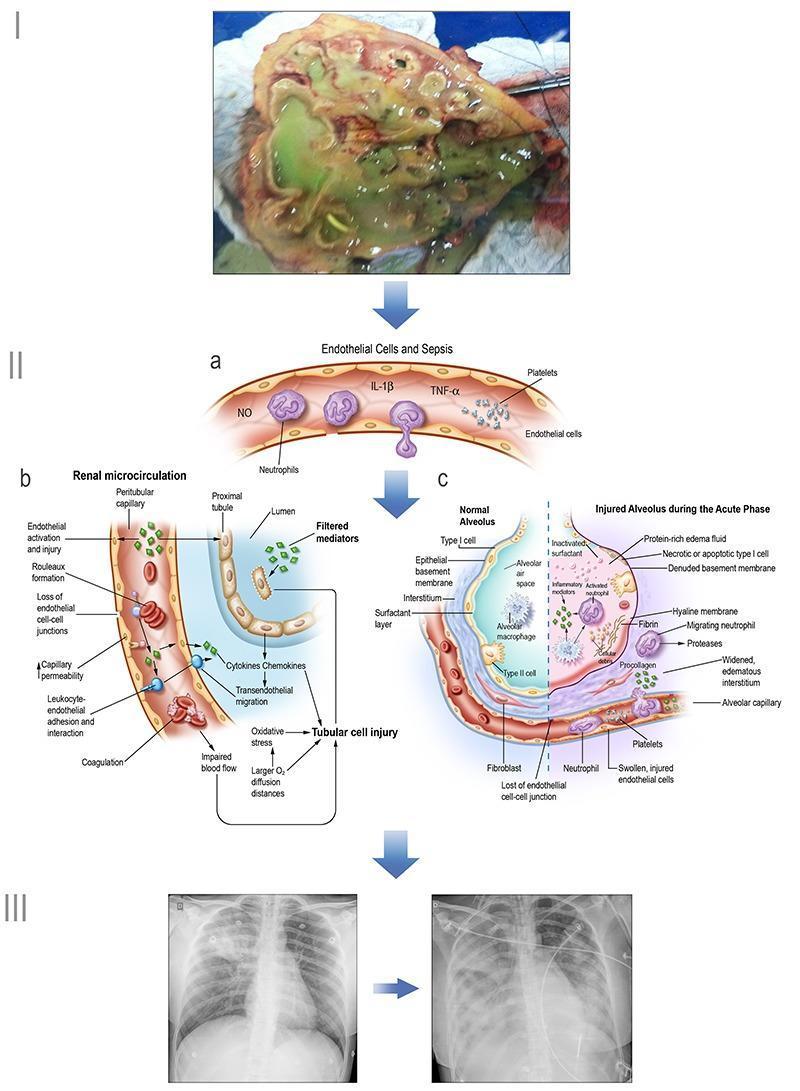
Educational infographic illustrating the pathogenesis of sepsis and multi-organ dysfunction. Section I shows a clinical photograph of a necrotic kidney (pyelonephritis). Section II contains three pathophysiology diagrams: (a) General endothelial changes in sepsis, depicting neutrophil extravasation, platelet activation, and release of inflammatory mediators like TNF-α, IL-1β, and NO; (b) Renal microcirculation injury, highlighting peritubular capillary changes (rouleaux formation, leukocyte adhesion, increased permeability) and subsequent tubular cell injury via oxidative stress and impaired blood flow; (c) Alveolar-capillary comparative diagram, contrasting a normal alveolus with one in the acute phase of ARDS, showing hyaline membrane formation, protein-rich edema, and Type I cell necrosis. Section III features diagnostic chest X-rays demonstrating progressive bilateral opacities consistent with acute respiratory distress syndrome. This visual summary correlates clinical findings, diagnostic imaging (radiography), and microscopic pathophysiology to explain systemic sepsis-induced organ failure.
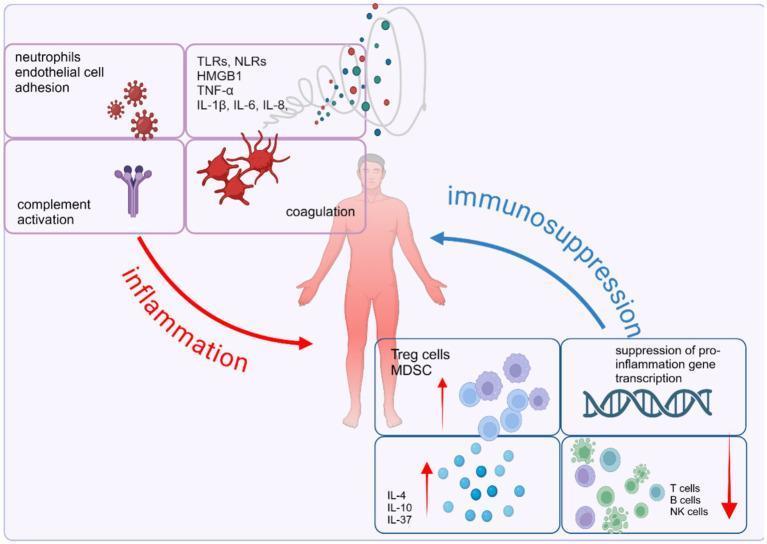
This pathophysiology diagram illustrates the dysregulated host immune response in sepsis, characterized by an imbalance between concurrent pro-inflammatory and anti-inflammatory pathways. Centered on a human figure, the left side (red 'inflammation' arrow) details the acute systemic inflammatory response syndrome (SIRS), featuring neutrophil-endothelial cell adhesion, complement activation, and coagulation cascades. A molecular cloud identifies key mediators including DAMPs/PAMPs (HMGB1, TLRs, NLRs) and pro-inflammatory cytokines (TNF-α, IL-1β, IL-6, IL-8). Conversely, the right side (blue 'immunosuppression' arrow) represents the compensatory anti-inflammatory response syndrome (CARS). This includes the expansion of suppressor cells (Treg cells, MDSCs) and anti-inflammatory cytokines (IL-4, IL-10, IL-37), the suppression of pro-inflammatory gene transcription, and the depletion or exhaustion of effector cells (T cells, B cells, and NK cells). The diagram serves as an educational tool for understanding the complex signaling pathways and cellular interactions that drive multi-organ dysfunction and immune homeostasis failure during septic shock.
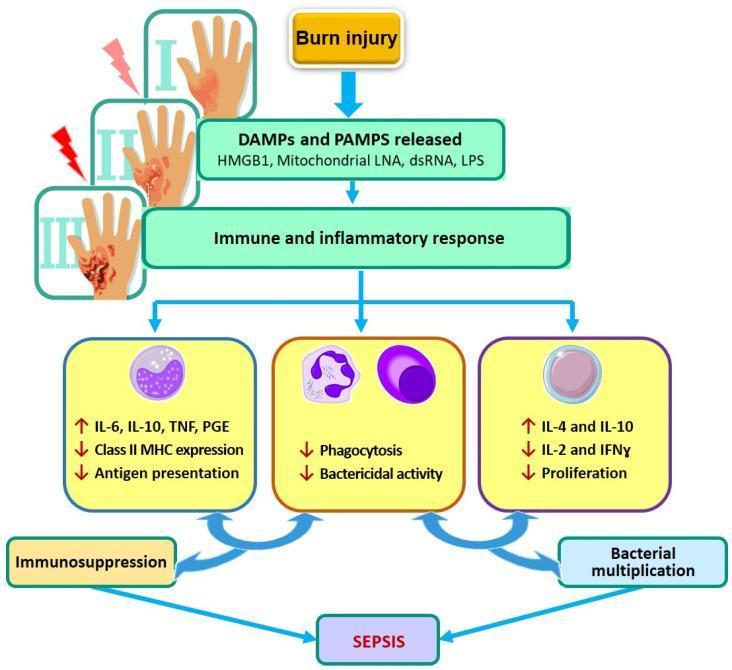
A pathophysiology flow diagram illustrating the immunological cascade from severe burn injury to the development of sepsis. The diagram begins with a burn injury, represented by illustrations of first-, second-, and third-degree burns on a hand, leading to the systemic release of Damage-Associated Molecular Patterns (DAMPs) and Pathogen-Associated Molecular Patterns (PAMPs), specifically citing HMGB1, mitochondrial LNA, dsRNA, and LPS. This initiates a complex immune and inflammatory response characterized by three convergent pathways: 1) Pro-inflammatory and anti-inflammatory cytokine imbalances (increased IL-6, IL-10, TNF, and PGE) alongside reduced Class II MHC expression and antigen presentation, leading to immunosuppression. 2) Impaired innate cellular function, specifically decreased phagocytosis and bactericidal activity. 3) Th2-skewed cytokine shifts (increased IL-4 and IL-10; decreased IL-2 and IFN̲γ) and reduced lymphocyte proliferation, promoting bacterial multiplication. These combined dysregulated host responses ultimately culminate in burn-induced sepsis.
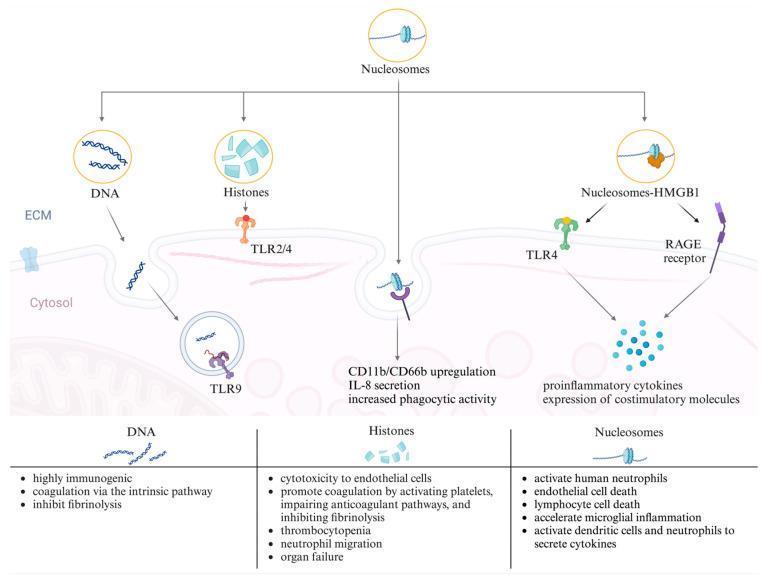
This pathophysiology diagram illustrates the role of extracellular nucleosomes, DNA, and histones as Damage-Associated Molecular Patterns (DAMPs) in the pathogenesis of inflammation and sepsis. The top section depicts molecular interactions at the cellular membrane between the extracellular matrix (ECM) and the cytosol. It shows DNA entering the cell to interact with TLR9, while free histones bind to surface TLR2/4. Nucleosome-HMGB1 complexes are shown engaging TLR4 and RAGE receptors. These interactions trigger intracellular signaling leads to neutrophil activation (CD11b/CD66b upregulation), IL-8 secretion, and the release of proinflammatory cytokines. The bottom portion features a comparison chart detailing systemic clinical consequences. For DNA, these include intrinsic pathway coagulation and fibrinolysis inhibition. For histones, findings include endothelial cytotoxicity, thrombocytopenia, and organ failure. For nucleosomes, the chart lists endothelial and lymphocyte cell death, microglial inflammation, and cytokine secretion. The diagram serves as an educational summary of how nuclear components released into the circulation drive immune dysregulation and coagulopathy during systemic inflammatory responses.
Pathophysiology of Sepsis
First: What Is Sepsis? (Definition)
A life-threatening organ dysfunction caused by a dysregulated host response to infection.
"The patient appears to die from the body's response to infection rather than from it."
The Big Picture - A Simple Framework
INFECTION (bacteria, virus, fungus)
↓
Body detects pathogen (PAMPs)
+ detects its own cell damage (DAMPs)
↓
Massive immune activation
↓
Pro-inflammatory storm (SIRS)
↓
Endothelial injury + coagulation
↓
Microvascular failure
↓
Oxygen delivery failure → cellular death
↓
Multi-organ dysfunction / failure
↓
DEATH (if untreated)
Step 1: The Trigger - PAMPs and DAMPs
| Signal | Full Name | Source | Examples |
|---|---|---|---|
| PAMPs | Pathogen-Associated Molecular Patterns | From the invading microbe | Bacterial lipopolysaccharide (LPS/endotoxin) from gram-negative bacteria; peptidoglycan from gram-positive bacteria; fungal cell wall components; viral RNA/DNA |
| DAMPs | Damage-Associated Molecular Patterns | From the host's own injured cells | Histones, HMGB1 (High Mobility Group Box 1 protein), ATP, double-stranded DNA, oxidized phospholipids |
- Toll-Like Receptors (TLRs) - the most important; TLR4 recognises LPS from gram-negative bacteria
- NOD-like receptors, RAGE, RIG-I receptors
Step 2: The Cytokine Storm - Systemic Inflammatory Response
Pro-inflammatory cytokines (the "fire"):
| Cytokine | Key Effects |
|---|---|
| TNF-α (Tumour Necrosis Factor) | Activates endothelium, triggers fever, promotes apoptosis (cell death), activates coagulation |
| IL-1β (Interleukin-1 beta) | Works with TNF-α; causes fever, vasodilation, endothelial activation |
| IL-6 | Stimulates acute-phase proteins (CRP, fibrinogen); drives fever; triggers bone marrow to release more neutrophils |
| IL-8 | Chemokine - attracts more neutrophils to the site |
What the cytokines cause systemically:
- Fever or hypothermia (temperature dysregulation)
- Tachycardia (heart working harder)
- Vasodilation → ↓ blood pressure
- Increased vascular permeability → fluid leaks out of vessels into tissues
- Endothelial cell activation → the vessels themselves are damaged
Step 3: Endothelial Injury - The Central Event
- Keeps blood in vessels
- Prevents clotting
- Regulates blood flow
- Prevents leukocytes from sticking
- Upregulate adhesion molecules (ICAM-1, E-selectin, P-selectin) → neutrophils stick to vessel walls
- Increase permeability → plasma leaks into tissues → oedema, hypovolaemia
- Produce nitric oxide (NO) in massive amounts → profound vasodilation and hypotension
- Promote thrombosis → clotting cascade activation
Step 4: The Coagulation Disaster - DIC
Inflammatory mediators
↓
Tissue Factor expressed on endothelium/monocytes
↓
Coagulation cascade activated
↓
Widespread MICROTHROMBI in small vessels
↓
Clotting factors and platelets CONSUMED
↓
Paradox:
Clots blocking vessels + Bleeding risk
(ischaemia) (no factors left)
Step 5: The Compensatory Anti-Inflammatory Response (CARS)
- IL-10, IL-4, IL-37 (anti-inflammatory cytokines) are released
- Regulatory T cells (Tregs) and MDSCs (myeloid-derived suppressor cells) expand
- Pro-inflammatory gene transcription is suppressed
- T cells, B cells, NK cells undergo apoptosis (programmed death) - massive lymphocyte death
Step 6: Cardiovascular Failure - Distributive Shock
| Parameter | What Happens | Why |
|---|---|---|
| Vasodilation | ↓↓ Systemic vascular resistance | Massive NO release + inflammatory mediators |
| Capillary leak | Fluid leaks into tissues | Endothelial permeability ↑ |
| Effective circulating volume | ↓↓ (despite normal/high total body water) | Fluid is in the wrong compartment (interstitium) |
| Cardiac output | Initially ↑ (hyperdynamic phase) then ↓ | Heart tries to compensate, then fails |
| Myocardial depression | Heart contractility ↓ | TNF-α, IL-1β, NO directly depress the myocardium |
Step 7: Multi-Organ Dysfunction Syndrome (MODS)
| Organ | Failure Manifestation | Mechanism |
|---|---|---|
| Lungs | ARDS (Acute Respiratory Distress Syndrome) - stiff, flooded lungs, ↓ O2 | Neutrophil-mediated endothelial damage → alveolar flooding; NO disrupts gas exchange |
| Kidneys | AKI (Acute Kidney Injury) - ↑ creatinine, ↓ urine output | Renal microvascular thrombi + hypoperfusion → tubular ischaemia |
| Liver | ↑ Bilirubin, ↑ transaminases | Hepatic microcirculatory failure + direct cytokine toxicity |
| Brain | AMS (Altered Mental Status) / septic encephalopathy | BBB disruption, microemboli, neurotransmitter dysregulation |
| Heart | Myocardial depression, arrhythmias | TNF-α, IL-1β, NO suppress cardiac contractility |
| Coagulation | DIC - bleeding + clotting simultaneously | Consumption of clotting factors + platelet destruction |
| Gut | Ileus, ischaemic colitis | Splanchnic hypoperfusion + mucosal barrier failure → bacterial translocation (bacteria move from gut into blood → amplifies sepsis) |
The Cellular Level: Why Cells Die
- Mitochondria are damaged by ROS (reactive oxygen species) and NO
- Oxidative phosphorylation fails - cells cannot make ATP
- Cells switch to anaerobic metabolism → lactic acid production ↑
- ↑ Serum lactate is a key marker of cellular oxygen debt in sepsis
- Cells undergo apoptosis (programmed death) and necrosis
Complete Pathophysiology Summary Diagram
INFECTION
↓
PAMPs (from pathogen) + DAMPs (from injured cells)
↓
TLRs and PRRs on neutrophils/macrophages activated
↓
CYTOKINE STORM (TNF-α, IL-1β, IL-6, IL-8)
↓
┌──────────────────────┬────────────────────────┐
│ VASODILATION │ ENDOTHELIAL INJURY │
│ (NO ↑↑) │ + COAGULATION │
│ → Hypotension │ → Microthrombi (DIC) │
│ → Distributive │ → Capillary leak │
│ Shock │ → Oedema │
└──────────┬───────────┴────────────┬───────────┘
↓ ↓
↓ O2 DELIVERY ORGAN ISCHAEMIA
Mitochondrial (despite perfusion)
dysfunction
↓ ↓
LACTIC ACIDOSIS MULTI-ORGAN FAILURE
Lungs: ARDS
Kidneys: AKI
Brain: AMS/Encephalopathy
Heart: Myocardial depression
Liver: Jaundice
Coagulation: DIC
↓
DEATH
Key Biomarkers of Sepsis Pathophysiology
| Marker | What It Reflects |
|---|---|
| ↑ Lactate | Cellular hypoxia / anaerobic metabolism |
| ↑ CRP, ↑ Procalcitonin | Systemic inflammation / bacterial infection |
| ↑ WBC (or ↓ WBC) | Neutrophilia (or neutropenia in overwhelming infection) |
| ↑ Creatinine | AKI |
| ↓ Platelets | DIC / consumption |
| ↑ PT/INR | DIC / coagulopathy |
| ↑ Bilirubin | Hepatic dysfunction |
| ↓ MAP / need for vasopressors | Vasodilatory shock |
SOFA Score - Quantifying Organ Dysfunction
| Organ | Measurement |
|---|---|
| Brain | Glasgow Coma Scale (GCS) |
| Cardiovascular | MAP or vasopressor requirements |
| Respiratory | PaO2/FiO2 ratio (or ventilator use) |
| Liver | Bilirubin |
| Renal | Creatinine |
| Coagulation | Platelet count |
In One Sentence
Sepsis kills by triggering an uncontrolled immune response to infection that simultaneously causes massive vasodilation (dropping blood pressure), endothelial injury (causing leaking vessels and clot formation), mitochondrial dysfunction (preventing cells from using oxygen), and ultimately multi-organ failure - driven not by the pathogen itself but by the host's own runaway defences.
please summarize this lecture
python3 -c " import pdfplumber with pdfplumber.open('/tmp/workspace/attachments/c313fd86-172a-46ea-a608-9eae04a2fdcc/Blood transfusion 1446-1.pdf') as pdf: print(f'Total pages: {len(pdf.pages)}') for i, page in enumerate(pdf.pages[:5]): text = page.extract_text() print(f'--- PAGE {i+1} ---') print(text[:1500] if text else '[No text extracted]') print() "
python3 -c " import pdfplumber with pdfplumber.open('/tmp/workspace/attachments/c313fd86-172a-46ea-a608-9eae04a2fdcc/Blood transfusion 1446-1.pdf') as pdf: all_text = [] for i, page in enumerate(pdf.pages): text = page.extract_text() if text and text.strip(): all_text.append(f'=== PAGE {i+1} ===\n{text.strip()}') full = '\n\n'.join(all_text) print(full[:8000]) "
python3 -c " import pdfplumber with pdfplumber.open('/tmp/workspace/attachments/c313fd86-172a-46ea-a608-9eae04a2fdcc/Blood transfusion 1446-1.pdf') as pdf: all_text = [] for i, page in enumerate(pdf.pages): text = page.extract_text() if text and text.strip(): all_text.append(f'=== PAGE {i+1} ===\n{text.strip()}') full = '\n\n'.join(all_text) print(full[8000:18000]) "
python3 -c " import pdfplumber with pdfplumber.open('/tmp/workspace/attachments/c313fd86-172a-46ea-a608-9eae04a2fdcc/Blood transfusion 1446-1.pdf') as pdf: all_text = [] for i, page in enumerate(pdf.pages): text = page.extract_text() if text and text.strip(): all_text.append(f'=== PAGE {i+1} ===\n{text.strip()}') full = '\n\n'.join(all_text) print(full[18000:]) "
📋 Lecture Summary: Blood Transfusion
Part 1 - Pre-Transfusion
1. Transfusion Consent
- Consent must be obtained by a physician before every transfusion
- The physician must: describe the product, explain risks/benefits/alternatives, allow questions, and document consent in the chart
- Transfusion without consent is only permitted when ALL three conditions exist:
- Urgent, life-saving transfusion needed AND
- Patient cannot consent AND no substitute decision-maker available AND
- No evidence of prior refusal (e.g. religious grounds)
2. Transfusion Orders
- Patient name + unique identifier
- Type of blood product
- Number of units / volume
- Rate of infusion
- Special requirements (e.g. irradiated, CMV-negative)
- Premedication or diuretic if required
- Non-urgent transfusions should be done during daytime hours for patient safety
3. Requesting Blood (from Blood Transfusion Laboratory - BTL)
- Patient name + unique identifier + location
- Product type, amount, and time needed
- Any special requirements, transfusion/pregnancy history, indication, ordering physician
4. Pre-Transfusion Sample
- ABO and Rh blood group (Type)
- Antibody screen (from prior transfusions or pregnancy)
- Crossmatch (compatibility testing with donor unit)
- Patient ID must be verified against armband before collecting - any discrepancy must be resolved first
5. Preparing the Patient
- Explain the procedure; address patient questions
- Ask about previous transfusion reactions - premedicate if needed:
- History of febrile reactions → antipyretic
- History of allergic reactions → antihistamine ± steroid
6. IV Access
| Blood Product | Patient Type | IV Gauge Needed |
|---|---|---|
| Red Blood Cells - rapid | Adults | 16-18G |
| Red Blood Cells - routine | Adults | 20-22G |
| Other blood products | All | Any adequate size |
| All products | Paediatrics | 22-25G |
| All products | Any | Central Venous Access Device (CVAD) |
- Transfusing rapidly through too small an IV can cause haemolysis
- IV line must be dedicated to the transfusion only
7. Blood Tubing
- All blood products (RBCs, platelets, plasma, cryoprecipitate) must use blood tubing with a filter
- Prime tubing with Normal Saline (0.9% NaCl) only - never dextrose/medications (causes haemolysis or clotting)
- Change tubing every 2-4 units or within hospital-specified hours (reduces bacterial sepsis risk)
- Platelets: use fresh tubing (they adhere to fibrin from previous RBCs)
- Plasma derivatives (IVIG, albumin): do not require blood tubing
Part 2 - The Transfusion Itself
8. Picking Up Blood
- Blood must be started within 30 minutes and completed within 4 hours of removal from proper storage
- Before picking up - confirm: IV patency, consent obtained, written order exists, premedication given
- Never store blood in unapproved fridges (medication fridges, ward fridges)
- Patient must wear an ID armband at all times
9. Checking Blood (CRITICAL STEP)
- Check patient armband (ask name + DOB)
- Confirm patient name + ID matches: armband → BTL label/tag
- Confirm blood unit number + donor blood group matches: CBS label → BTL label/tag
- Check expiry date and visually inspect for clots, unusual colour, leaks
- Verify transfusion order and consent
- Two qualified staff should complete the pre-transfusion check
- If any discrepancy → STOP - do not proceed - contact BTL immediately
10. The 5 Rights of Transfusion
Right Patient | Right Product | Right Amount | Right Rate | Right Time
11. Starting Blood
- Record baseline vital signs before each unit: temperature, BP, pulse, respiratory rate, O2 saturation
- First 15 minutes: start at a slow rate, monitor closely
- After 15 minutes: reassess and repeat vitals; increase to prescribed rate if no reaction
12. Monitoring
- Before transfusion (within 30 minutes prior)
- After first 15 minutes
- At prescribed intervals (per hospital policy)
- At end of each unit
- If any suspected reaction
- With each subsequent unit
13. Completing the Transfusion
- Complete each bag within 4 hours of removal from storage
- Flush tubing with normal saline when done
- Dispose of blood tubing and bags in biohazard container
- Continue assessing patient for up to 6 hours post-transfusion for delayed reactions
14. Documentation
- Date, start and finish times
- Type of product, blood unit number
- Names of persons checking and starting blood
- Vital signs and patient assessments
- Volume transfused
- Follow-up lab tests (CBC after RBCs; PT/INR after plasma; fibrinogen after cryoprecipitate)
- Any reactions and treatment given
Part 3 - Adverse Reactions
15. Three Main Reaction Categories
A. Haemolytic Reactions
- Cause: ABO blood type mismatch - almost always due to human error (wrong patient, mislabeled specimen, clerical error)
- Mechanism: Type II hypersensitivity - transfused RBCs attacked by recipient's antibodies → intravascular haemolysis
- Symptoms: Fever, chills, nausea, chest pain, lower back pain, pain/heat along the IV vein, tachycardia, hypotension, dark urine (haemoglobinuria), jaundice (hyperbilirubinaemia), "feeling of impending doom"
- In unconscious patients: uncontrollable bleeding (DIC) may be the only sign
- Prevention: Strict patient identification at every step
- Signs: Falling haematocrit days later, positive direct antiglobulin test (DAT/Coombs test)
- Often undetected because destruction is slow and extravascular
- Less dangerous than acute reaction
B. Sepsis (Bacterial Contamination)
- Blood is nutrient-rich → ideal for bacterial growth
- Risk increases with time outside proper storage
- Prevention: always check colour and for leaks; adhere strictly to the 4-hour rule
- Pathophysiology: Microbial proteins trigger pro-inflammatory host response → neutrophil activation → endothelial permeability → oedema → organ failure
- SIRS criteria: fever or hypothermia, tachycardia, hypotension, increased respiratory rate, abnormal WBC
- Severe: organ dysfunction (AKI, encephalopathy, thrombocytopenia)
- IV broad-spectrum antibiotics within 1 hour (after blood/urine cultures collected)
- Haemodynamic and pulmonary stabilisation
- Each hour of delay in antibiotics → 8% decrease in survival
C. Allergic Reactions
- Occur even with correct blood type
- Mild-moderate: hives and itching → treat with antihistamines
- Can range from mild to life-threatening anaphylaxis
16. Other Adverse Reactions (Summary Table)
| Reaction | Key Features | Cause | Management |
|---|---|---|---|
| Febrile Non-Haemolytic | Fever ≥1°C rise, chills | Cytokines reacting with leukocyte antigens | Antipyretics; most common (1 in 8 transfusions) |
| Volume Overload (TACO) | Fluid overload, dyspnoea | Too much/too fast; especially in elderly/cardiac | Infuse smaller volumes more slowly; diuretics |
| Hypotension (isolated) | BP drop ≥10 mmHg, no other symptoms | ACE inhibitors or leukoreduction filters | Stop transfusion; resolves quickly; if persists >30 min consider other diagnosis |
Part 4 - If a Reaction Is Suspected: STOP Protocol
- STOP the transfusion immediately
- Maintain IV access (do not flush blood tubing)
- Check vital signs
- Verify patient ID matches BTL label/tag
- Verify blood unit number matches BTL label/tag
- Remain with the patient
- Notify the BTL
- Seek medical attention; call Cardiac Arrest Team if cardiopulmonary collapse
- Do not discard the blood bag - needed for investigation
- Consult physician; medicate if ordered; reassess more frequently; remember the 4-hour limit
Quiz Answer Key (Assessment, Pages 47-57)
Key Numbers to Remember
| Parameter | Value |
|---|---|
| Max time blood can be out of storage | 4 hours |
| First monitoring check after starting | 15 minutes |
| Post-transfusion observation period | 6 hours |
| Change blood tubing frequency | Every 2-4 units |
| Antibiotic initiation in sepsis | Within 1 hour |
| Delay in antibiotics survival cost | 8% per hour |
What is a status epilepticus?and last update information
"status epilepticus"[MeSH Terms] AND "treatment"
status epilepticus management algorithm treatment timeline
Summary : This flowchart presents a treatment algorithm for the management and duration of P2Y12 inhibitor therapy in patients undergoing coronary artery bypass graft surgery (CABG), stratified by clinical scenario: stable ischemic heart disease (SIHD), status post (S/P) recent acute coronary syndrome (ACS), and S/P recent percutaneous coronary intervention (PCI). The chart uses color coding to indicate the class of recommendation for each scenario. flowchart: # Nodes : • CABG (diamond, top node) • SIHD (rectangle, left branch from CABG) • S/P Recent ACS (rectangle, middle branch from CABG) • S/P Recent PCI (rectangle, right branch from CABG) • 0 mo, 6 mo, 12 mo (blue rounded rectangles, vertical timeline on left) • Class IIb: 12 mo may be reasonable (clopidogrel) (yellow rectangle, under SIHD) • Class I: Resume P2Y12 inhibitor post-op to complete 12 mo of DAPT (green rectangle, under S/P Recent ACS) • Class I: Resume P2Y12 inhibitor post-op and continue for recommended duration of DAPT therapy after PCI* (green rectangle, under S/P Recent PCI) # Connectors : • Downward arrows from CABG to SIHD, S/P Recent ACS, and S/P Recent PCI. • Horizontal dashed line connects the three clinical scenario branches at the level of the colored recommendation boxes. • Vertical alignment of time points (0 mo, 6 mo, 12 mo) on the left, corresponding to the duration of therapy. # Layout : • Top-down hierarchical structure starting from CABG. • Three parallel branches for SIHD, S/P Recent ACS, and S/P Recent PCI. • Color-coded recommendation boxes (yellow for Class IIb, green for Class I) aligned horizontally. • Timeline (0, 6, 12 months) vertically on the left, indicating duration of therapy. # Analysis : • The flowchart visually distinguishes recommendations for P2Y12 inhibitor therapy after CABG based on clinical context. • For SIHD, a 12-month course of clopidogrel may be reasonable (Class IIb, yellow). • For S/P recent ACS, resumption of P2Y12 inhibitor post-operatively to complete 12 months of dual antiplatelet therapy (DAPT) is strongly recommended (Class I, green). • For S/P recent PCI, resumption and continuation of P2Y12 inhibitor for the recommended DAPT duration after PCI is also strongly recommended (Class I, green). • The timeline emphasizes the importance of therapy duration, with recommendations tailored to the underlying indication. • The color coding and class labels clarify the strength of each recommendation.
This medical infographic combines a clinical timeline with serial diagnostic imaging to illustrate the management of acute empyema secondary to Streptococcus pyogenes infection. The upper section features a timeline spanning from Day -14 to Day 28, detailing clinical events such as initial influenza diagnosis, recurrence of respiratory symptoms, and admission interventions. It outlines a treatment algorithm including thoracic drainage with intrapleural urokinase, antibiotic therapy (Ceftriaxone, Metronidazole, Clindamycin, Ampicillin, and Amoxicillin), and video-assisted thoracic debridement on Day 10. The lower section contains three sequential posterior-anterior (PA) chest X-rays. The initial X-ray shows a large left-sided pleural effusion with significant basal opacity and blunting of the costophrenic angle. Subsequent films demonstrate the clinical progression and resolution of the effusion following drainage and surgery, characterized by increasing aeration of the left lung field, reduction in opacity, and return of visible pulmonary vascular markings, reflecting successful therapeutic intervention and lung expansion.
Educational medical graphic presenting the clinical and neuroimaging progression of a patient with early-onset Alzheimer's disease (AD) and comorbid Lewy body disease. Section 'a' displays a clinical timeline from age 55 to 64, tracking MMSE/CDR scores and symptoms like memory loss, Parkinsonism, and death in status epilepticus. Section 'b' contains T1-weighted MRI scans in sagittal and coronal views, showing longitudinal brain atrophy over two years (ages 59 to 61); notable features include progressive widening of the cortical sulci and enlargement of the lateral ventricles (ventriculomegaly), indicating loss of cortical and subcortical volume. Section 'c' presents Florbetapir (AV45) PET scans quantifying amyloid plaque burden. Axial slices show a comparison before and after Aducanumab treatment, with Centiloid (CL) values decreasing from 60.5 to 51.5. This reduction in radiotracer uptake intensity suggests a decrease in cortical amyloid load despite the patient's continued clinical decline. The material is intended for advanced medical education in neurology and neuroradiology, illustrating the dissociation between biomarker reduction and clinical outcomes in complex neurodegenerative profiles.
PMID: 38606469
status epilepticus 2025 guidelines update definition treatment refractory
Status Epilepticus (SE)
Definition
Continuous seizure activity, OR recurrent seizures without return of consciousness between episodes.
Operational (Practical) Time Thresholds (Current 2025 Definition):
| Type of SE | Operational Threshold (treat now) | Long-term neuronal injury threshold |
|---|---|---|
| Convulsive SE (tonic-clonic) | ≥ 5 minutes | 30 minutes |
| Non-convulsive SE (no motor activity, EEG seizures) | ≥ 10 minutes | 60 minutes |
The old definition of 30 minutes has been replaced. 5 minutes is the clinical trigger to begin treatment - because seizures lasting >5 minutes are very unlikely to stop spontaneously and cause progressively worsening neuronal injury.
Types of Status Epilepticus
| Type | Key Feature | Clinical Appearance |
|---|---|---|
| Convulsive SE (CSE) | Tonic-clonic motor activity | Jerking of all limbs, unconscious, classic "grand mal" |
| Non-convulsive SE (NCSE) | EEG seizures, minimal motor activity | Confused, staring, subtle eye deviation/nystagmus - often missed! |
| Focal SE | One part of the body | Rhythmic jerking of one limb, may remain conscious |
| Refractory SE (RSE) | Fails first + second-line drugs | ~20% of all SE cases |
| Super-refractory SE (SRSE) | Continues >24h despite anaesthetic therapy | Rare, very high mortality |
Why Is It an Emergency? - Pathophysiology
Seizure continues beyond 5 minutes
↓
GABA receptors internalised (downregulate)
↓
Inhibitory mechanisms fail
↓
Excitatory (glutamate/NMDA) activity dominates
↓
Self-perpetuating seizure loop
↓
Neuronal hyperactivity → massive ATP consumption
↓
Hyperthermia, hypoxia, acidosis, hypoglycaemia
↓
NEURONAL INJURY AND DEATH
↓
Systemic: rhabdomyolysis, aspiration,
cardiovascular collapse, organ failure
Common Causes
| Category | Examples |
|---|---|
| Acute brain insult (most common) | Stroke, head trauma, CNS infection (meningitis/encephalitis), hypoxic brain injury |
| Autoimmune | Autoimmune encephalitis (most common cause in one major study) |
| Metabolic | Hypoglycaemia, hyponatraemia, hypocalcaemia, uraemia, hepatic failure |
| Drug toxicity / withdrawal | Alcohol withdrawal, benzodiazepine withdrawal, cocaine, isoniazid |
| Known epilepsy | Subtherapeutic antiseizure drug levels |
| Cryptogenic | ~50% of cases have no identifiable cause even after full workup |
Step-by-Step Management (Time-Anchored Protocol)
Simultaneous with all drug steps: ABCs
- Airway: Position patient, suction secretions, consider nasopharyngeal airway
- Breathing: Oxygen via face mask; bag-valve-mask if inadequate ventilation
- Circulation: IV/IO access, monitor HR, BP, RR, SpO₂
- Bloods: Glucose (immediately), electrolytes, Ca²⁺, Mg²⁺, LFTs, renal function, FBC, drug levels, urine toxicology
- Treat metabolic causes: Correct hypoglycaemia (dextrose IV), correct hyponatraemia, pyridoxine if isoniazid toxicity suspected
Phase 1 - Early SE (0-5 minutes): FIRST-LINE = Benzodiazepines
| Drug | Route | Dose | Notes |
|---|---|---|---|
| Lorazepam (Ativan) | IV | 0.1 mg/kg at 2 mg/min (typically 4 mg) | Drug of choice if IV access available |
| Midazolam (Versed) | IM | 10 mg IM | Preferred pre-hospital and when no IV - equally effective as IV lorazepam |
| Midazolam | Intranasal / Buccal | 0.3 mg/kg (max 10 mg) | When no IV access |
| Diazepam | IV / rectal | 5-10 mg IV bolus | Alternative |
Key 2025 update: Intramuscular midazolam 10 mg is more effective and at least as safe as IV lorazepam for pre-hospital SE. This is now strongly endorsed.
- Give second dose if seizure continues after 5 minutes
- Benzodiazepines can cause respiratory depression and hypotension - monitor closely
Phase 2 - Established SE (5-20 minutes): SECOND-LINE Agents
| Drug | Dose | Route | Notes / Cautions |
|---|---|---|---|
| Levetiracetam (Keppra) | 30-60 mg/kg (max 4.5 g) over 10 min | IV | Fewest drug interactions; safe in liver disease; first choice at many centres |
| Fosphenytoin | 15-20 mg/kg at 150 mg/min | IV/IM | Water-soluble phenytoin prodrug; less cardiotoxic than phenytoin; can give IM |
| Valproic acid (Depakote) | 30-40 mg/kg at 5 mg/kg/min | IV | Contraindicated in liver disease, thrombocytopenia, pregnancy, metabolic disease |
| Phenobarbital | 10 mg/kg at 100 mg/min | IV | Older agent; effective but causes sedation; still used especially in paediatrics |
Full doses are essential - underdosing is a common reason for second-line treatment failure.
Phase 3 - Refractory SE (20-40+ minutes): ICU / ANAESTHETIC AGENTS
- ICU admission
- Intubation and mechanical ventilation
- Continuous EEG (cEEG) monitoring to guide therapy
- Continuous IV anaesthetic infusions to achieve EEG burst-suppression
| Agent | Dose | Notes |
|---|---|---|
| Midazolam infusion | 0.1-0.4 mg/kg/hour | First-choice infusion in most centres |
| Propofol infusion | 1-3 mg/kg/hour | Rapid onset; risk of propofol infusion syndrome with prolonged use |
| Pentobarbital / Thiopental | 0.5-5 mg/kg/hour | Deepest sedation; causes hypotension |
| Ketamine infusion | ~2.2 mg/kg/hour | Emerging evidence for highly refractory cases - NMDA antagonist; less hypotension; 2024 meta-analysis supports use especially in paediatrics |
A 2024 JAMA Neurology systematic review (PMID 38466294) confirmed that continuous IV anaesthetic agents are effective for RSE but optimal choice and weaning strategies remain uncertain.
Phase 4 - Super-Refractory SE (>24h despite anaesthetic therapy)
- Ketogenic diet
- Immunotherapy (steroids, IVIg, plasma exchange) - especially if autoimmune aetiology
- Therapeutic hypothermia (NOT shown to be beneficial in standard SE)
- Surgical resection in selected cases (2024 systematic review PMID 38456595 shows surgery can be effective in highly selected patients)
Non-Convulsive SE (NCSE) - The "Silent Killer"
- Persistent confusion, obtundation, AMS
- Subtle eye deviation, nystagmus
- Subtle facial twitching
- No motor convulsions at all
Monitoring Requirements
| Parameter | Monitoring |
|---|---|
| Vital signs | Continuous HR, BP, SpO₂, RR |
| Glucose | Immediately and repeatedly |
| EEG | Continuous cEEG mandatory in refractory SE; all patients post-SE ideally |
| Temperature | Treat hyperthermia aggressively (worsens neuronal injury) |
| Imaging | CT/MRI head once stabilised to identify structural cause |
| Labs | Electrolytes, glucose, Ca, Mg, CBC, LFTs, renal function, drug levels |
Prognosis and Outcomes
| Factor | Impact |
|---|---|
| Duration | Longer SE = worse neurological outcome |
| Cause | Anoxic/hypoxic brain injury has worst prognosis; metabolic causes generally best |
| Age | Elderly have higher mortality |
| Refractory vs responsive | RSE mortality 20-40% |
| Time to first benzodiazepine | Single most important modifiable predictor of outcome |
Summary: The Time-Critical Escalation Ladder
0-5 min → BENZODIAZEPINE (IM midazolam or IV lorazepam) × 2 doses
↓ if still seizing
5-20 min → SECOND-LINE: Levetiracetam OR Fosphenytoin OR Valproate
(full loading dose - ESETT trial: all equally effective)
↓ if still seizing
20+ min → REFRACTORY SE: Intubate + ICU
Continuous IV anaesthetic (midazolam / propofol / pentobarbital)
Continuous EEG monitoring
↓ if >24h on anaesthetics
>24 hrs → SUPER-REFRACTORY SE: Specialist centre
Ketogenic diet / Immunotherapy / Hypothermia / Surgery
2024-2025 Updates at a Glance
| Update | Detail |
|---|---|
| Operational threshold | 5 min for convulsive SE (not 30 min) - now universally accepted |
| Pre-hospital treatment | IM midazolam = IV lorazepam in efficacy; simpler to give |
| Second-line agents | Levetiracetam, fosphenytoin, valproate all equivalent (ESETT trial confirmed) |
| Continuous EEG | Mandatory for all RSE patients; all post-SE patients who don't wake up |
| Ketamine | Growing evidence as adjunct in RSE; 2024 meta-analysis in paediatric SE (PMID 38881333) supports use |
| Surgery | May benefit highly selected super-refractory cases |
| Therapeutic hypothermia | NOT beneficial (do not use) |
| Autoimmune SE | Now recognised as most common cause in some series; early immunotherapy important |
| 2024 guideline review | A 2024 systematic review of 15 CPGs (PMID 38606469) found significant gaps in guidelines, particularly around established SE and super-refractory SE management |
adrenal gland anatomy
adrenal gland anatomy