
Definition, causes, precipitating factors, classification, pathogenesis, clinic feature, investigation, ecg changes from day 0 to 7, complications, management of myocardial infarction
- Definition and universal diagnostic criteria
- Causes, risk factors, and precipitating triggers
- Classification: STEMI, NSTEMI, and infarct territory
- Pathogenesis and coronary plaque rupture
- Clinical features and physical signs
- Investigations, including cardiac biomarkers and imaging
- Serial ECG evolution from day 0 to day 7
- Early and late complications
- Immediate management, reperfusion, and secondary prevention
Choose the section(s) for a detailed exam-focused note.
- Definition and universal diagnostic criteria
- Causes, risk factors, and precipitating triggers
- Classification: STEMI, NSTEMI, and infarct territory
- Pathogenesis and coronary plaque rupture
- Clinical features and physical signs
- Investigations, including cardiac biomarkers and imaging
- Serial ECG evolution from day 0 to day 7
- Early and late complications
- Immediate management, reperfusion, and secondary prevention
- Basics: definition, causes, risk factors, classification, pathogenesis
- Clinical features and investigations
- Serial ECG changes from day 0 to day 7
- Complications
- Management of STEMI and NSTEMI
1
"myocardial infarction" AND pathogenesis
Fourth Universal Definition myocardial infarction type 1 pathogenesis plaque rupture definition
1. Basics of Myocardial Infarction
Definition
- A rise and/or fall in cardiac troponin, with at least one value above the 99th-percentile upper reference limit, and
- Evidence of acute myocardial ischemia, such as ischemic symptoms, new ischemic ECG changes, pathological Q waves, imaging evidence of new loss of viable myocardium/regional wall-motion abnormality, or demonstration of coronary thrombus.
Causes
A. Most common cause: Type 1 MI
Vulnerable atherosclerotic plaque rupture or erosion → platelet activation and aggregation → thrombus formation ± coronary vasospasm → abrupt reduction/cessation of coronary blood flow → ischemia → irreversible myocardial necrosis.
Robbins, Cotran & Kumar Pathologic Basis of Disease, p. 509-510.
B. Other causes of MI
-
Coronary vasospasm
- Prinzmetal vasospasm
- Cocaine or amphetamine use
- Severe adrenergic stress
-
Coronary embolism
- Atrial fibrillation with embolus
- Infective endocarditis vegetation
- Prosthetic valve thrombus
- Paradoxical embolus
-
Spontaneous coronary artery dissection (SCAD)
- More frequent in younger women, pregnancy/postpartum states, or fibromuscular dysplasia.
-
Coronary arteritis/vasculitis
- Kawasaki disease
- Polyarteritis nodosa
- Takayasu arteritis
- SLE-associated vasculopathy
-
Coronary trauma or iatrogenic obstruction
- Coronary intervention, surgery, or catheter-related complications.
-
Type 2 MI: oxygen supply-demand mismatch
- Severe anemia
- Hypoxemia/respiratory failure
- Hypotension or shock
- Sepsis
- Tachyarrhythmia or severe bradyarrhythmia
- Hypertensive crisis
- Severe aortic stenosis or hypertrophic cardiomyopathy.
Risk Factors
Non-modifiable
- Increasing age
- Male sex
- Family history of premature coronary artery disease
- Genetic predisposition, including familial hypercholesterolemia
- Postmenopausal state in women
Modifiable major risk factors
- Dyslipidemia, especially raised LDL cholesterol
- Hypertension
- Cigarette smoking/tobacco exposure
- Diabetes mellitus
- Obesity, especially central obesity
- Physical inactivity
- Unhealthy diet
- Chronic inflammatory states
- Chronic kidney disease
- Psychosocial stress
- Excess alcohol use
- Cocaine and amphetamine use
Robbins, Cotran & Kumar Pathologic Basis of Disease, p. 497-498.
Precipitating Factors
- Heavy or unusual physical exertion
- Acute emotional stress, anger, anxiety, grief
- Early morning sympathetic surge
- Heavy meal
- Exposure to cold weather
- Sexual activity
- Acute infection, fever, or sepsis
- Acute blood loss or severe anemia
- Hypoxia
- Severe hypertension
- Tachyarrhythmia
- Cocaine, amphetamines, or sympathomimetic drugs
- Surgery or major trauma
- A risk factor predisposes to coronary artery disease over years.
- A precipitating factor triggers an acute event over minutes to hours.
Classification of Myocardial Infarction
A. Universal Definition: etiological classification
| Type | Name | Mechanism |
|---|---|---|
| Type 1 | Spontaneous MI | Atherosclerotic plaque rupture, erosion, fissure, dissection, or intraplaque hemorrhage with coronary thrombosis |
| Type 2 | MI due to ischemic imbalance | Mismatch between myocardial oxygen supply and demand without acute atherothrombotic plaque rupture |
| Type 3 | MI resulting in death before biomarker confirmation | Sudden cardiac death with ischemic symptoms/ECG evidence before troponin can be measured or rise |
| Type 4a | PCI-related MI | MI associated with percutaneous coronary intervention |
| Type 4b | Stent thrombosis-related MI | MI due to definite stent thrombosis |
| Type 4c | Restenosis-related MI | MI due to in-stent restenosis |
| Type 5 | CABG-related MI | MI associated with coronary artery bypass graft surgery |
B. ECG-based clinical classification
-
ST-elevation myocardial infarction (STEMI)
- Usually due to acute, persistent, complete coronary occlusion.
- Typically produces transmural ischemia/infarction.
- Requires immediate reperfusion therapy.
-
Non-ST-elevation myocardial infarction (NSTEMI)
- Usually due to partial, intermittent, or transient coronary occlusion.
- Often produces subendocardial infarction.
- ECG may show ST depression, T-wave inversion, or occasionally be initially normal.
C. Pathological classification
-
Transmural infarction
- Necrosis involves the full thickness of ventricular wall.
- Generally follows complete and persistent epicardial coronary occlusion.
- Often associated with STEMI and pathological Q waves.
-
Subendocardial infarction
- Necrosis limited to the inner one-third to one-half of ventricular wall.
- May result from partial coronary obstruction or global hypoperfusion.
- Usually associated with NSTEMI.
Robbins & Kumar Basic Pathology, p. 318-321.
Pathogenesis of Type 1 MI
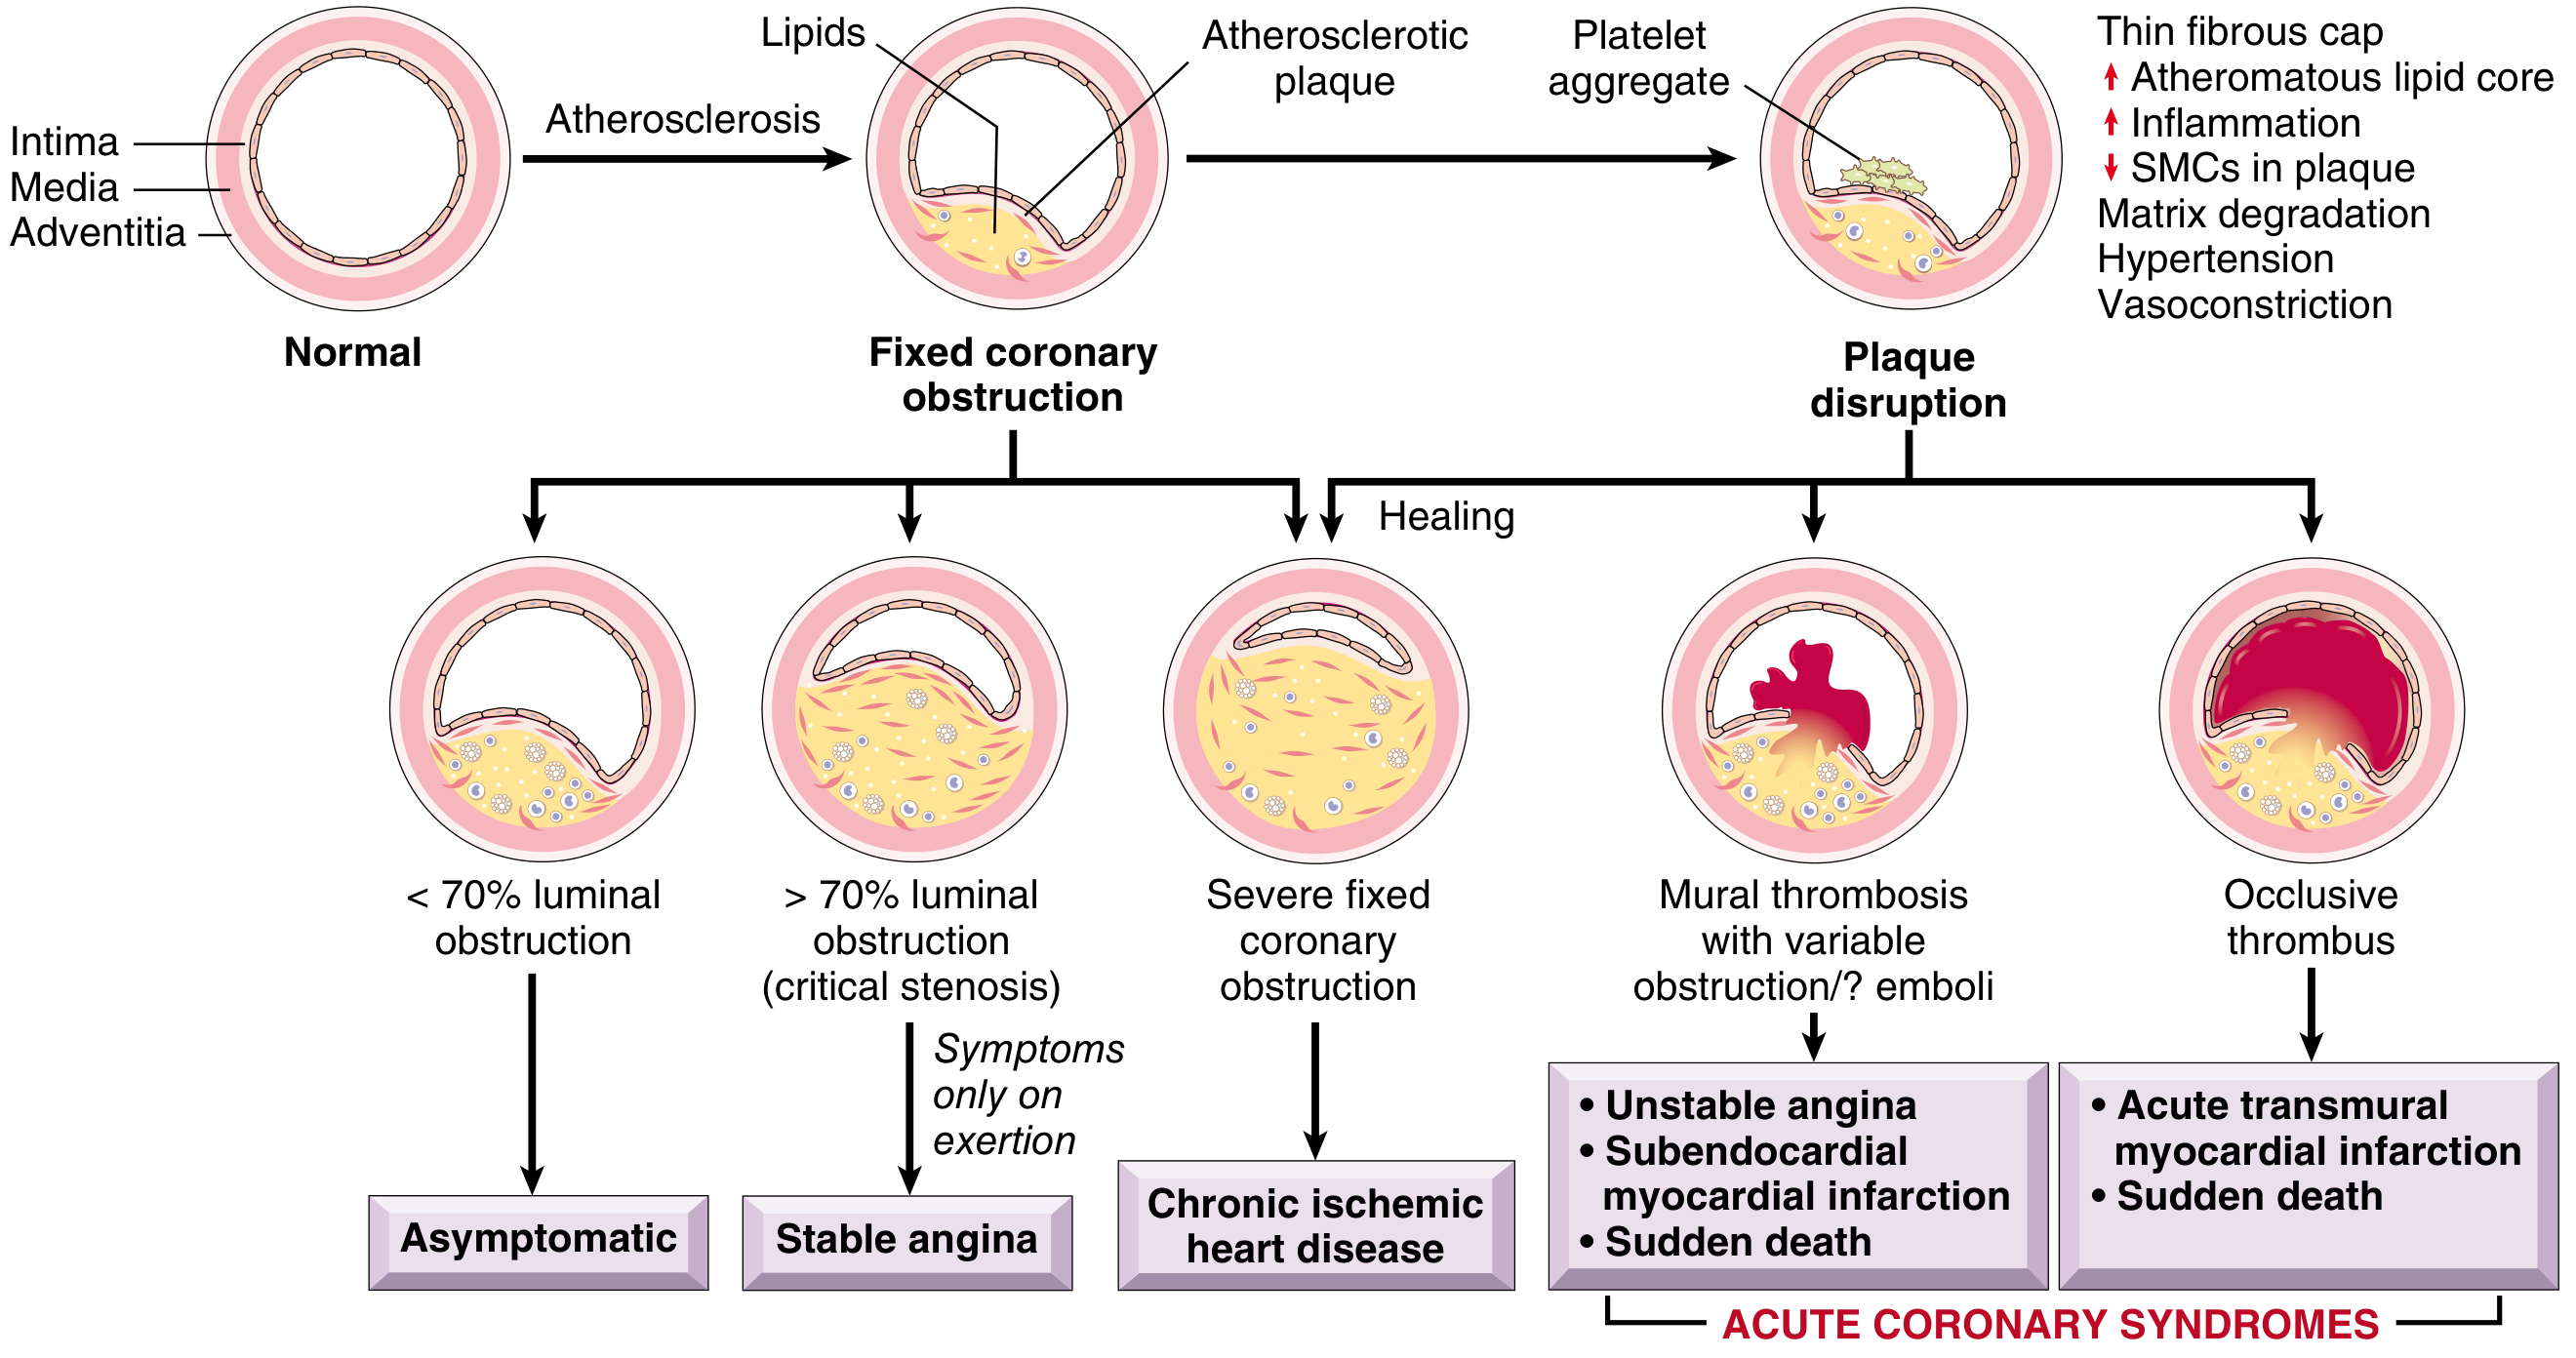
Stepwise mechanism
-
Atherosclerosis develops
- Endothelial dysfunction permits LDL entry into the intima.
- LDL oxidation promotes inflammation.
- Macrophages ingest lipid and become foam cells.
- Atherosclerotic plaque forms, with lipid core and fibrous cap.
-
A vulnerable plaque develops
- Large lipid-rich necrotic core
- Thin fibrous cap
- High macrophage/inflammatory-cell content
- Low smooth-muscle-cell and collagen content
-
Plaque disruption occurs
- Rupture, erosion, fissuring, ulceration, or intraplaque hemorrhage.
- Mechanical stress, raised blood pressure, platelet reactivity, and inflammation promote disruption.
-
Thrombosis forms
- Exposure of collagen, tissue factor, and thrombogenic lipid material causes platelet adhesion, activation, and aggregation.
- Coagulation cascade produces fibrin-rich thrombus.
- Vasoconstrictors from platelets can worsen coronary spasm.
-
Coronary blood flow falls abruptly
- Complete occlusion commonly results in STEMI and transmural necrosis.
- Partial/transient occlusion commonly causes NSTEMI and subendocardial necrosis.
-
Myocardial ischemia becomes irreversible
- ATP declines and anaerobic metabolism causes lactate accumulation.
- Contractility decreases within seconds to minutes.
- Irreversible myocyte injury begins after approximately 20-30 minutes of severe ischemia.
- Necrosis progresses from the subendocardium outward, becoming transmural over several hours if flow is not restored.
Robbins, Cotran & Kumar Pathologic Basis of Disease, p. 509-511.
Short exam flowchart
→ Vulnerable plaque with thin fibrous cap
→ Rupture/erosion
→ Platelet activation + thrombus + vasospasm
→ Coronary occlusion
→ Acute myocardial ischemia
→ Myocyte necrosis (MI)
Key one-line answer
Myocardial infarction usually occurs when rupture or erosion of a vulnerable coronary atherosclerotic plaque causes platelet-rich thrombus formation, acute coronary occlusion, prolonged ischemia, and irreversible myocardial necrosis.
Explain the clinical features and physical signs of MI
"myocardial infarction" AND clinical presentation
acute myocardial infarction symptoms signs physical examination clinical presentation guideline
Clinical Features of Acute Myocardial Infarction
1. Chest pain or discomfort
- Site: Retrosternal, precordial, or left-sided chest.
- Character: Heavy, crushing, constricting, squeezing, tightness, pressure, burning, or “weight on the chest.”
- Radiation: Left shoulder and medial aspect of left arm, both arms, neck, throat, jaw, epigastrium, interscapular area, or occasionally right arm.
- Duration: Usually more than 20-30 minutes, often hours.
- Onset: May occur at rest, during sleep, or with minimal exertion. It commonly builds up over several minutes.
- Response to rest/nitrates: Typically not fully relieved by rest or sublingual nitroglycerin, unlike stable angina.
Harrison’s Principles of Internal Medicine, 22e, p. 2149-2150.
2. Associated symptoms
- Dyspnea due to LV dysfunction, pulmonary congestion, or anxiety
- Sweating: cold, clammy diaphoresis
- Nausea and vomiting, especially with inferior-wall MI due to vagal stimulation
- Palpitations due to arrhythmia
- Weakness, fatigue, dizziness, or light-headedness
- Syncope or presyncope, particularly with arrhythmia, severe bradycardia, or cardiogenic shock
- Anxiety, agitation, or a sense of impending death
- Epigastric discomfort, indigestion, or abdominal discomfort, particularly in inferior MI
Atypical and Silent Presentation
- Older adults
- Women
- People with diabetes mellitus, due to autonomic neuropathy
- Chronic kidney disease
- Dementia or frailty
- Postoperative or critically ill patients
- Sudden unexplained dyspnea
- Isolated nausea/vomiting or epigastric pain
- Weakness, unusual fatigue, or collapse
- Syncope
- Confusion or acute delirium in elderly patients
- Palpitations
- Silent MI detected only by ECG, troponin, or imaging
Harrison’s Principles of Internal Medicine, 22e, p. 2150.
Physical Signs of MI
1. General appearance
- Patient may look ill, anxious, pale, and sweaty
- Often lies still because movement aggravates the discomfort
- Cool, clammy extremities due to sympathetic activation and poor peripheral perfusion
- Restlessness may be prominent in severe pain or shock
2. Pulse and blood pressure
Pulse
- Sinus tachycardia is common from pain, anxiety, sympathetic discharge, fever, or heart failure.
- Bradycardia may occur in inferior-wall MI due to increased vagal tone or AV nodal ischemia.
- Irregular pulse suggests arrhythmias such as atrial fibrillation, ventricular ectopics, ventricular tachycardia, or conduction block.
Blood pressure
- May be normal initially.
- Hypertension can occur early because of pain and sympathetic stimulation.
- Hypotension suggests:
- Large LV infarction with pump failure
- Right ventricular infarction
- Bradyarrhythmia/tachyarrhythmia
- Mechanical complication
- Cardiogenic shock
3. Precordial examination and heart sounds
- S4 gallop: Due to reduced LV compliance and ischemic ventricular stiffness. It may be heard early if the patient is in sinus rhythm.
- S3 gallop: Suggests LV failure, significant LV dysfunction, or a large infarction.
- Soft heart sounds: May occur in low-output states.
- New systolic murmur:
- Apical pansystolic murmur radiating to axilla suggests acute mitral regurgitation, often from papillary muscle ischemia/dysfunction or rupture.
- Harsh pansystolic murmur at lower left sternal border suggests ventricular septal rupture.
- Pericardial friction rub: May develop 1-3 days after transmural MI because of acute fibrinous pericarditis.
4. Respiratory signs
- Tachypnea
- Basal fine crepitations/rales
- Reduced oxygen saturation
- Wheeze, sometimes called cardiac asthma
- Pulmonary edema: diffuse crepitations, severe dyspnea, pink frothy sputum in advanced cases
5. Signs of cardiogenic shock
- Cold, mottled, clammy extremities
- Marked hypotension
- Tachycardia, unless bradyarrhythmia is the cause
- Weak, thready pulse
- Oliguria
- Altered sensorium, confusion, or drowsiness
- Peripheral cyanosis
- Elevated JVP may occur, particularly in right ventricular infarction or biventricular failure
6. Signs suggestive of right ventricular infarction
- Hypotension
- Raised JVP
- Clear lung fields, unless there is concurrent LV failure
- Kussmaul sign may be present
Exam-oriented Summary Table
| Domain | Typical findings |
|---|---|
| Pain | Severe, prolonged retrosternal pressure/heaviness, often >20-30 min |
| Radiation | Left arm/shoulder, neck, jaw, epigastrium, back, sometimes right arm |
| Associated symptoms | Sweating, dyspnea, nausea/vomiting, palpitations, weakness, syncope, anxiety |
| General signs | Pallor, cold clammy sweating, distress, restlessness |
| Pulse | Tachycardia, bradycardia in inferior MI, irregular if arrhythmia |
| BP | May be high early; low BP suggests large MI, RV MI, or shock |
| Heart sounds | S4, S3 if LV failure, soft sounds |
| Murmurs | Acute MR or ventricular septal rupture |
| Lungs | Basal crepitations or pulmonary edema in LV failure |
| Shock | Cold extremities, hypotension, oliguria, confusion, cyanosis |
One-line answer
Acute MI usually presents with severe prolonged retrosternal pressure radiating to the left arm, shoulder, neck, jaw, or epigastrium, associated with sweating, dyspnea, nausea, vomiting, anxiety, and palpitations; examination may show pallor, diaphoresis, tachycardia or bradycardia, S4/S3 gallop, basal crepitations, hypotension, murmurs of mechanical complications, or signs of cardiogenic shock.
Explain the serial ECG changes from day 0 to day 7
serial ECG changes acute ST elevation myocardial infarction hyperacute T wave ST elevation pathological Q wave T wave inversion diagram
"myocardial infarction" AND electrocardiography
serial ECG changes acute myocardial infarction hyperacute T waves ST elevation Q wave T inversion guideline
https://pmc.ncbi.nlm.nih.gov/articles/PMC6932613/
Serial ECG Changes in Acute STEMI: Day 0 to Day 7
Sequence to remember
Hyperacute T wave → ST elevation → pathological Q wave → T-wave inversion → ST returns to baseline, Q wave may persist
| Time after coronary occlusion | ECG changes | Interpretation |
|---|---|---|
| Day 0: minutes to hours | Hyperacute T waves: tall, broad-based, symmetrical T waves in leads facing the infarct | Earliest sign of acute transmural ischemia |
| Hours, Day 0 | ST-segment elevation in contiguous leads, often convex upward or “tombstone” pattern; reciprocal ST depression may appear in opposite leads | Acute myocardial injury, typically from coronary occlusion |
| 6-24 hours, Day 1 | ST elevation persists; R-wave amplitude may decrease; pathological Q waves may begin | Evolving myocardial necrosis |
| Day 1-2 | Q waves become more prominent; ST elevation starts declining; T waves may become flattened then inverted | Established infarction with evolving reperfusion/repolarization changes |
| Day 2-3 | Deep symmetrical T-wave inversion; ST segment continues toward baseline; pathological Q waves are established | Evolving infarction |
| Day 3-5 | ST segment usually returns close to/isoelectric baseline; T-wave inversion persists; Q waves remain | Evolved infarction |
| Day 5-7 | ST segment usually isoelectric; deep inverted T waves and pathological Q waves persist | Recent/evolving infarction |
| Weeks to months | T waves may gradually become upright; Q waves may persist permanently | Old infarction, if Q waves remain |
1. Hyperacute T Waves
- Tall
- Broad-based
- Symmetrical
- Often seen in leads overlying the infarct area
- Not simply “peaked” as in hyperkalemia
2. ST-Segment Elevation
- ST elevation in two or more anatomically contiguous leads
- May become convex or merge with the T wave to form a “tombstone” appearance.
- Reflects acute myocardial injury.
Reciprocal ST depression
| Infarct location | ST elevation | Reciprocal ST depression often seen in |
|---|---|---|
| Inferior MI | II, III, aVF | I, aVL |
| High lateral MI | I, aVL, V5-V6 | III, aVF |
| Anterior MI | V1-V4 | Inferior leads may show reciprocal changes |
| Posterior MI | ST depression V1-V3, tall R waves, upright T waves | This is the reciprocal image of posterior ST elevation |
3. Pathological Q Waves
- Q wave duration ≥ 0.04 second, and/or
- Q-wave depth at least 25% of the following R wave in relevant leads.
4. T-Wave Inversion
- Symmetrical, often deep T-wave inversion
- Usually persists for days to weeks
- May gradually normalize over weeks or months
Important Exception: Persistent ST Elevation
- Persistent coronary occlusion or reinfarction
- Pericarditis
- Left ventricular aneurysm, especially after a large anterior MI
STEMI Versus NSTEMI
NSTEMI ECG
- ST-segment depression
- T-wave inversion
- Transient ST elevation that resolves
- A normal ECG initially
Short Exam Answer
In acute STEMI, the earliest ECG change is a tall, broad-based hyperacute T wave. This is followed within minutes to hours by ST-segment elevation in contiguous leads with reciprocal ST depression in opposite leads. Within hours to 1 day, R-wave loss and pathological Q waves develop. Over the next 1-3 days, ST elevation gradually regresses and T waves invert. By day 5-7, the ST segment usually returns to baseline, while deep T-wave inversion and pathological Q waves persist. Q waves may remain permanently, whereas T-wave inversion may resolve over weeks to months.