1. Clinical case: Myocardial infarction Long answer for mbbs exam
Myocardial Infarction - Long Answer for MBBS Exam
Definition
- Robbins & Kumar Basic Pathology, p. 318
Epidemiology
- Most common cause of death in adults worldwide
- Frequency rises progressively with age and increasing risk factors for atherosclerosis
- ~10% of MIs occur before age 40; ~45% occur before age 65
- Men are at greater risk than women, but the gap narrows with age
- Women are relatively protected during reproductive years; menopause (declining estrogen) exacerbates risk
- IHD is the most common cause of death in older adult women
- Robbins & Kumar Basic Pathology, p. 318
Etiology and Risk Factors
- Age (male >45 yrs, female >55 yrs)
- Male sex
- Family history of premature coronary artery disease
- Genetic predisposition
- Hypertension
- Hyperlipidemia (raised LDL, low HDL)
- Diabetes mellitus
- Cigarette smoking
- Obesity
- Sedentary lifestyle
- Stress
- Coronary artery vasospasm
- Embolism from mural thrombi (e.g., in atrial fibrillation) or valve vegetations
- Vasculitis, amyloid deposition, sickle cell disease (small intramyocardial arterioles)
- Cocaine use (vasospasm via catecholamine excess)
- Robbins & Kumar Basic Pathology, p. 318-319
Pathogenesis
Sequence of Events in a Typical MI
- Plaque disruption: An atheromatous plaque is eroded or suddenly disrupted by endothelial injury, intraplaque hemorrhage, or mechanical forces - exposing subendothelial collagen and necrotic plaque contents to blood.
- Platelet activation: Platelets adhere, aggregate, and are activated, releasing thromboxane A₂, ADP, and serotonin - causing further platelet aggregation and vasospasm.
- Coagulation cascade activation: Exposure of tissue factor adds to the growing thrombus.
- Complete occlusion: Within minutes, the enlarging thrombus may completely occlude the coronary artery lumen.
- Robbins & Kumar Basic Pathology, p. 318-319
Myocardial Response to Ischemia
- Within seconds: aerobic metabolism ceases → ATP drops → lactate accumulates → loss of contractility
- At 20-40 minutes: irreversible damage and coagulative necrosis of myocytes begins
- Earliest detectable feature: disruption of sarcolemmal membrane integrity → intracellular macromolecules leak out (basis for cardiac biomarkers)
- Necrosis begins in the subendocardial zone (most vulnerable - last to receive blood, highest intramural pressure)
- A "wavefront" of cell death progresses outward
- Without intervention: an infarct achieves full extent in 3 to 6 hours
- Robbins & Kumar Basic Pathology, p. 318
Patterns of Infarction
By Location of Coronary Occlusion
| Vessel | Frequency | Territory Infarcted |
|---|---|---|
| LAD (Left Anterior Descending) | 40-50% | Anterior LV wall, anterior 2/3 of interventricular septum, apex |
| RCA (Right Coronary Artery) | 30-40% | Right ventricle, inferior/posterior LV wall |
| LCX (Left Circumflex) | 15-20% | Lateral left ventricle |
- Robbins & Kumar Basic Pathology, p. 319
By Depth of Involvement
| Type | Description | ECG |
|---|---|---|
| Transmural (STEMI) | Full wall thickness, due to complete occlusion | ST elevation, Q waves |
| Subendocardial (NSTEMI) | Inner 1/3 of myocardium; thrombus lysed before transmural progression | ST depression/T-wave changes, no Q waves |
| Microscopic infarcts | Small vessel occlusion (vasculitis, emboli, spasm) | No diagnostic ECG changes |
Morphological Changes (Gross and Microscopic)
| Time | Gross Appearance | Microscopic Appearance |
|---|---|---|
| 0-12 hrs | Usually not visible grossly (TTC stain: pale unstained area) | Wavy myofibers; stretched, elongated cells; edema between fibers |
| 12-24 hrs | Mottled, pale area | Coagulative necrosis with loss of nuclei and striations; pyknotic nuclei |
| 1-3 days | Pale/yellow, soft | Dense neutrophilic infiltrate (acute inflammation) |
| 3-7 days | Yellow-tan, soft center | Macrophages begin phagocytosing necrotic debris |
| 7-10 days | Yellow-tan, maximal softening | Macrophages dominate - nearly complete removal of necrotic myocytes |
| 10-14 days | Red-grey rim (granulation tissue) | Granulation tissue: loose connective tissue with abundant new capillaries |
| 2-8 weeks | Grey-white scar forming | Collagen deposition, progressive fibrosis |
| >2 months | Dense white fibrous scar | Dense collagenous scar - complete; few residual cardiac muscle cells remain |
- Key stain: Masson trichrome stains collagen blue in healed infarcts
- TTC (triphenyl tetrazolium chloride) stain: normal myocardium stains red (lactate dehydrogenase present); infarcted area fails to stain (LDH leaks out)
- Robbins & Kumar Basic Pathology, p. 319-320; Fig. 9.11
Reperfused Infarcts (Special Morphology)
- Gross: hemorrhagic (due to vascular injury and leakiness)
- Microscopic: contraction band necrosis - intense eosinophilic bands of hypercontracted sarcomeres due to massive calcium influx; sarcomeres fixed in agonal tetanic state without ATP to relax
- Robbins & Kumar Basic Pathology, p. 358
Clinical Features
Symptoms
- Classic: Severe, crushing substernal chest pain (or pressure) radiating to neck, jaw, epigastrium, or left arm
- Pain lasts several minutes to hours; not relieved by nitroglycerin or rest (unlike angina)
- Diaphoresis (sweating), nausea/vomiting (especially with inferior/posterior wall MIs)
- Dyspnea: from impaired contractility and mitral valve dysfunction → pulmonary edema
- Weakness, lightheadedness
Silent MI (25% of cases)
- Common in diabetes (autonomic neuropathy blunts pain perception) and in elderly
- May present only as new onset heart failure or arrhythmia
Atypical presentations
- Women, elderly, diabetics, postoperative patients: may present with confusion, unexplained hypotension, or HF without typical chest pain
- Robbins & Kumar Basic Pathology, p. 323; Washington Manual, p. 146
Signs
- Pulse: rapid and weak (tachycardia, may be irregular)
- BP: may be elevated initially, hypotension in cardiogenic shock
- S3 or S4 gallop
- Pericardial friction rub (pericarditis, day 2-3)
- New systolic murmur (papillary muscle rupture → MR; or VSD)
- Elevated JVP + hypotension + absent pulmonary congestion = right ventricular MI (Kussmaul's sign)
- Signs of cardiogenic shock with massive MI (>40% LV involvement)
- Washington Manual, p. 146-147
ECG Changes
Hyperacute (Minutes - Hours)
- Tall peaked (hyperacute) T waves - first ECG manifestation of myocardial injury
Acute (Hours - Days)
- ST elevation (≥2 mm in V2-V3 in men >40 yrs, ≥1 mm in other leads)
- Elevation caused by 3 mechanisms (Ganong's):
- Rapid repolarization of infarcted fibers (current flows out of infarct)
- Decreased resting membrane potential (TQ depression recorded as ST elevation)
- Delayed depolarization (infarcted area remains positive relative to healthy tissue)
Evolving (Days)
- Q waves appear (electrically silent scar - "negative" relative to surrounding myocardium)
- T-wave inversion
Anatomical Localization by ST Elevation
| ST Elevation in | Myocardial Territory | Coronary Artery |
|---|---|---|
| V1-V4 | Anterior | LAD |
| V5-V6, I, aVL | Lateral | LCX |
| II, III, aVF | Inferior | RCA |
| V7-V9 (posterior leads) | Posterior | LCX or RCA |
| V3R-V4R (right-sided) | Right ventricle | Proximal RCA |
- New LBBB suggests large anterior wall MI (worse prognosis)
- Reciprocal ST depression in opposite leads increases specificity
- Ganong's Review of Medical Physiology, p. 534; Washington Manual, p. 148-149
Laboratory Investigations
Cardiac Biomarkers
| Biomarker | Rises | Peaks | Returns to Normal | Notes |
|---|---|---|---|---|
| Troponin I / T | 3-4 hrs | 24-48 hrs | 7-14 days | Most sensitive and specific; gold standard |
| CK-MB | 4-6 hrs | 24 hrs | 48-72 hrs | Useful for re-infarction detection |
| Myoglobin | 1-2 hrs | 4-8 hrs | 24 hrs | First to rise but not cardiac-specific |
| LDH1 | 24-48 hrs | 3-5 days | 10-14 days | LDH1 > LDH2 (flipped ratio) |
- Troponins have highest specificity and sensitivity for myocardial damage
- Robbins & Kumar Basic Pathology, p. 323
Other Investigations
- CBC: Leukocytosis (neutrophilia) within hours of MI - inflammatory response
- ESR: Elevated after 24-48 hours
- Blood glucose: Hyperglycemia (stress response)
- Lipid profile
- Coagulation profile
- Chest X-ray: Pulmonary edema, cardiomegaly; assess for aortic dissection (normal mediastinal width does NOT exclude dissection)
- Echocardiography: Regional wall motion abnormalities, LV function, mechanical complications (MR, VSD, tamponade)
- Coronary angiography: Definitive - identifies culprit lesion for PCI
Diagnosis
Universal Definition of MI (4th, 2018):
STEMI vs NSTEMI
| Feature | STEMI | NSTEMI |
|---|---|---|
| ECG | ST elevation, evolving Q waves | ST depression, T-wave inversion |
| Pathology | Complete occlusion, transmural | Partial/transient occlusion, subendocardial |
| Troponin | Elevated | Elevated |
| Management | Emergency reperfusion (PCI/thrombolysis) | Anticoagulation, risk-stratified PCI |
Treatment
General Principles - "Time is Myocardium"
Immediate Management (MONA → BATMAN protocol)
- O₂: Administer if SaO₂ <90%
- IV access, cardiac monitor, pulse oximetry
- 12-lead ECG within 10 minutes
- Serial ECGs if ongoing symptoms without initial ST elevation
| Drug | Dose | Rationale |
|---|---|---|
| Aspirin (ASA) | 325 mg loading (chewed) | Antiplatelet - COX-1 inhibition |
| P2Y₁₂ inhibitor (Clopidogrel/Ticagrelor/Prasugrel) | 300-600 mg loading | Dual antiplatelet therapy |
| Anticoagulant (UFH/LMWH) | Weight-based dosing | Prevent thrombus propagation |
| Nitroglycerin | 0.4 mg SL q5min x3 | Pain relief, vasodilation (avoid in RV MI/hypotension) |
| Morphine | 2-4 mg IV | Analgesia, anxiolysis (use cautiously) |
| Beta-blocker | Metoprolol 25-50 mg oral | Reduce myocardial O₂ demand; reduce arrhythmias |
| ACE inhibitor/ARB | Start within 24 hours | Reduce LV remodeling |
| Statin | High-intensity (Atorvastatin 80 mg) | Plaque stabilization, mortality benefit |
Reperfusion Therapy
Primary PCI (preferred if available within 90 minutes of first medical contact)
- Gold standard for STEMI
- PCI is superior to thrombolysis when applied early and rapidly
- Achieves TIMI 3 flow in >90% of cases
- Rosen's Emergency Medicine
Thrombolysis (if primary PCI not available within 120 minutes)
- Agents: Streptokinase, Alteplase (tPA), Reteplase, Tenecteplase
- Most effective when given within 12 hours of symptom onset (ideally <3 hours)
- Target: door-to-needle time ≤30 minutes
- After thrombolysis, transfer to PCI-capable center
- Prior intracranial hemorrhage
- Ischemic stroke within 3 months
- Active internal bleeding
- Suspected aortic dissection
- Significant closed head/facial trauma within 3 months
- Schwartz's Principles of Surgery
Surgical (CABG)
- For multivessel disease, left main disease, or failed PCI
Complications
Early Complications (hours to days)
| Complication | Mechanism | Features |
|---|---|---|
| Arrhythmias | Electrical instability of ischemic myocardium | Most common cause of pre-hospital death; VF accounts for 80-90% of MI-related deaths out of hospital |
| Cardiogenic shock | >40% LV destruction | Hypotension, tachycardia, cold clammy skin, oliguria |
| Acute LVF/Pulmonary edema | LV dysfunction | Dyspnea, pink frothy sputum, crepitations |
| Right ventricular infarction | Proximal RCA occlusion | Hypotension + elevated JVP + clear lungs (Kussmaul's sign) |
| Pericarditis | Epicardial inflammation | Pleuritic chest pain, friction rub, day 2-3 |
Mechanical Complications (days 3-7)
| Complication | Mechanism | Features |
|---|---|---|
| Free wall rupture | Softening at 3-5 days | Acute hemopericardium, tamponade, sudden death; common with lateral wall MI |
| Ventricular septal defect (VSD) | Septal infarct rupture | New harsh pansystolic murmur, acute heart failure |
| Papillary muscle rupture | Infarction of papillary muscle (usually posteromedial) | Acute severe mitral regurgitation, flash pulmonary edema |
| Ventricular aneurysm | Weak scar bulges outward | Persistent ST elevation, HF, mural thrombus, VT |
Late Complications (weeks to months)
- Dressler's syndrome (post-MI pericarditis): 2-10 weeks after MI; autoimmune; fever, pericarditis, pleuritis, elevated ESR
- Mural thrombus: Over akinetic/aneurysmal area → systemic embolism
- Chronic heart failure: LV remodeling, dilation
- Progressive arrhythmias
Reperfusion Injury
- Mitochondrial dysfunction: Altered membrane permeability → swelling → rupture → apoptosis
- Myocyte hypercontracture: Calcium overload → cytoskeletal contraction → cell death
- Free radical injury: Superoxide (O₂⁻), H₂O₂, hydroxyl radicals (produced within minutes of reperfusion)
- "No-reflow" phenomenon: Leukocyte aggregation in microvasculature blocks flow; phospholipase A₂ → arachidonic acid metabolites; complement activation
- Robbins & Kumar Basic Pathology, p. 357-358
Stunned vs. Hibernating Myocardium
- Stunned myocardium: Transient but reversible cardiac dysfunction after brief ischemia/reperfusion (even timely reperfusion); recovers over days
- Hibernating myocardium: Chronically underperfused but viable myocardium with reduced contractility; improves with revascularization
Prognosis and Risk Stratification
- TIMI Risk Score used to stratify NSTEMI/UA patients
- Anterior STEMI carries worse prognosis than inferior
- New LBBB = large anterior MI = worst prognosis
- LVEF is the single most important prognostic determinant post-MI
- Mortality is substantially reduced by:
- Timely reperfusion
- Aspirin + P2Y₁₂ inhibitor
- Beta-blocker
- ACE inhibitor
- High-intensity statin
- Cardiac rehabilitation
Secondary Prevention
- Dual antiplatelet therapy (aspirin + clopidogrel/ticagrelor) for at least 12 months
- Beta-blocker (especially with reduced EF or arrhythmias)
- ACE inhibitor/ARB (especially with reduced EF, hypertension, or diabetes)
- High-intensity statin (target LDL <70 mg/dL)
- Lifestyle modification: smoking cessation, diet, exercise
- Cardiac rehabilitation
- Aldosterone antagonist (if EF <40% with HF or diabetes, no significant renal dysfunction)
Summary Mnemonic
- Beta-blocker
- Aspirin
- Thrombolysis or PCI (reperfusion)
- Morphine/Nitrates (analgesia)
- Anticoagulation (heparin)
- No more smoking + statins (secondary prevention)
Clinical case: Myocardial infarction Long answer for mbbs exam Biochemistry
Myocardial infarction Long answer for mbbs with flochart exam Biochemistry
Myocardial Infarction - Biochemistry Long Answer for MBBS Exam
Definition
FLOWCHART 1: Pathophysiology of MI - Biochemical Cascade
CORONARY ARTERY OCCLUSION
           │
           ▼
  Cessation of blood flow (O₂ deprivation)
           │
           ▼
  ┌─────────────────────────────────────────┐
  │  AEROBIC METABOLISM CEASES (seconds)    │
  │  Fatty acid oxidation ──STOPS──         │
  │  Oxidative phosphorylation ──STOPS──    │
  └──────────────┬──────────────────────────┘
                 │
                 ▼
  ┌─────────────────────────────────────────┐
  │  ANAEROBIC GLYCOLYSIS (compensatory)    │
  │  Glucose → Pyruvate → LACTATE           │
  │  Only 2 ATP per glucose (vs 36-38)      │
  │  Lactate accumulates → ↓ intracellular pH│
  └──────────────┬──────────────────────────┘
                 │
                 ▼
  ┌─────────────────────────────────────────┐
  │       ATP DEPLETION                     │
  │  ↓ ATP → ↓ Na⁺/K⁺-ATPase function      │
  │  → Na⁺ accumulates inside cell          │
  │  → K⁺ leaks out of cell                 │
  │  → Water enters → CELL SWELLING         │
  └──────────────┬──────────────────────────┘
                 │
                 ▼
  ┌─────────────────────────────────────────┐
  │    CALCIUM OVERLOAD (critical event)    │
  │  ↓ ATP → ↓ SERCA pump (Ca²⁺-ATPase)    │
  │  → Ca²⁺ accumulates in cytosol          │
  │  → Activates phospholipases, proteases  │
  │  → Mitochondrial permeability ↑         │
  └──────────────┬──────────────────────────┘
                 │
                 ▼
  ┌─────────────────────────────────────────┐
  │   SARCOLEMMAL MEMBRANE DISRUPTION       │
  │  (20-40 min = POINT OF NO RETURN)       │
  │  → Intracellular macromolecules LEAK    │
  │  → BIOMARKERS released into blood       │
  └──────────────┬──────────────────────────┘
                 │
                 ▼
        IRREVERSIBLE CELL DEATH
     (Coagulative necrosis → Scar)
I. Normal Cardiac Energy Metabolism
- Fatty acids: Primary fuel (~60-70% of energy); require complete beta-oxidation in mitochondria
- Glucose: Secondary fuel (~20-30%); enters glycolysis → pyruvate → acetyl-CoA → TCA cycle
- Lactate, amino acids, ketone bodies: Minor contributions
-
Substrates → Acetyl-CoA → TCA cycle → NADH/FADH₂ → Electron transport chain → 36-38 ATP per glucose
-
Two critical ATP-consuming steps in cardiac contraction:
- Release of myosin head-actin cross-bridge interaction
- Reuptake of Ca²⁺ into sarcoplasmic reticulum (SERCA pump)
-
Goldman-Cecil Medicine
II. Biochemical Events During Ischemia (Step-by-Step)
Step 1 - Cessation of Aerobic Metabolism (within seconds)
| Event | Consequence |
|---|---|
| O₂ supply cut off | Electron transport chain halts |
| Fatty acid oxidation stops | Fatty acids accumulate (toxic to membranes) |
| Oxidative phosphorylation ceases | ATP production drops precipitously |
| Creatine phosphate (phosphocreatine) rapidly consumed | Brief buffering of ATP levels |
Step 2 - Switch to Anaerobic Glycolysis (minutes)
- Glucose → Pyruvate → Lactate (only 2 ATP per glucose)
- Lactate accumulates → intracellular acidosis (↓ pH)
- Acidosis inhibits key enzymes (phosphofructokinase, myosin ATPase) → worsens contractile failure
- Acidosis also partially protective early on (inhibits some degradative enzymes)
Step 3 - ATP Depletion and Ion Pump Failure
- ↓ ATP → Na⁺/K⁺-ATPase fails → Na⁺ accumulates intracellularly, K⁺ leaks out
- Extracellular K⁺ rises → membrane depolarization → arrhythmias (key mechanism)
- Na⁺ overload → Na⁺/Ca²⁺ exchanger reverses → Ca²⁺ floods into cell
Step 4 - Calcium Overload (central biochemical mediator of injury)
- ↓ ATP → SERCA (Sarco-Endoplasmic Reticulum Ca²⁺-ATPase) fails → Ca²⁺ cannot be pumped back into SR
- Cytosolic Ca²⁺ ↑↑↑ → activates:
- Phospholipases (A₂, C) → membrane phospholipid degradation → further membrane injury
- Calpains (Ca²⁺-dependent proteases) → cytoskeletal protein degradation
- Endonucleases → DNA fragmentation → cell death
- Mitochondrial permeability transition pore (MPTP) opens → mitochondrial swelling → outer membrane rupture → release of cytochrome c → apoptosis
Step 5 - Sarcolemmal Membrane Disruption (20-40 minutes = POINT OF NO RETURN)
-
Progressive phospholipid degradation + cytoskeletal disruption → membrane integrity lost
-
Intracellular macromolecules leak into blood - this is the biochemical basis for cardiac biomarkers
-
Irreversible coagulative necrosis ensues
-
Harrison's Principles of Internal Medicine 22E, p. 2135; Robbins & Kumar Basic Pathology, p. 318
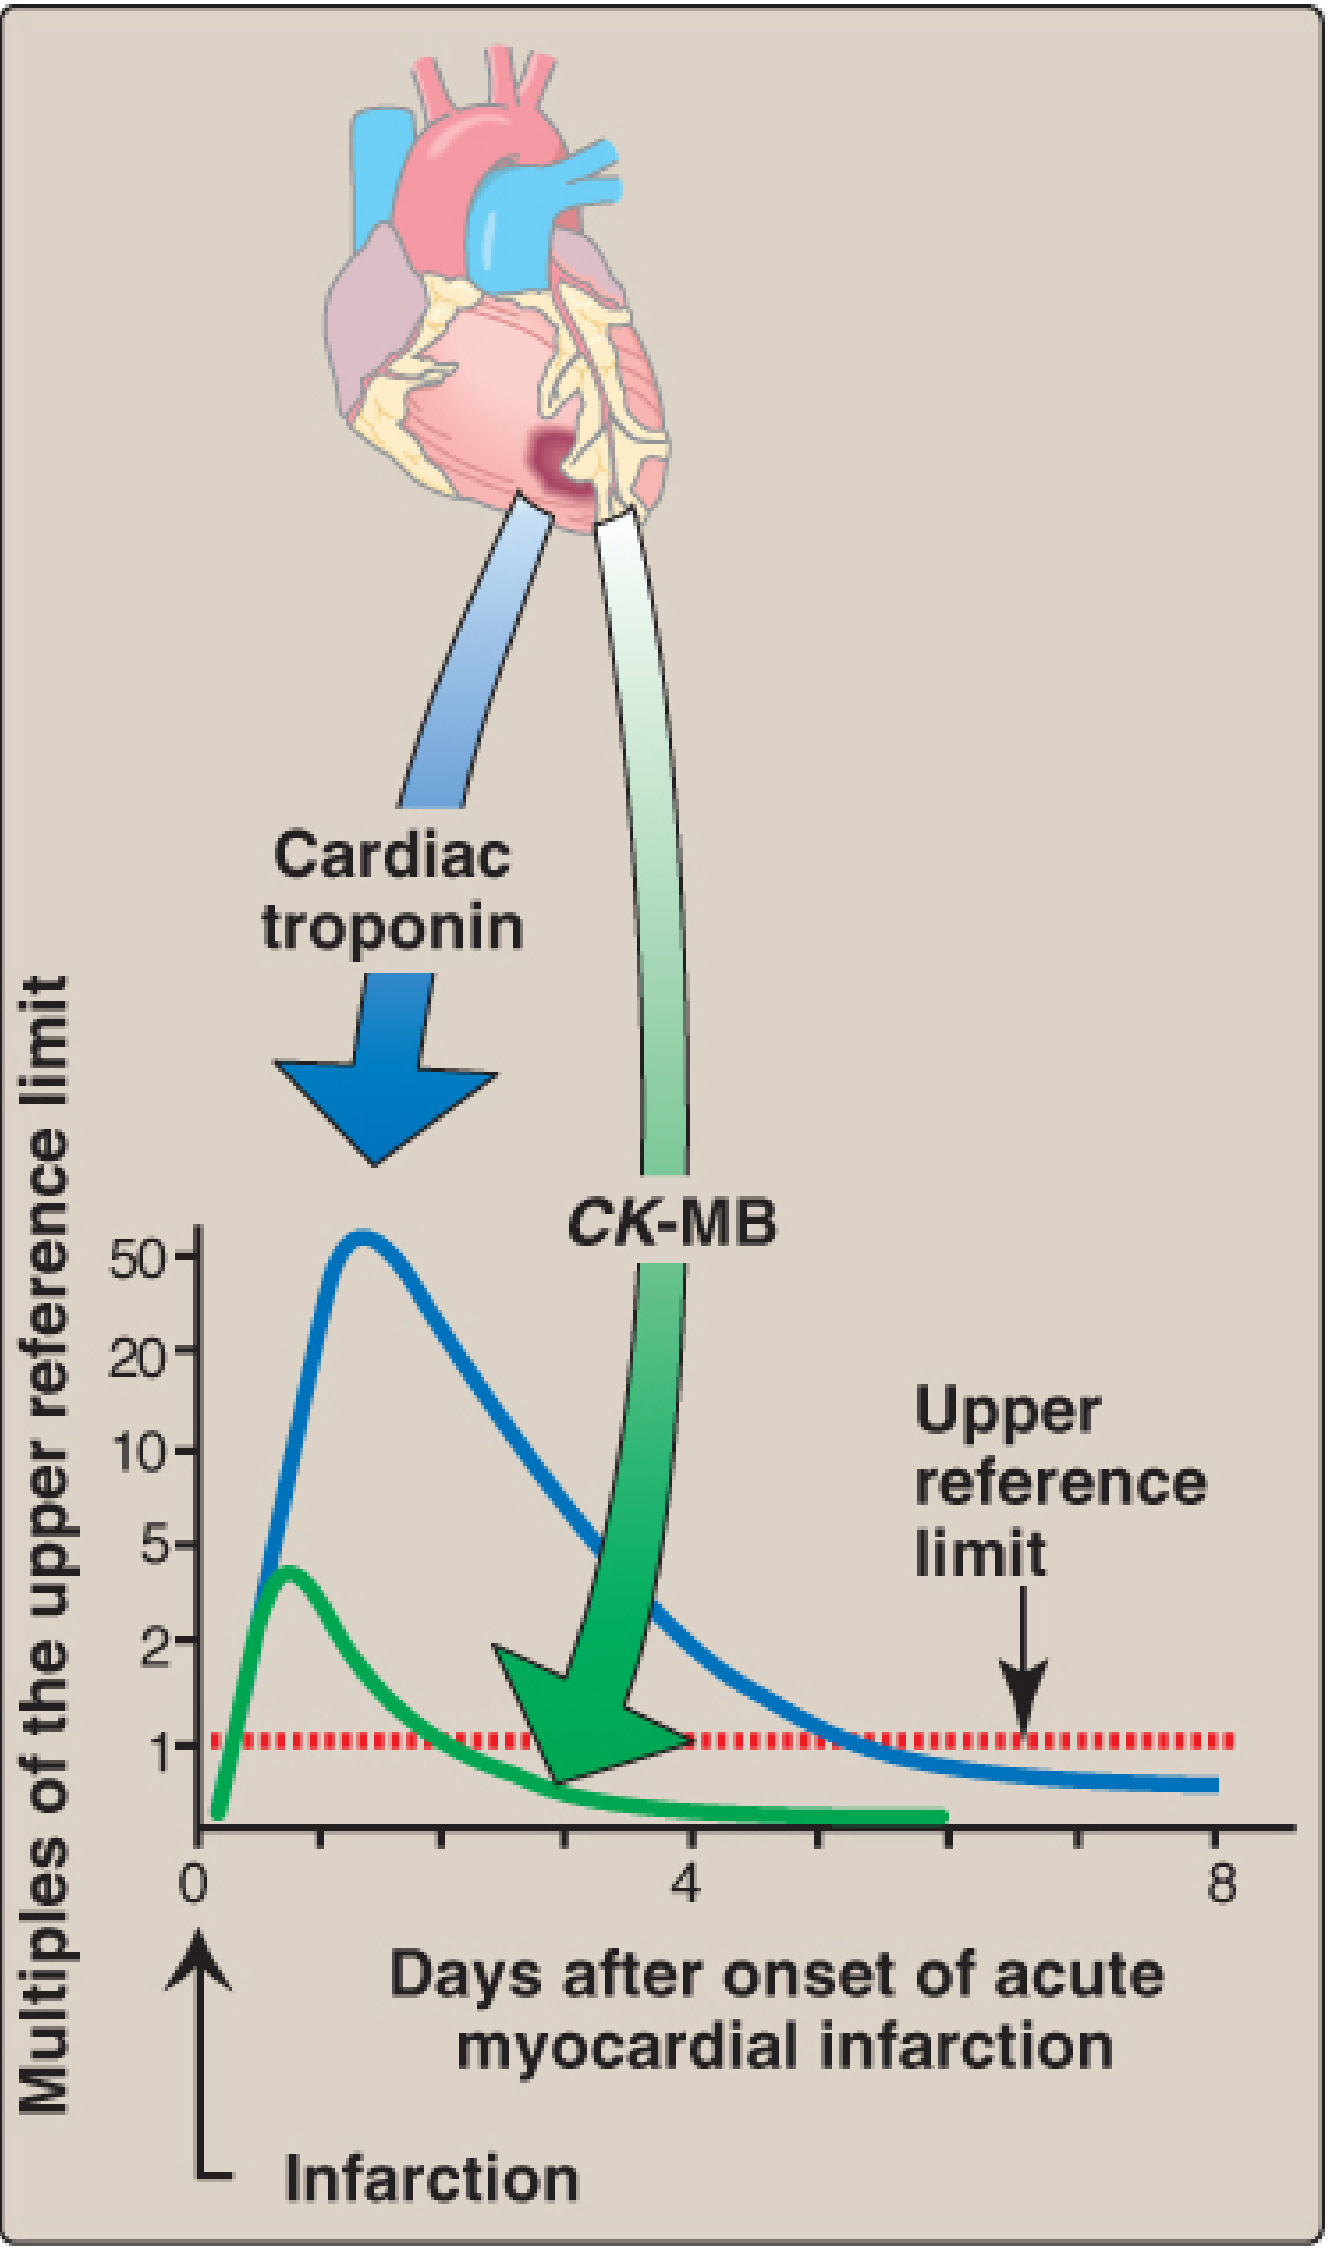
FLOWCHART 2: Cardiac Biomarkers - Sequential Release After MI
TIME AFTER MI ONSET
      │
      │── 0-1 hr ──► FATTY ACID BINDING PROTEIN (FABP)
      │                (earliest, not routinely used)
      │
      │── 1-2 hrs ──► MYOGLOBIN rises
      │                (first detectable, NOT cardiac-specific)
      │                Peaks: 4-8 hrs | Returns to normal: 24 hrs
      │
      │── 3-4 hrs ──► CK-MB rises
      │                Peaks: 18-24 hrs | Returns to normal: 48-72 hrs
      │                Used for re-infarction detection
      │
      │── 4-6 hrs ──► CARDIAC TROPONIN I / T rises ★ GOLD STANDARD ★
      │                Peaks: 24-48 hrs
      │                Returns to normal: 7-14 days (cTnI) / up to 14 days (cTnT)
      │
      │── 24-48 hrs ► LDH rises (LDH₁ > LDH₂ = "flipped" ratio)
                       Peaks: 3-5 days | Returns to normal: 10-14 days
                       Useful when patient presents LATE (>24 hrs)
III. Cardiac Biomarkers - Detailed Biochemistry
1. Cardiac Troponins (cTnI and cTnT) - GOLD STANDARD
| Subunit | Function | Gene |
|---|---|---|
| Troponin T (TnT) | Binds to tropomyosin; anchors complex | TNNT2 |
| Troponin C (TnC) | Binds Ca²⁺; triggers conformational change | TNNC1 |
| Troponin I (TnI) | Inhibits actin-myosin interaction (inhibitory subunit) | TNNI3 |
- At rest: TnI inhibits myosin from binding actin (muscle relaxed)
- On Ca²⁺ rise: Ca²⁺ binds TnC → conformational change → TnI inhibition relieved → tropomyosin shifts → myosin binds actin → contraction
- Cardiac-specific isoforms: cTnI (TNNI3) and cTnT (TNNT2) are unique to cardiac muscle - no expression in normal skeletal muscle
- Medical Physiology (Boron & Boulpaep); Braunwald's Heart Disease
- Cardiac-specific (not found in skeletal muscle under normal conditions)
- Highly sensitive - even small amounts of myocyte injury detected
- Released in two phases: early cytoplasmic pool (free cTn) + later structural pool (cTn bound to myofibrils)
- Remain elevated for 7-14 days (enables late diagnosis)
- cTn appears within 4-6 hours, peaks at 24-48 hours
- The change from baseline to peak value for cTn is much greater than for CK-MB (~50× vs ~4× above upper reference limit)
- Lippincott's Illustrated Reviews: Biochemistry, 8th ed., Clinical Application 5.1
- Detects even sub-clinical myocyte injury
- Can rise within 1-2 hours of MI onset
- Allows rapid rule-in/rule-out protocols (0h/1h or 0h/2h algorithms)
- Serial measurements are important (rising pattern distinguishes acute MI from chronic elevation)
2. Creatine Kinase - MB Isoenzyme (CK-MB)
- CK catalyzes: Creatine + ATP ⇌ Phosphocreatine + ADP
- Provides rapid ATP buffering when metabolic demand suddenly increases
- CK is a dimer of M (muscle) and B (brain) subunits
| Isoenzyme | Subunits | Primary Location |
|---|---|---|
| CK-MM | M + M | Skeletal muscle (95% of total CK) |
| CK-MB | M + B | Heart muscle (3-5% of cardiac CK) |
| CK-BB | B + B | Brain, smooth muscle |
- CK-MB rises at 4-6 hours, peaks at 18-24 hours, returns to normal by 48-72 hours
- Shorter duration of elevation makes it useful for detecting re-infarction (while troponin remains elevated from first MI)
- Less specific than troponin (CK-MB can rise in: skeletal muscle injury, myocarditis, cardiac surgery, defibrillation)
- CK-MB mass assay (not activity) is more sensitive and specific
3. Myoglobin
- Small heme-containing oxygen-binding protein (17 kDa) found in cardiac and skeletal muscle
- Stores O₂ in muscle, releasing it during exercise or ischemia
- Very small molecule → leaks rapidly out of injured cells
- First biomarker to rise: 1-2 hours after MI
- Peaks at 4-8 hours
- Returns to normal within 24 hours
- Not cardiac-specific - rises with any skeletal muscle injury (trauma, rhabdomyolysis, vigorous exercise)
- Useful as negative predictor (if myoglobin is normal at 4-8 hours, MI unlikely)
- Now largely replaced by high-sensitivity troponins
4. Lactate Dehydrogenase (LDH) and the "Flipped" Ratio
- Catalyzes: Pyruvate + NADH ⇌ Lactate + NAD⁺
- Tetramer composed of two subunit types: H (heart) and M (muscle)
- Five isoenzymes:
| Isoenzyme | Subunit Composition | Predominant Location |
|---|---|---|
| LDH₁ | H₄ | Heart, RBCs, kidney |
| LDH₂ | H₃M₁ | Heart, RBCs |
| LDH₃ | H₂M₂ | Lungs, lymphocytes |
| LDH₄ | H₁M₃ | Liver, skeletal muscle |
| LDH₅ | M₄ | Liver, skeletal muscle |
- Normally: LDH₂ > LDH₁ (LDH₁:LDH₂ ratio <1)
- In MI: LDH₁ rises disproportionately → LDH₁ > LDH₂ ("flipped" ratio - diagnostic of MI)
- LDH rises at 24-48 hours, peaks at 3-5 days, remains elevated for 10-14 days
- Clinically useful for patients presenting late (>24 hours after chest pain onset, when CK-MB may have normalized)
FLOWCHART 3: Biochemical Basis of Reperfusion Injury
REPERFUSION (restoration of blood flow)
              │
    ┌─────────┴──────────┐
    │                    │
    ▼                    ▼
BENEFICIAL:          HARMFUL (Reperfusion Injury):
Salvages              │
reversibly            ├── 1. MITOCHONDRIAL DYSFUNCTION
injured cells             │  Ischemia alters mitochondrial
                          │  membrane permeability (MPTP opens)
                          │  → swelling → outer membrane rupture
                          │  → cytochrome c release → APOPTOSIS
                          │
                          ├── 2. CALCIUM OVERLOAD
                          │  Rapid Ca²⁺ influx on reperfusion
                          │  → HYPERCONTRACTURE of sarcomeres
                          │  (Ca²⁺ + ATP suddenly available)
                          │  → "CONTRACTION BAND NECROSIS"
                          │  (eosinophilic bands on histology)
                          │
                          ├── 3. REACTIVE OXYGEN SPECIES (ROS)
                          │  Generated within MINUTES of reperfusion:
                          │  • Superoxide anion (O₂⁻)
                          │  • Hydrogen peroxide (H₂O₂)
                          │  • Hydroxyl radical (•OH)
                          │  • Peroxynitrite (ONOO⁻)
                          │  → Damage membrane proteins & phospholipids
                          │  → DNA strand breaks
                          │
                          ├── 4. "NO-REFLOW" PHENOMENON
                          │  Leukocyte aggregation in microvasculature
                          │  Phospholipase A₂ → arachidonic acid
                          │  → Prostaglandins → inflammation
                          │  Complement activation → endothelial swelling
                          │  → Persistent microvascular obstruction
                          │
                          └── 5. INFLAMMATORY MEDIATORS
                             Cytokine storm (IL-1β, TNF-α, IL-6)
                             → Neutrophil infiltration → ROS
                             → Amplifies injury
FLOWCHART 4: Troponin Complex - Mechanism of Contraction and Biomarker Release
NORMAL CARDIAC CONTRACTION:
Ca²⁺ binds Troponin C
        │
        ▼
Conformational change in Troponin complex
        │
        ▼
Troponin I releases inhibition on actin
        │
        ▼
Tropomyosin shifts, exposes myosin-binding sites on actin
        │
        ▼
Myosin head binds actin → cross-bridge cycling → CONTRACTION
        │
   (requires ATP for cross-bridge release + SERCA for Ca²⁺ reuptake)


DURING ISCHEMIA / INFARCTION:
ATP depleted → Ca²⁺ overload → Sarcolemmal disruption
        │
        ▼
FREE cytoplasmic cTnI/cTnT released FIRST (early, small pool)
        │
        ▼
Structural cTnI/cTnT (myofibril-bound) released LATER
        │
        ▼
cTn detected in blood → DIAGNOSIS OF MI
IV. Summary Table of Cardiac Biomarkers
| Biomarker | First Rises | Peaks | Returns Normal | Cardiac Specific? | Clinical Use |
|---|---|---|---|---|---|
| FABP | 30-60 min | 6 hrs | 24 hrs | No | Research only |
| Myoglobin | 1-2 hrs | 4-8 hrs | 24 hrs | No | Early negative predictor |
| CK-MB | 4-6 hrs | 18-24 hrs | 48-72 hrs | Partial | Re-infarction detection |
| cTnI / cTnT | 4-6 hrs | 24-48 hrs | 7-14 days | YES ★ Gold Standard | Diagnosis, risk stratification |
| hs-cTn | 1-2 hrs | 24-48 hrs | 7-14 days | YES | Rapid rule-in/out |
| LDH₁ | 24-48 hrs | 3-5 days | 10-14 days | Partial | Late presenters |
V. Other Biochemical Abnormalities in MI
| Parameter | Change | Mechanism |
|---|---|---|
| Serum K⁺ | ↑ (hyperkalemia) | K⁺ leaks from necrotic cells; ↓ Na⁺/K⁺-ATPase |
| Blood glucose | ↑ (hyperglycemia) | Stress hormones (cortisol, catecholamines, glucagon) |
| Serum lactate | ↑ | Anaerobic glycolysis, poor tissue perfusion |
| Blood pH | ↓ (acidosis) | Lactate accumulation |
| ESR / CRP | ↑ | Acute phase inflammatory response |
| WBC count | ↑ (neutrophilia) | Acute inflammatory response (within hours) |
| Serum lipids | Variable | Stress lipid mobilization (total cholesterol may fall in first 24 hrs) |
| Catecholamines | ↑↑ | Sympathetic activation → tachycardia, hypertension |
| BNP / NT-proBNP | ↑ | Ventricular wall stress, LV dysfunction |
VI. Biochemical Basis of Key Clinical Signs
| Clinical Sign | Biochemical Mechanism |
|---|---|
| Chest pain | Anaerobic metabolites (H⁺, lactate, bradykinin) stimulate cardiac nociceptors |
| Diaphoresis | Catecholamine surge → adrenergic stimulation of sweat glands |
| Nausea/vomiting | Vagal stimulation (especially inferior MI); increased serotonin from platelets |
| Arrhythmias | ↑ extracellular K⁺ → altered action potential; acidosis → altered Na⁺ channel function |
| Dyspnea | LV dysfunction → pulmonary edema → ↑ airway resistance, ↓ compliance |
| Cardiogenic shock | Massive ATP depletion → contractile failure → ↓ cardiac output |
FLOWCHART 5: Overview - Biochemistry of MI (Master Summary)
 PLAQUE RUPTURE → THROMBUS → CORONARY OCCLUSION
                      │
                      ▼
             ↓ O₂ SUPPLY TO MYOCARDIUM
                      │
          ┌───────────┴───────────┐
          ▼                       ▼
  ↓ Aerobic metabolism    Switch to Anaerobic Glycolysis
  (fatty acid oxidation        │
   STOPS)                  Lactate ↑ → pH ↓
          │                       │
          └───────────┬───────────┘
                      ▼
              ATP DEPLETION
                      │
         ┌────────────┼────────────┐
         ▼            ▼            ▼
  Na⁺/K⁺-ATPase  SERCA pump   Myosin ATPase
  fails            fails        fails
         │            │            │
    K⁺ leaks    Ca²⁺ overload  Contractile
    out; Na⁺    in cytosol     failure
    in; water       │
    enters          ▼
         │    Activates: phospholipases
         │    calpains, endonucleases
         │    Opens MPTP → apoptosis
         │            │
         └────────────┘
                      │
                      ▼
          SARCOLEMMAL DISRUPTION
          (20-40 min = irreversible)
                      │
              ┌───────┴───────┐
              ▼               ▼
        Myoglobin         cTnI / cTnT
        CK-MB             LDH₁
        released          released
         (BIOMARKERS IN BLOOD)
                      │
                      ▼
           CELL DEATH / COAGULATIVE NECROSIS
                      │
              ┌───────┴───────┐
              ▼               ▼
       Without reperfusion:  With reperfusion:
       Pale infarct           Hemorrhagic infarct
       → fibrous scar         + Contraction band necrosis
                              (Ca²⁺ overload + ROS)
VII. High-Yield Biochemistry Points for MBBS Exam
- Heart cannot perform sustained anaerobic metabolism - entirely O₂ dependent
- Ca²⁺ overload is the central mediator of ischemic cell death (via phospholipases, calpains, MPTP)
- Troponin is gold standard - cardiac-specific, appears 4-6 hrs, elevated 7-14 days
- CK-MB best for re-infarction (returns to normal quickly; rises again if new MI)
- LDH "flipped" ratio (LDH₁ > LDH₂) diagnostic in late presenters
- Contraction band necrosis = hallmark of reperfusion injury; due to Ca²⁺ influx + ATP restoration
- Reperfusion ROS appear within minutes; superoxide, H₂O₂, hydroxyl radical, peroxynitrite
- Extracellular K⁺ rise from necrotic cells → electrical instability → ventricular fibrillation
- Myoglobin - first to rise (1-2 hrs) but NOT cardiac-specific
- Acidosis from lactate accumulation contributes to enzyme dysfunction and arrhythmia risk
Glycogen type one disorder laq for mbbs
Glycogen Storage Disease Type I (Von Gierke Disease) — Long Answer for MBBS
Definition
Classification of Glycogen Storage Diseases (Overview)
| Category | Example | Enzyme Deficient | Key Feature |
|---|---|---|---|
| Hepatic type | GSD I (Von Gierke) | Glucose-6-phosphatase | Hepatomegaly + hypoglycemia |
| Myopathic type | GSD V (McArdle) | Muscle phosphorylase | Cramps + no lactate rise on exercise |
| Generalized | GSD II (Pompe) | Lysosomal acid alpha-glucosidase | Cardiomegaly + death in 2 yrs |
- Robbins, Cotran & Kumar: Pathologic Basis of Disease, Table 5.7
GSD Type I - Subtypes
| Subtype | Deficient Enzyme | Gene | Key Difference |
|---|---|---|---|
| Type Ia (most common, ~80%) | Glucose-6-phosphatase catalytic subunit | G6PC1 | Hepatic + renal involvement |
| Type Ib (~20%) | Glucose-6-phosphate transporter (translocase) | SLC37A4 | Same as Ia + neutropenia + recurrent infections + IBD |
FLOWCHART 1: Normal Glycogen Metabolism vs. GSD Type I Block
NORMAL HEPATIC GLYCOGEN METABOLISM:

GLYCOGEN  ──[Glycogen phosphorylase]──►  Glucose-1-phosphate
                                                │
                                      [Phosphoglucomutase]
                                                │
                                                ▼
                                     Glucose-6-phosphate  ◄── Gluconeogenesis
                                                │
                                    [GLUCOSE-6-PHOSPHATASE] ← DEFICIENT IN GSD I
                                                │
                                                ▼
                                      FREE GLUCOSE  ──► Released into blood
                                                         (Maintains blood glucose)


IN GSD TYPE I (GLUCOSE-6-PHOSPHATASE ABSENT):

GLYCOGEN  ──────────────────────────────►  Glucose-1-phosphate
                                                │
                                                ▼
                                     Glucose-6-phosphate
                                      ╔══════════╗
                                      ║  BLOCKED ║  ← Cannot be dephosphorylated
                                      ╚══════════╝
                                            │
                     ┌──────────────────────┘
                     │
           ┌─────────┴──────────────────────────────┐
           ▼                                         ▼
   GLUCOSE-6-P diverted to:               NO FREE GLUCOSE released
   • Glycogen synthesis (↑↑ glycogen)     → FASTING HYPOGLYCEMIA
   • Glycolysis → Pyruvate → LACTATE      → LACTIC ACIDOSIS
   • HMP shunt / pentose phosphate        → Ribose → purines → URIC ACID ↑
   • Triglyceride synthesis via           → HYPERTRIGLYCERIDEMIA
     acetyl-CoA (fatty acid synthesis)
Biochemical Pathogenesis (Step by Step)
Why Each Metabolic Abnormality Occurs:
GLUCOSE-6-PHOSPHATASE DEFICIENCY
              │
              ▼
     GLUCOSE-6-PHOSPHATE ACCUMULATES
              │
    ┌─────────┼────────────────────────┐
    ▼         ▼                        ▼
↑GLYCOGEN   ↑GLYCOLYSIS            ↑HMP SHUNT
in liver/    │                      (pentose phosphate)
kidneys      │                          │
             ▼                          ▼
        ↑ LACTATE              ↑ Ribose-5-phosphate
        ↑ PYRUVATE             → ↑ Purine synthesis
             │                      → ↑ Uric acid
             ▼                      → HYPERURICEMIA
        LACTIC ACIDOSIS              → GOUT
        (metabolic acidosis          → XANTHOMAS (skin)
         with ↓pH, ↑anion gap)
             │
             ▼
        Pyruvate → Acetyl-CoA
        → ↑ FATTY ACID synthesis
        → ↑ TRIGLYCERIDES
        → HYPERLIPIDEMIA
        → Fatty liver (steatosis)
        → XANTHOMAS + PANCREATITIS risk

PLUS: Blocked gluconeogenesis  →  Cannot make glucose from lactate/amino acids
              ↓
        Prolonged HYPOGLYCEMIA
        + KETOSIS
        + Elevated glucagon (counter-regulatory)
FLOWCHART 2: Consequences of Hypoglycemia in GSD I
FASTING HYPOGLYCEMIA (very low blood glucose)
              │
              ▼
    Brain glucose deprivation
              │
    ┌─────────┼──────────────┐
    ▼         ▼              ▼
Seizures   Lethargy    Developmental delay
           Irritability
              │
              ▼
   Counter-regulatory hormones ↑
   (Glucagon ↑, Cortisol ↑, Catecholamines ↑)
              │
              ▼
   Glycogenolysis ↑ BUT glucose cannot be released
              │
              ▼
   Glycogen accumulates further in liver + kidney
              │
              ▼
   HEPATOMEGALY + NEPHROMEGALY
Morphological (Pathological) Changes
Gross:
- Massive hepatomegaly - liver loaded with glycogen and fat (steatosis)
- Nephromegaly - both kidneys enlarged due to glycogen + lipid accumulation
- NO splenomegaly (distinguishes from many other storage diseases)
Microscopic:
- Hepatocytes: Markedly enlarged ("balloon cells"), cytoplasm filled with glycogen (clear vacuoles on H&E; PAS stain confirms - glycogen stains magenta/pink)
- Intranuclear glycogen deposits (characteristic)
- Small amounts of lipid droplets (steatosis)
- Kidneys: Glycogen and lipid in tubular epithelial cells (especially proximal tubules)
- Architecture preserved (no fibrosis early)
Special stains:
-
PAS (Periodic Acid-Schiff): Glycogen stains bright magenta/red - positive
-
PAS + diastase: Diastase removes glycogen; PAS-diastase = negative, confirming it IS glycogen (not mucin)
-
Robbins, Cotran & Kumar: Pathologic Basis of Disease, Table 5.7
Clinical Features
Age of Onset
- Presents in infancy (first few months of life) with fasting hypoglycemia and hepatomegaly
- Can present at birth with hypoglycemia after delayed feeds
Classic Triad
- Hypoglycemia (severe fasting, often symptomatic)
- Hepatomegaly (massive)
- Growth retardation (doll-like facies, short stature)
"Doll-Like" Appearance
- Round, fat cheeks (fat redistribution)
- Protuberant abdomen (huge liver)
- Short stature
- Thin extremities
Full Clinical Features
| System | Feature | Mechanism |
|---|---|---|
| Metabolic | Severe fasting hypoglycemia, ketosis | Cannot release free glucose |
| Metabolic | Lactic acidosis | G6P → glycolysis → lactate; blocked gluconeogenesis |
| Metabolic | Hyperuricemia → Gout | ↑ purine synthesis from HMP shunt; lactate competes with urate for renal tubular secretion |
| Metabolic | Hypertriglyceridemia / Hyperlipidemia | ↑ fatty acid synthesis from acetyl-CoA; ↓ lipoprotein lipase activity; hypoinsulinism |
| Liver | Massive hepatomegaly, steatosis | Glycogen + lipid accumulation |
| Liver | Hepatic adenomas (late complication) | Usually >10 yrs; risk of transformation to HCC |
| Kidney | Nephromegaly | Glycogen + lipid in tubules |
| Kidney | Focal segmental glomerulosclerosis, CKD (adults) | Hyperfiltration, urate nephropathy |
| Skin | Xanthomas | Hyperlipidemia |
| GI | Pancreatitis | Severe hypertriglyceridemia |
| Blood | Bleeding tendency | Platelet dysfunction (impaired ADP release and aggregation) |
| Type Ib only | Neutropenia, recurrent infections, IBD | SLC37A4 transporter absent in neutrophils |
Neurological
- Intellectual development usually normal if hypoglycemia controlled
- Seizures from uncontrolled hypoglycemia can cause brain damage
FLOWCHART 3: Biochemical Interrelations in GSD I
                 G6Pase DEFICIENT
                        │
                        ▼
              GLUCOSE-6-P ACCUMULATES
         ┌──────────────┼──────────────────┐
         ▼              ▼                  ▼
   ↑GLYCOGEN      ↑GLYCOLYSIS        ↑HMP pathway
   synthesis      │                  │
   (in liver,     │                  └──► ↑ Ribose-5-P
   kidneys)       ▼                       → ↑ Purines
   → HEPATOMEGALY Pyruvate                → ↑ Uric acid
   → NEPHROMEGALY     │                   → GOUT
                      ├──► LACTATE        → Xanthine oxidase
                      │    (LACTIC        inhibitors (Rx)
                      │    ACIDOSIS)
                      ▼
                  Acetyl-CoA
                      │
                 ┌────┴─────────────┐
                 ▼                  ▼
           ↑Fatty acid          ↑Cholesterol
           synthesis             synthesis
                 └────┬─────────────┘
                      ▼
              ↑TRIGLYCERIDES
              (HYPERLIPIDEMIA)
              → Xanthomas
              → Pancreatitis risk
              → Fatty liver

   BLOCKED GLUCONEOGENESIS:
   Lactate/Alanine/Glycerol cannot make glucose
   → Hypoglycemia worsened
   → Counter-regulatory response
   → Glucagon ↑, Cortisol ↑
   → Growth retardation
   → "Doll-like" facies
Investigations / Diagnosis
Biochemistry Profile (Characteristic "HULK" pattern):
- H - Hypoglycemia (fasting glucose very low)
- U - Uric acid ↑ (hyperuricemia)
- L - Lactate ↑ (lactic acidosis)
- K - "K" triglycerides (hypertriglyceridemia, hyperlipidemia)
Specific Tests
| Test | Finding | Significance |
|---|---|---|
| Fasting blood glucose | Very low (often <3.3 mmol/L) | Core feature |
| Serum lactate | Elevated (>2 mmol/L) | Lactic acidosis |
| Serum uric acid | Elevated | Hyperuricemia |
| Serum triglycerides / VLDL | Markedly elevated | Hyperlipidemia |
| Serum cholesterol | Elevated | Lipid metabolism derangement |
| Glucagon stimulation test | No rise in blood glucose (but lactate rises) | Confirms inability to release glucose |
| Galactose / fructose challenge | No rise in blood glucose | Both converted to G6P, still cannot be released |
| Liver biopsy (PAS stain) | Glycogen-laden hepatocytes, PAS+, PAS-diastase negative | Confirms glycogen accumulation |
| Glucose-6-phosphatase enzyme assay (liver tissue) | Absent or markedly reduced activity | Confirmatory |
| Genetic testing (G6PC1 / SLC37A4 mutation) | Confirms type Ia vs Ib | Gold standard |
| Ultrasound abdomen | Hepatomegaly, nephromegaly, hepatic adenomas | Structural assessment |
| Urinalysis | Glycosuria, phosphaturia (Fanconi-like in some) | Tubular dysfunction |
FLOWCHART 4: Diagnostic Algorithm
Infant / child with:
• Fasting hypoglycemia
• Massive hepatomegaly
• Short stature
           │
           ▼
Blood tests: Glucose ↓, Lactate ↑, Uric acid ↑, TG ↑
           │
           ▼
Glucagon stimulation test
  No glucose rise but lactate rises
           │
           ▼
    Ultrasound: Hepatomegaly + nephromegaly
           │
           ▼
   Liver biopsy:
   • PAS+ (glycogen)
   • G6Pase activity assay: ABSENT
           │
           ▼
   Genetic testing: G6PC1 mutation → Type Ia
                    SLC37A4 mutation → Type Ib
           │
           ▼
       CONFIRMED GSD TYPE I
Treatment
Principles: MAINTAIN EUGLYCEMIA AT ALL TIMES
Dietary Management (CORNERSTONE)
| Intervention | Detail | Rationale |
|---|---|---|
| Uncooked cornstarch (UCCS) | 1.6-2.5 g/kg every 4-6 hrs (day + night) | Slowly digested; provides sustained glucose release; acts as slow-release glucose polymer |
| Frequent meals | Every 2-4 hours during day | Prevents fasting state |
| Continuous overnight nasogastric feeding | Especially in infants | Prevents nocturnal hypoglycemia (most dangerous time) |
| Avoid fructose + galactose | Strict dietary restriction | Both metabolized to G6P, which cannot be dephosphorylated → worsens metabolic acidosis |
| Low-fat diet | To manage hyperlipidemia | Reduces TG accumulation |
| High complex carbohydrate | ~55-65% of calories from complex carbs | Provides steady glucose supply |
Drug Treatment
| Drug | Indication | Mechanism |
|---|---|---|
| Allopurinol | Hyperuricemia / gout | Xanthine oxidase inhibitor → ↓ uric acid production |
| Fibrates / statins | Hyperlipidemia | ↓ triglycerides / cholesterol |
| ACE inhibitors | Microalbuminuria / kidney disease | Nephroprotection |
| Sodium citrate / bicarbonate | Metabolic acidosis | Buffer lactic acidosis |
| G-CSF (filgrastim) | Type Ib - neutropenia | Stimulates neutrophil production |
| Ezetimibe | Hypercholesterolemia | ↓ intestinal cholesterol absorption |
| Mesalamine | Type Ib - IBD | Anti-inflammatory |
Surgical / Advanced Treatment
-
Liver transplantation: Curative for hepatic manifestations; indicated for:
- Multiple/large hepatic adenomas (especially if HCC suspected)
- Poorly controlled metabolic disease
- Note: Does NOT correct renal or extrahepatic disease (renal transplant needed separately)
-
Gene therapy: Clinical trials ongoing for G6PC1 replacement
-
Kidney transplantation: For end-stage renal disease (in adults)
-
Goldman-Cecil Medicine; Robbins, Cotran & Kumar
Complications (Late)
| Complication | Age | Mechanism |
|---|---|---|
| Hepatic adenomas | >10 years | Glycogen overload, elevated glucagon, insulin resistance |
| Hepatocellular carcinoma (HCC) | Adults | Malignant transformation of adenomas |
| Gout | Adults | Chronic hyperuricemia |
| Osteoporosis | Adults | Chronic acidosis, poor growth |
| Polycystic ovaries | Adult women | Hormonal dysregulation |
| Focal segmental glomerulosclerosis | Adults | Hyperfiltration injury |
| Chronic kidney disease | Adults | Multiple renal insults |
| Pulmonary hypertension | Adults | Rare |
| Pancreatitis | Adults | Severe hypertriglyceridemia |
Prognosis
- With early diagnosis and strict dietary management, most patients survive into adulthood with normal intellectual function
- Major risks: hepatic adenoma → HCC, renal failure in adults
- Life expectancy is near-normal with good metabolic control
MASTER SUMMARY FLOWCHART
G6Pase GENE MUTATION (Autosomal Recessive)
                │
                ▼
     G6Pase ENZYME ABSENT (liver + kidney)
                │
  ┌─────────────┼────────────────────┐
  ▼             ▼                    ▼
Cannot       Cannot              G6P accumulates
release      perform            ──────────────────
glucose    gluconeogenesis        → ↑ Glycogen (liver, kidney)
from        from lactate/         → ↑ Lactate (lactic acidosis)
glycogen    amino acids           → ↑ Uric acid (hyperuricemia)
                                  → ↑ Triglycerides (hyperlipidemia)
  │
  ▼
HYPOGLYCEMIA ──► seizures, brain damage if untreated
HEPATOMEGALY + NEPHROMEGALY
"Doll-like" facies, stunted growth
Bleeding tendency (platelet dysfunction)
                │
                ▼
   [TYPE Ib only: + NEUTROPENIA + IBD]
                │
                ▼
  DIAGNOSIS: G6Pase activity ↓ in liver biopsy
             Gene testing (G6PC1 or SLC37A4)
             Glucagon test: no blood glucose rise
                │
                ▼
  TREATMENT: Uncooked cornstarch + frequent feeds
             Avoid fructose/galactose
             Allopurinol (uric acid)
             Liver transplant (for adenomas/HCC)
             G-CSF (Type Ib neutropenia)
High-Yield MBBS Exam Points
- Enzyme deficient: Glucose-6-phosphatase (G6PC gene) - at the junction of glycogenolysis AND gluconeogenesis
- Both pathways blocked: Cannot release glucose from either glycogen breakdown or gluconeogenesis
- Classic tetrad: Hypoglycemia + Lactic acidosis + Hyperuricemia + Hyperlipidemia ("HULA" or "HULK")
- "Doll-like facies" + massive hepatomegaly + short stature = hallmark clinical picture
- Glucagon test: Glucose does NOT rise, but LACTATE rises (glycogenolysis occurs but G6P cannot be converted)
- PAS stain positive in liver biopsy; PAS-diastase negative
- Treatment cornerstone: Uncooked cornstarch (UCCS) every 4-6 hours + avoid fructose and galactose
- Type Ib: Additional neutropenia + recurrent infections + IBD (SLC37A4 transporter gene)
- Late complication: Hepatic adenomas → HCC; renal failure in adults
- Liver transplant: Corrects hepatic phenotype but NOT renal or muscle disease
1. G-6-PD deficiency 2. Metabolic acidosis 3. Complications of diabetes mellitus 4. Protein misfolding and associated disorders 5. Hyperkalemia and Hypokalemia 6. Acute phase plasma proteins and their clinical significance 7. Compare normal and abnormal serum electrophoresis patterns 8. Infant respiratory distress syndrome 9. Jaundice 10. Glycogen storage disorders 11. Clinical significance of competitive inhibitors as drugs Short notes on these questions for biochemistry
Biochemistry Short Notes — MBBS Exam
1. G-6-PD Deficiency (Glucose-6-Phosphate Dehydrogenase Deficiency)
Definition
Biochemical Basis
HMP SHUNT (Pentose Phosphate Pathway):
Glucose-6-phosphate + NADP⁺ ──[G6PD]──► 6-Phosphogluconate + NADPH

NADPH role:
NADPH + Oxidized Glutathione (GSSG) ──[Glutathione reductase]──► NADP⁺ + Reduced Glutathione (GSH)
GSH neutralizes H₂O₂ and free radicals → protects RBC membrane

IN G6PD DEFICIENCY:
↓ NADPH → ↓ GSH → RBC cannot neutralize oxidative stress
→ Hemoglobin oxidized to METHEMOGLOBIN
→ Heinz body formation (denatured Hb precipitates)
→ Rigid RBCs trapped and destroyed in spleen
→ HEMOLYTIC ANEMIA
Genetics
- X-linked recessive (males affected, females are carriers)
- Most common: G6PD-A- (African variant), G6PD-Mediterranean (more severe)
- Affects ~500 million people worldwide
Precipitants of Hemolysis ("PRIMA")
- Primaquine, dapsone (oxidant drugs)
- Radicals from infection (commonest trigger)
- Ingestion of fava beans (favism)
- Metabolic acidosis
- Aspirin, sulfonamides, nitrofurantoin
Clinical Features
- Episodic hemolytic anemia (usually triggered)
- Jaundice, pallor, dark urine (hemoglobinuria)
- Back/flank pain
- Between episodes: completely normal
Lab Findings
- Blood film: Heinz bodies (supravital stain), bite cells, blister cells
- ↓ Hb, ↑ reticulocytes, ↑ LDH, ↑ unconjugated bilirubin
- Fluorescent spot test (screening) - NADPH detected
- Quantitative G6PD enzyme assay - confirmatory
Key Biochemistry Points
- G6PD is the only source of NADPH in RBCs (no mitochondria → no other NADPH source)
- G6PD activity decreases as RBCs age; old cells most vulnerable
- Do not test during acute hemolysis (reticulocytes have high enzyme levels → false normal)
2. Metabolic Acidosis
Definition
Biochemical Classification: Anion Gap
METABOLIC ACIDOSIS
        │
        ├── HIGH ANION GAP (>12) ── "MUDPILES"
        │    Methanol / Metformin
        │    Uremia (renal failure)
        │    Diabetic ketoacidosis (DKA)
        │    Propylene glycol / Paracetamol
        │    Isoniazid / Iron / Inborn errors
        │    Lactic acidosis
        │    Ethylene glycol
        │    Salicylates
        │
        └── NORMAL ANION GAP (hyperchloremic) ── "HARD UP"
             Hyperalimentation (TPN)
             Acetazolamide / Addison's disease
             Renal tubular acidosis (RTA)
             Diarrhea (loss of HCO₃⁻)
             Ureteral diversion
             Post-hypocapnia
Bicarbonate Buffer System
- CO₂ regulated by lungs; HCO₃⁻ regulated by kidneys
Compensation
- Respiratory compensation: ↓ PCO₂ (Kussmaul breathing - deep, rapid)
- Expected PCO₂ = 1.5 × [HCO₃⁻] + 8 ± 2 (Winter's formula)
- Kidneys: ↑ H⁺ excretion, ↑ HCO₃⁻ reabsorption, ↑ NH₄⁺ excretion
ABG in Metabolic Acidosis
| Parameter | Change |
|---|---|
| pH | < 7.35 |
| HCO₃⁻ (primary) | ↓ (<22 mEq/L) |
| PCO₂ (compensatory) | ↓ |
Clinical Features
- Kussmaul respiration (fruity odour in DKA)
- Nausea, vomiting
- Cardiac: arrhythmias, ↓ cardiac output, vasodilation, hypotension
- CNS: confusion → coma
- Hyperkalemia (H⁺ shifts into cells in exchange for K⁺)
Treatment
- Treat underlying cause
- NaHCO₃ (if pH <7.1 or severe symptoms)
- Dialysis (renal failure, methanol, ethylene glycol)
3. Complications of Diabetes Mellitus
Biochemical Basis
CHRONIC HYPERGLYCEMIA
        │
┌───────┼──────────────────────────────┐
▼       ▼               ▼             ▼
Polyol  AGEs        PKC pathway    Hexosamine
pathway (Advanced    activation     pathway
        Glycation
        End-products)
1. Polyol (Sorbitol) Pathway
- Glucose → Sorbitol (aldose reductase) → Fructose
- Sorbitol accumulates in lens, nerves, kidney, retina (impermeable to cell membrane)
- → Cell swelling, osmotic damage → Cataracts, neuropathy
- ↓ NADPH used (less GSH → oxidative stress)
2. Advanced Glycation End-products (AGEs)
- Glucose non-enzymatically glycates proteins → Schiff base → Amadori products → AGEs
- Example: HbA1c (glycated hemoglobin) - reflects glucose control over 3 months
- AGE-crosslinks collagen → basement membrane thickening → microangiopathy
- AGE receptors (RAGE) → inflammatory signaling → macrovascular disease
3. Protein Kinase C (PKC) Activation
- ↑ Diacylglycerol → PKC activation → ↑ VEGF, TGF-β, fibronectin
- → Basement membrane thickening, neovascularization (→ retinopathy)
- → Glomerular hypertrophy, ↑ albumin filtration (→ nephropathy)
4. Hexosamine Pathway
- Excess glucose → glucosamine-6-phosphate → modifies proteins via O-GlcNAc
- → Gene expression changes → ↑ TGF-β, PAI-1 → fibrosis, thrombosis
Microvascular Complications
| Complication | Key Feature |
|---|---|
| Retinopathy | Non-proliferative → proliferative; VEGF-driven neovascularization; leading cause of blindness |
| Nephropathy | Microalbuminuria → proteinuria → nephrotic syndrome → CKD; Kimmelstiel-Wilson nodules |
| Neuropathy | Sensory (glove-stocking), autonomic (gastroparesis, impotence), mononeuritis |
Macrovascular Complications
- Atherosclerosis: ↑ LDL glycation → foam cells; ↑ PAI-1 → thrombosis
- Ischemic heart disease, stroke, peripheral arterial disease
Acute Complications
| Complication | Biochemistry |
|---|---|
| DKA (Type 1) | Insulin absent → ↑ lipolysis → ↑ FFA → ↑ ketone bodies (acetoacetate, β-hydroxybutyrate) → HIGH AG metabolic acidosis |
| HHS (Type 2) | Severe hyperglycemia (>600 mg/dL), hyperosmolality, no significant ketosis (residual insulin inhibits lipolysis) |
| Hypoglycemia | Over-treatment with insulin |
4. Protein Misfolding and Associated Disorders
Normal Protein Folding
- Polypeptide chain folds into unique 3D native conformation (thermodynamically most stable)
- Assisted by molecular chaperones (Hsp70, Hsp90, GroEL) which prevent premature aggregation
- Proteosomes (ubiquitin-proteasome system) degrade abnormally folded proteins
Misfolding - Biochemical Basis
CORRECTLY FOLDED PROTEIN (native, α-helical, soluble)
              │
    ─── MUTATION / STRESS ───
              │
              ▼
    MISFOLDED PROTEIN
    (exposes hydrophobic regions)
              │
    ┌─────────┴──────────────────┐
    ▼                            ▼
Chaperone rescue              AGGREGATION
(refolding or                 → β-sheet rich
 degradation)                   fibrils (amyloid)
                                → TOXIC to cells
Types of Misfolding Disorders
| Category | Disease | Protein | Key Feature |
|---|---|---|---|
| Amyloidoses | AL amyloidosis | Immunoglobulin light chains | Plasma cell disorder |
| AA amyloidosis | Serum amyloid A (SAA) | Secondary to chronic inflammation | |
| Senile cardiac amyloidosis | Transthyretin (TTR) | Elderly; heart failure | |
| Neurodegenerative | Alzheimer's disease | Aβ peptide + tau | Amyloid plaques + neurofibrillary tangles |
| Parkinson's disease | α-synuclein | Lewy bodies in neurons | |
| Huntington's disease | Huntingtin (polyQ expansion) | Cytoplasmic inclusions | |
| ALS | SOD1, TDP-43 | Motor neuron death | |
| Prion diseases | CJD, scrapie, BSE | PrP^Sc (prion protein) | Infectious misfolding; normal PrP^C → PrP^Sc |
| ER stress diseases | Cystic fibrosis | CFTR ΔF508 | Misfolded protein retained in ER, degraded |
| Gain of function | Sickle cell anemia | HbS (Glu→Val) | Polymerization under low O₂ |
Amyloid - Key Biochemistry
- All amyloid fibrils share a common cross-β pleated sheet structure
- Stain with Congo red (apple-green birefringence under polarized light)
- Deposited extracellularly → organ dysfunction (heart, kidney, liver, nerves)
Prion Disease - Unique Mechanism
- PrP^C (normal, α-helical) → PrP^Sc (abnormal, β-sheet rich)
- PrP^Sc acts as a template to convert PrP^C → PrP^Sc (conformational propagation)
- Entirely protein-only infectious agent (no nucleic acid)
- Resistant to protease, heat, UV radiation
ER Stress and Unfolded Protein Response (UPR)
- Accumulation of misfolded proteins in ER triggers UPR
- UPR: Attempts to restore homeostasis (↑ chaperones, ↑ ERAD)
- Prolonged UPR → apoptosis → β-cell loss (Type 2 DM)
5. Hyperkalemia and Hypokalemia
Normal Serum Potassium: 3.5 - 5.0 mEq/L
HYPOKALEMIA (K⁺ < 3.5 mEq/L)
↓ INTAKE: Starvation, alcoholism
↑ LOSSES:
  • GI: Diarrhea, vomiting, NG suction, laxative abuse
  • Renal: Diuretics (loop/thiazide), hyperaldosteronism, RTA,
           hypomagnesemia, Cushing's syndrome, Bartter syndrome
TRANSCELLULAR SHIFT:
  • Insulin, catecholamines, alkalosis, β-agonists
  → K⁺ enters cells in exchange for H⁺
- Resting membrane potential becomes more negative (hyperpolarization) → muscle weakness
- Impaired insulin secretion → hyperglycemia
- ↑ Ammonia production (metabolic alkalosis worsened)
- Metabolic alkalosis (K⁺ leaves cells in exchange for H⁺)
- Flat/inverted T waves
- Prominent U waves (after T wave, in V2-V3)
- ST depression
- Prolonged QU interval
- Severe: Ventricular arrhythmias, VF
HYPERKALEMIA (K⁺ > 5.0 mEq/L)
↑ INTAKE: Excessive IV KCl, blood transfusions
↓ EXCRETION:
  • Renal failure (most common)
  • ACE inhibitors, ARBs, K-sparing diuretics
  • Addison's disease (↓ aldosterone)
  • Hypoaldosteronism (type 4 RTA)
TRANSCELLULAR SHIFT (OUT of cells):
  • Acidosis (H⁺ enters → K⁺ exits)
  • Insulin deficiency (DKA)
  • Cell lysis (hemolysis, rhabdomyolysis, tumor lysis)
  • Succinylcholine (depolarizing NMJ blocker)
  • Beta-blockers
PSEUDOHYPERKALEMIA:
  • Thrombocytosis, leukocytosis, improper sample collection
- Resting membrane potential becomes less negative (depolarization) → initial excitation → then inexcitability
- Inhibits ammoniagenesis → metabolic acidosis worsened
- Peaked (tall, narrow, symmetric) T waves (earliest sign)
- Prolonged PR interval
- Widened QRS
- Sine wave pattern
- Ventricular fibrillation / Asystole
- Calcium gluconate (membrane stabilization - cardioprotective, fastest)
- Insulin + Dextrose (shift K⁺ into cells)
- Sodium bicarbonate (shift K⁺ into cells if acidosis)
- Salbutamol (β₂ agonist - shifts K⁺ into cells)
- Kayexalate (sodium polystyrene sulfonate - removes K⁺ from gut)
- Dialysis (definitive removal)
6. Acute Phase Plasma Proteins and Their Clinical Significance
Definition
Stimulus: IL-1β, IL-6, TNF-α from macrophages → Liver hepatocytes → synthesis of acute phase proteins
Classification
| Protein | Function | Clinical Use |
|---|---|---|
| C-Reactive Protein (CRP) | Opsonization, complement activation, binds phosphocholine on bacteria | Marker of inflammation, infection, MI; guides antibiotic therapy |
| Serum Amyloid A (SAA) | Precursor of AA amyloid | Chronic inflammation → secondary amyloidosis |
| Fibrinogen | Coagulation (forms fibrin) | ↑ ESR (coats RBCs → rouleaux); thrombosis risk |
| Haptoglobin | Binds free Hb (prevents renal loss) | ↓ in hemolysis (consumed); distinguishes hemolysis |
| Ceruloplasmin | Copper transport; ferroxidase activity | ↓ in Wilson's disease; ↑ in inflammation |
| Alpha-1 antitrypsin (A1AT) | Serine protease inhibitor (inhibits elastase) | ↓ in A1AT deficiency → emphysema, liver cirrhosis |
| Alpha-2 macroglobulin | Broad-spectrum protease inhibitor | ↑ in nephrotic syndrome (large molecule, not lost) |
| Transferrin | Iron transport | ↓ in inflammation (negative APP); ↑ in iron deficiency |
| Ferritin | Iron storage | ↑ in inflammation; ↑ in haemochromatosis |
| Complement proteins (C3, C4) | Opsonization, lysis | ↑ in acute inflammation |
| Prothrombin, factor VIII | Coagulation | ↑ procoagulant state during acute phase |
| Protein | Reason for Fall |
|---|---|
| Albumin | ↓ synthesis (resources diverted); ↑ vascular permeability; ↑ volume of distribution |
| Transferrin | ↓ synthesis during APR (sequesters iron away from pathogens) |
| Prealbumin (transthyretin) | Short half-life (2 days); best early marker of nutritional status |
| Retinol-binding protein | ↓ in malnutrition and inflammation |
Clinical Significance Summary
| Protein | Clinical Use |
|---|---|
| CRP | Monitoring infection/inflammation; cardiovascular risk (hs-CRP); guides antibiotic therapy |
| Haptoglobin | Diagnosing hemolysis (undetectable when consumed) |
| A1AT | Screening for emphysema/cirrhosis in young patients |
| Ceruloplasmin | Diagnosing Wilson's disease |
| Prealbumin | Nutritional assessment (ICU/malnutrition) |
| SAA | Monitoring AA amyloid risk in chronic inflammatory disease |
| Fibrinogen | Coagulation testing; ↑ ESR interpretation |
7. Normal vs. Abnormal Serum Electrophoresis Patterns
Principle
Normal Serum Electrophoresis Pattern
     HIGH          ANODE (+)          CATHODE (-)
       │     │                                   │
       │     │ ALBUMIN (largest peak)             │
       │     │ /\                                │
       │     │/  \   α1  α2  β   γ               │
       │     │    \  /\  /\ /\  /\ (smaller)     │
Conc   │     │     \/  \/  \/  \/               │
       │     └───────────────────────────────────┘
LOW    │
| Band | Proteins | Normal % | Normal g/dL |
|---|---|---|---|
| Albumin | Albumin | ~60% | 3.5-5.0 |
| α1 (alpha-1) | A1AT, HDL, orosomucoid | 2-4% | 0.2-0.4 |
| α2 (alpha-2) | Haptoglobin, ceruloplasmin, α2-macroglobulin | 6-12% | 0.5-0.9 |
| β (beta) | Transferrin, LDL, C3, fibrinogen | 10-15% | 0.7-1.3 |
| γ (gamma) | Immunoglobulins (IgG, IgA, IgM, IgD, IgE) | 15-20% | 0.7-1.6 |
Abnormal Patterns
- Narrow, tall, sharp spike in γ (or β) region
- All molecules are identical (monoclonal = same Ig class + same light chain)
- Bence-Jones proteins (free light chains) in urine
- ↓ Normal immunoglobulins (immunoparesis)
- Broad, diffuse ↑ in γ region
- All Ig classes increased (polyclonal)
- Seen in: cirrhosis, SLE, HIV, chronic infections
- ↓ Albumin (lost in urine)
- ↑ α2 band (↑ α2-macroglobulin - too large to be lost)
- ↑ β band (↑ LDL due to compensatory synthesis)
- ↑ α1 and α2 bands (acute phase proteins)
- ↓ Albumin
- Normal γ
- Absent α1 band (A1AT is the major α1 protein)
- ↓ Albumin (↓ synthesis)
- ↓ α1, α2, β bands
- "β-γ bridging" in liver cirrhosis (IgA spans between β and γ)
- ↓ α2 band (haptoglobin consumed)
Summary Table
| Condition | Albumin | α1 | α2 | β | γ |
|---|---|---|---|---|---|
| Normal | ↔ | ↔ | ↔ | ↔ | ↔ |
| Myeloma | ↓ | ↓ | ↓ | ↔/↑ | M-spike ↑↑ |
| Nephrotic | ↓↓ | ↓ | ↑↑ | ↑ | ↓ |
| Cirrhosis | ↓ | ↓ | ↓ | ↑ | ↑ (polyclonal + β-γ bridge) |
| Acute inflammation | ↓ | ↑ | ↑ | ↔ | ↔ |
| A1AT deficiency | ↔ | ↓↓ | ↔ | ↔ | ↔ |
8. Infant Respiratory Distress Syndrome (IRDS) / Neonatal RDS
Definition
Pulmonary Surfactant - Biochemistry
- 90% phospholipids:
- Dipalmitoylphosphatidylcholine (DPPC) / Lecithin - the most important surfactant lipid (~40%)
- Phosphatidylglycerol (PG) - helps spreading
- Sphingomyelin - not a surfactant component (constant amount)
- 10% proteins: SP-A, SP-B, SP-C (hydrophobic, aid spreading), SP-D
- Reduces surface tension at the air-liquid interface of alveoli
- Prevents alveolar collapse at end-expiration (LaPlace law: P = 2T/r; ↓T → ↓P needed)
- Allows lungs to maintain FRC (functional residual capacity)
- Made by Type II pneumocytes (alveolar epithelial cells) - mature after 34-36 weeks gestation
- CDP-choline pathway (Kennedy pathway): Choline → Phosphocholine → CDP-choline → PC (lecithin)
- Surfactant stored in lamellar bodies → secreted into alveolar space
L:S Ratio (Lecithin:Sphingomyelin Ratio)
- Measured in amniotic fluid (amniocentesis)
- Lecithin rises with fetal lung maturity; sphingomyelin stays constant
- L:S ratio <2.0 → lung immaturity → high risk of IRDS
- L:S ratio ≥2.0 → lung maturity → low risk
- Phosphatidylglycerol (PG) present → additional marker of maturity
Pathophysiology
PREMATURITY (<34 weeks)
        │
        ▼
↓ Type II pneumocyte maturation
        │
        ▼
↓ Surfactant synthesis (↓ DPPC)
        │
        ▼
↑ Surface tension → alveolar collapse (atelectasis)
        │
        ▼
↓ Compliance, ↓ lung volume
        │
        ▼
Hypoxia → Acidosis
        │
        ▼
Pulmonary vasoconstriction → R→L shunt
        │
        ▼
Ischemic damage to Type II cells → ↓↓ surfactant
        │
        ▼
Protein-rich exudate → HYALINE MEMBRANE formation
(Fibrin + necrotic cells lining alveolar ducts)
Clinical Features
- Onset within 4-6 hours of birth (premature neonate)
- Tachypnea, grunting (attempts to maintain positive end-expiratory pressure), nasal flaring
- Intercostal and subcostal retractions
- Cyanosis
- CXR: Ground-glass opacity (bilateral fine granular haziness), air bronchograms, low lung volumes
Treatment
- Antenatal corticosteroids (betamethasone/dexamethasone) to mother >24 hrs before birth - accelerates fetal lung maturity, ↑ surfactant synthesis
- Exogenous surfactant replacement (intratracheal): Beractant (natural), Poractant alfa (Curosurf), Calfactant
- Oxygen support: CPAP (continuous positive airway pressure) or mechanical ventilation
- Supportive: warmth, nutrition, IV fluids
9. Jaundice
Definition
Bilirubin Metabolism - Biochemistry
HEME (from destroyed RBCs, 80%)
    │
    ▼  [Heme oxygenase] (in RES - liver, spleen, bone marrow)
BILIVERDIN + CO + Fe²⁺
    │
    ▼  [Biliverdin reductase]
BILIRUBIN (unconjugated / indirect)
(fat soluble, insoluble in water, TOXIC to brain)
    │
    ▼  Binds albumin for transport in blood
    │
    ▼  Enters hepatocytes via OATP transporters
    │
    ▼  [UDP-glucuronosyltransferase (UGT1A1)] in SER
BILIRUBIN DIGLUCURONIDE (conjugated / direct)
(water soluble, NON-toxic, can be excreted in bile)
    │
    ▼  Excreted into bile via MRP2 (canalicular transporter)
    │
    ▼  Intestine: [Bacterial β-glucuronidase]
UROBILINOGEN
    │
    ├──► 20% reabsorbed → portal blood → liver (enterohepatic circulation)
    │         small amount → blood → kidney → UROBILINOGEN IN URINE (normal)
    │
    └──► 80% → Oxidized in gut → STERCOBILIN (brown color of feces)
Classification of Jaundice
| Type | Cause | Bilirubin | Urine | Stool | Other |
|---|---|---|---|---|---|
| Pre-hepatic (Hemolytic) | ↑ RBC destruction (hemolysis) | ↑ Unconjugated | ↑ Urobilinogen; NO bilirubin | Normal/dark | ↑ LDH, ↓ haptoglobin |
| Hepatic (Hepatocellular) | Liver cell damage (hepatitis, cirrhosis) | ↑ Both (mixed) | Bilirubin + urobilinogen ↑ | Pale | ↑ AST, ALT, ↑ PT |
| Post-hepatic (Obstructive) | Bile duct obstruction (stones, cancer) | ↑ Conjugated | Bilirubin ++ ; NO urobilinogen | Pale/clay | ↑ ALP, GGT; dark urine, pruritus |
Specific Syndromes
| Syndrome | Defect | Bilirubin | Feature |
|---|---|---|---|
| Gilbert's syndrome | ↓ UGT1A1 (30%) | ↑ Unconjugated | Benign; fasting/stress triggers; no treatment needed |
| Crigler-Najjar type I | Complete absence of UGT1A1 | ↑↑↑ Unconjugated | Severe kernicterus; fatal without phototherapy/transplant |
| Crigler-Najjar type II | Partial UGT1A1 deficiency | ↑ Unconjugated | Responds to phenobarbitone |
| Dubin-Johnson syndrome | Defective MRP2 (canalicular transport) | ↑ Conjugated | Black liver (melanin-like pigment); benign |
| Rotor syndrome | Defective hepatic storage | ↑ Conjugated | Benign; normal liver |
Neonatal (Physiological) Jaundice
- Appears day 2-3; resolves by day 10-14
- Causes: immature UGT1A1, ↑ RBC breakdown, short-lived fetal Hb
- Unconjugated bilirubin crosses blood-brain barrier → Kernicterus (if severe)
- Treatment: Phototherapy (converts bilirubin to water-soluble isomers); exchange transfusion
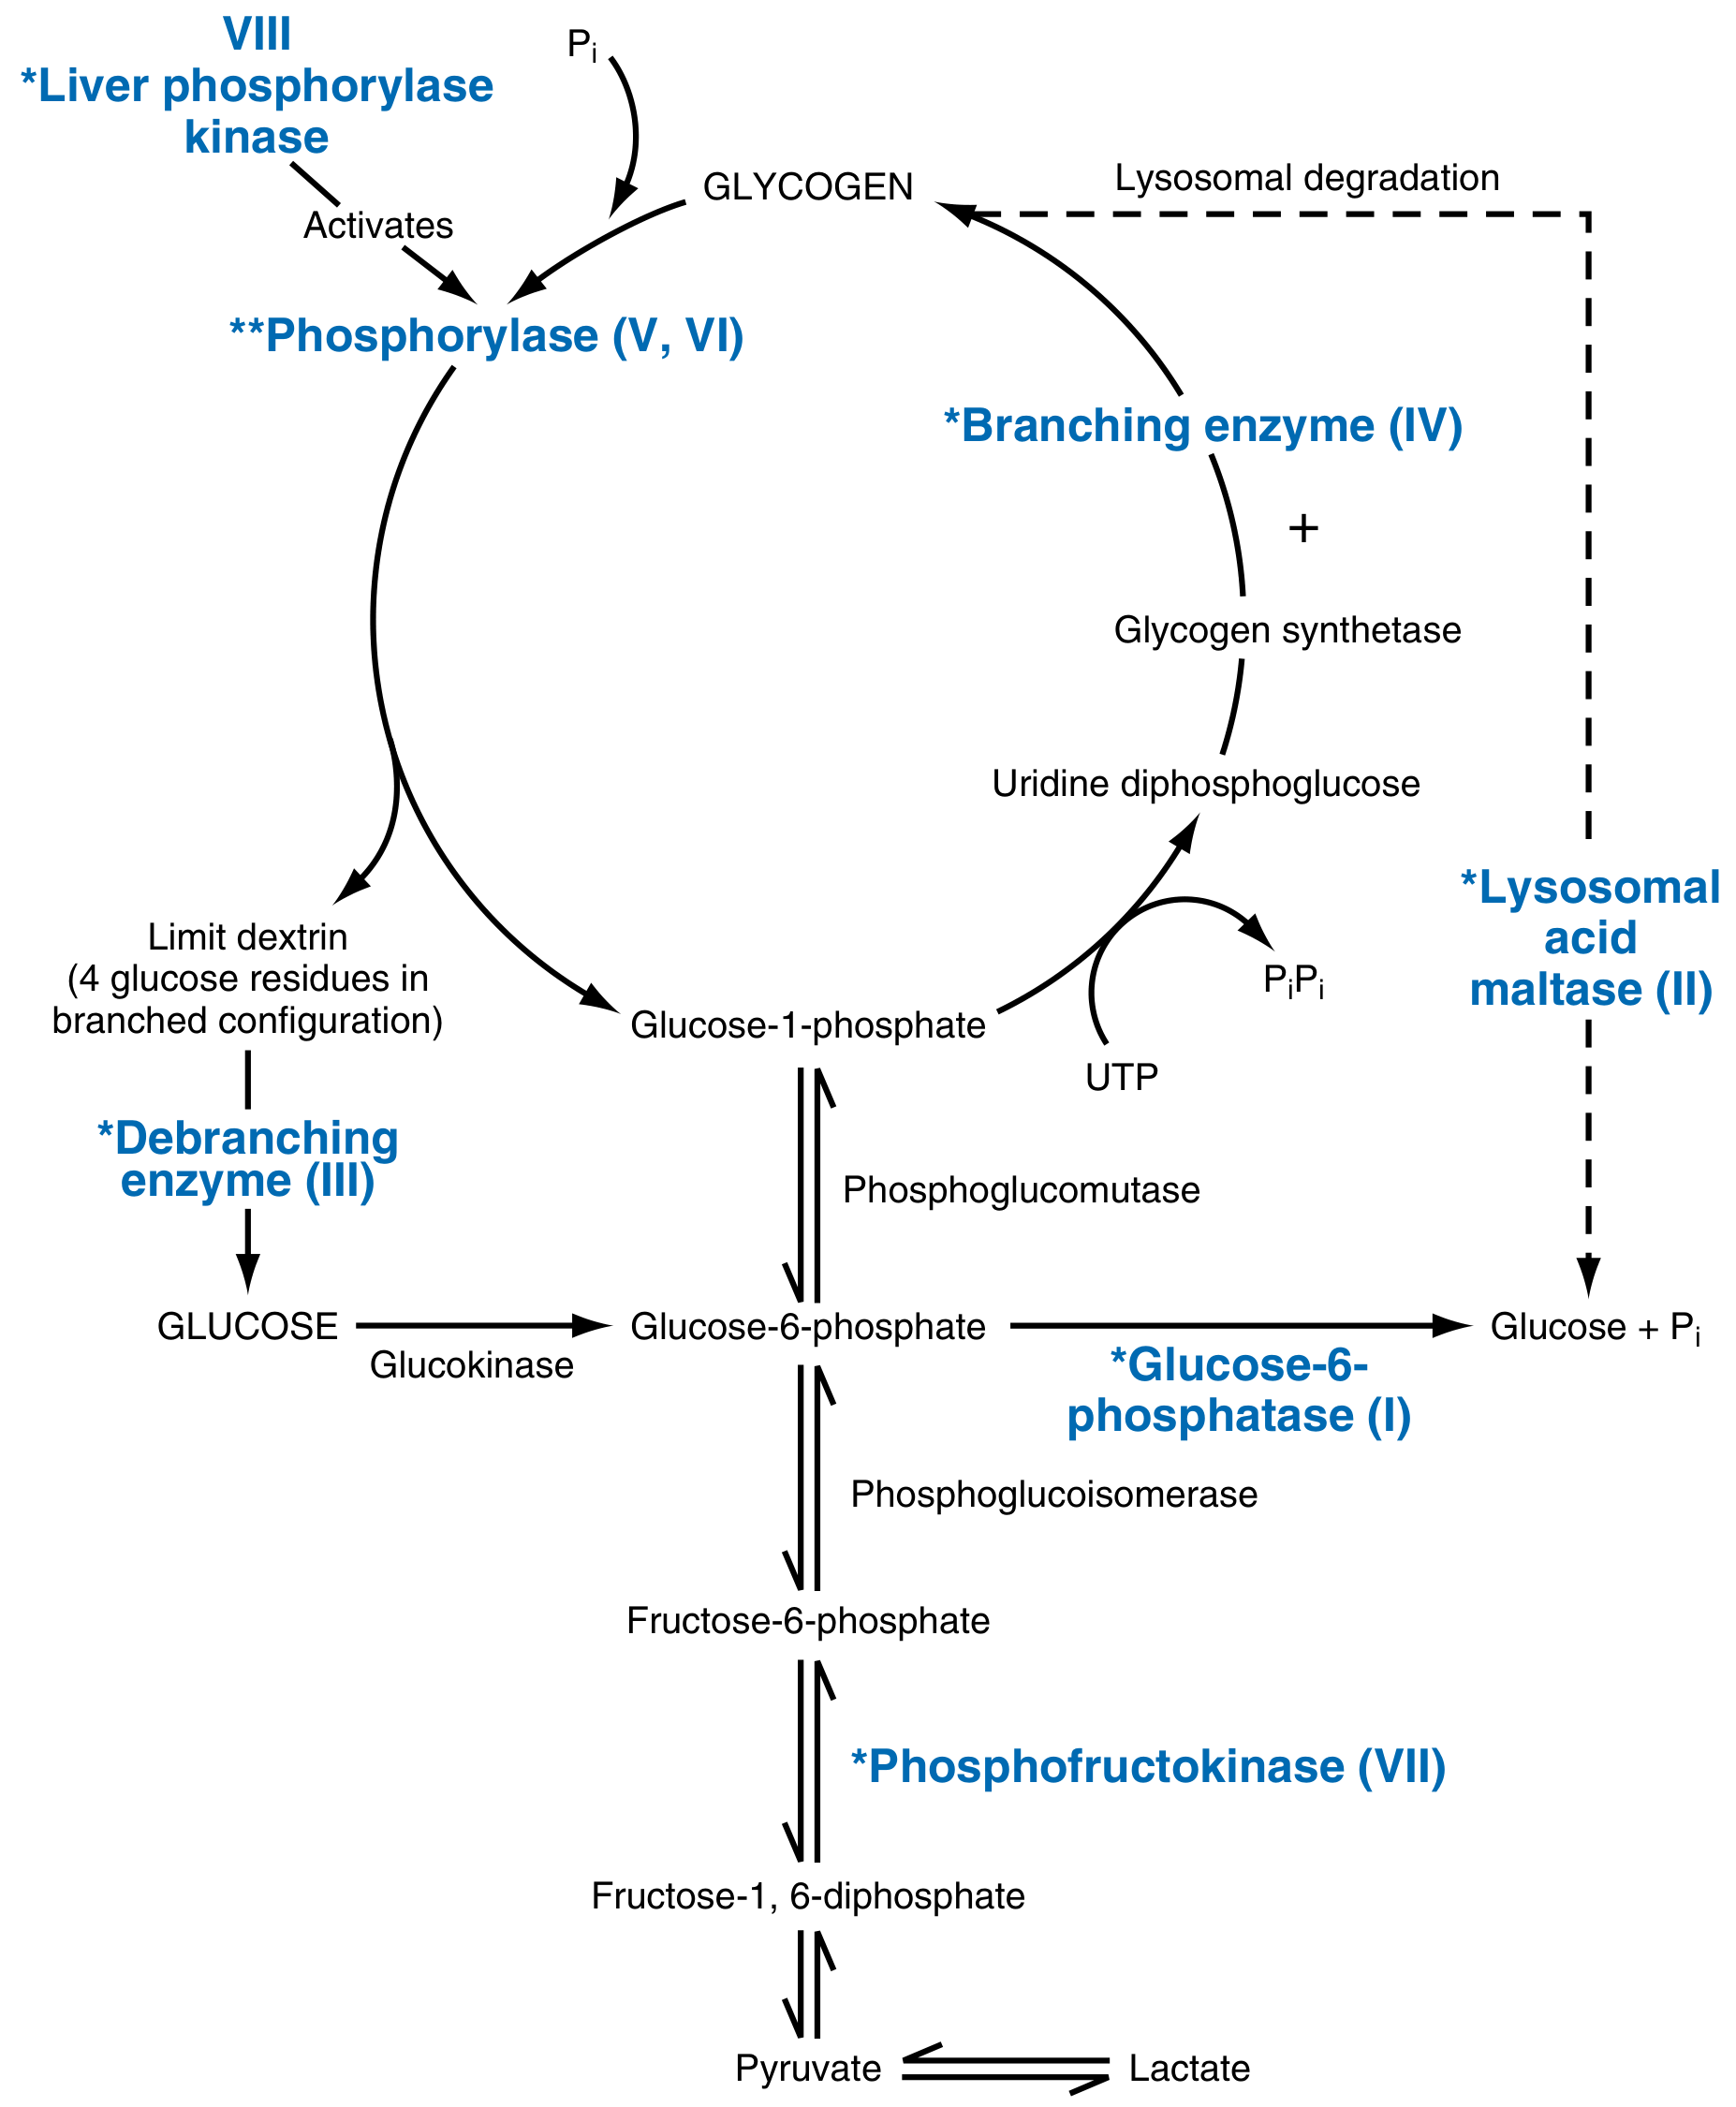
10. Glycogen Storage Disorders (Glycogenoses)
Definition
Glycogen Metabolism Overview
GLYCOGEN SYNTHESIS:
Glucose → G-6-P → G-1-P → UDP-Glucose → GLYCOGEN
                     [Glycogen synthase + Branching enzyme]

GLYCOGEN DEGRADATION:
GLYCOGEN → G-1-P [Glycogen phosphorylase]
         → G-6-P [Phosphoglucomutase]
         → Free GLUCOSE [Glucose-6-phosphatase] (liver only)
         [Debranching enzyme] needed at branch points
         [Lysosomal acid maltase] degrades lysosomal glycogen
Classification
| Type | Name | Enzyme Deficient | Organs | Key Feature |
|---|---|---|---|---|
| 0 | — | Glycogen synthase | Liver | Fasting hypoglycemia + postprandial hyperglycemia (no glycogen made) |
| Ia | Von Gierke | Glucose-6-phosphatase (G6PC) | Liver, Kidney | Hepatomegaly, hypoglycemia, lactic acidosis, hyperuricemia, hyperlipidemia |
| Ib | Von Gierke variant | G6P translocase (SLC37A4) | Liver, kidney, neutrophils | Same as Ia + neutropenia + IBD |
| II | Pompe | Lysosomal acid α-glucosidase (GAA) | All organs (heart dominant) | Massive cardiomegaly, hypotonia, death <2 yrs; enzyme replacement available |
| III | Cori/Forbes | Debranching enzyme (AGL) | Liver, heart, muscle | Mild hepatomegaly, hypoglycemia, progressive myopathy |
| IV | Andersen | Branching enzyme (GBE1) | Liver, all tissues | Abnormal glycogen structure → cirrhosis, liver failure |
| V | McArdle | Muscle phosphorylase | Skeletal muscle | Exercise-induced cramps, no blood lactate rise on exercise, myoglobinuria |
| VI | Hers | Liver phosphorylase | Liver | Mild hepatomegaly, hypoglycemia; benign course |
| VII | Tarui | Muscle phosphofructokinase | Muscle, RBCs | Like McArdle + hemolytic anemia |
| IX | — | Phosphorylase kinase | Liver | Mild; X-linked; often benign |
High-Yield Points
- Most common: GSD Type I (Von Gierke)
- Hepatic + hypoglycemia: Types I, III, VI, IX
- Muscle + cramps: Types V, VII
- Cardiac dominant: Type II (Pompe) - ONLY GSD with enzyme replacement therapy (alglucosidase alfa)
- Lysosomal: Type II (Pompe) - only one; others are cytoplasmic
- Liver failure/cirrhosis: Type IV (Anderson)
- All autosomal recessive except Type IX (X-linked)
Key Biochemistry - GSD Type I (Von Gierke)
- G6P accumulates → diverted to: ↑ glycolysis → lactic acidosis; ↑ HMP shunt → hyperuricemia; ↑ lipogenesis → hyperlipidemia
- Both glycogenolysis AND gluconeogenesis blocked (both converge on G6P → G6Pase step)
- Treatment: Uncooked cornstarch (UCCS) to maintain euglycemia; avoid fructose/galactose
11. Clinical Significance of Competitive Inhibitors as Drugs
Definition of Competitive Inhibition
Kinetics (Michaelis-Menten)
- Vmax: UNCHANGED (can still be achieved with excess substrate)
- Km (apparent): INCREASED (↑ substrate needed to achieve half-Vmax)
- Lineweaver-Burk plot: Lines intersect on Y-axis (same Vmax; different x-intercept)
Clinically Important Competitive Inhibitor Drugs
- Enzyme: HMG-CoA reductase (rate-limiting step in cholesterol synthesis)
- Substrate: HMG-CoA
- Inhibitor: Statins (Atorvastatin, Simvastatin, Rosuvastatin) - structural analog of HMG-CoA
- Effect: ↓ Cholesterol synthesis in liver → ↑ LDL receptors → ↓ serum LDL
- Clinical use: Hypercholesterolemia, CVD prevention
- Enzyme: DHFR (converts dihydrofolate → tetrahydrofolate, needed for purine and thymidylate synthesis)
- Inhibitor: Methotrexate (cancer/autoimmune), Trimethoprim (antibacterial), Pyrimethamine (antiprotozoal)
- Effect: ↓ THF → ↓ nucleotide synthesis → ↓ cell proliferation
- Clinical use: Leukemia, rheumatoid arthritis, UTI, malaria
- Enzyme: Xanthine oxidase (converts hypoxanthine → xanthine → uric acid)
- Inhibitor: Allopurinol (→ converted to oxipurinol, BOTH competitive and non-competitive)
- Effect: ↓ Uric acid production
- Clinical use: Gout, hyperuricemia in GSD Type I/tumor lysis syndrome
- Enzyme: ACE (converts Angiotensin I → Angiotensin II; degrades bradykinin)
- Inhibitor: Captopril, Enalapril, Lisinopril (competitive inhibitors at active site)
- Effect: ↓ Angiotensin II (↓ vasoconstriction, ↓ aldosterone) + ↑ bradykinin (cough/angioedema)
- Clinical use: Hypertension, heart failure, diabetic nephropathy
- Enzyme: PDE-5 (degrades cGMP in smooth muscle of blood vessels)
- Inhibitor: Sildenafil (competitive inhibitor, structural analog of cGMP)
- Effect: ↑ cGMP → smooth muscle relaxation → vasodilation
- Clinical use: Erectile dysfunction, pulmonary arterial hypertension
- Enzyme: DOPA decarboxylase (converts L-DOPA → dopamine peripherally)
- Inhibitor: Carbidopa (does not cross BBB)
- Effect: ↑ L-DOPA reaches brain; ↓ peripheral dopamine side effects (nausea, vomiting)
- Clinical use: Parkinson's disease (combined with Levodopa)
- Inhibitor: Aspirin - irreversibly acetylates COX-1 and COX-2 active site serine
- Effect: ↓ Prostaglandin + thromboxane A₂ synthesis → analgesia, anti-inflammatory, antiplatelet
- Note: Technically irreversible competitive inhibition (special case)
- Enzyme: Ornithine decarboxylase (rate-limiting step in polyamine synthesis)
- Inhibitor: Eflornithine (also inhibits hair follicle cell growth)
- Clinical use: African sleeping sickness, facial hirsutism
Pharmacological Principle: Why Competitive Inhibitors Are Useful Drugs
ADVANTAGES OF COMPETITIVE INHIBITION:

1. SELECTIVITY: Drug mimics substrate → targets specific enzyme active site
   → Fewer off-target effects

2. REVERSIBILITY: Inhibition can be reversed by ↑ substrate OR by removing drug
   → Safer; titratable dose-response

3. ENZYME ACTIVE SITE is a DRUG TARGET:
   Substrate analog → blocks pathway precisely at the key step

4. ADJUSTABLE EFFECT:
   Doubling dose doubles effect (unlike irreversible inhibitors)

5. COMPETITIVE RESCUE possible:
   If accidental overdose: supplement with substrate can
   overcome inhibition (e.g., folinic acid rescue after MTX)
Summary Table
| Drug | Target Enzyme | Competitive With | Clinical Use |
|---|---|---|---|
| Statins | HMG-CoA reductase | HMG-CoA | Hypercholesterolemia |
| Methotrexate | DHFR | Dihydrofolate | Cancer, RA |
| Allopurinol | Xanthine oxidase | Hypoxanthine/xanthine | Gout |
| ACE inhibitors | ACE | Angiotensin I | Hypertension, HF |
| Sildenafil | PDE-5 | cGMP | ED, PAH |
| Carbidopa | DOPA decarboxylase | L-DOPA | Parkinson's |
| Trimethoprim | DHFR (bacterial) | Dihydrofolate | UTI, PCP |
Create a MBBS biochemistry short notes PDF with all 11 topics
✅ MBBS Biochemistry Short Notes PDF
MBBS Biochemistry Short Notes
PDF Document · PDF
What's inside (12 pages, A4, print-ready):
| # | Topic | Highlights |
|---|---|---|
| 1 | G-6-PD Deficiency | HMP shunt flowchart, PRIMA mnemonic, lab table |
| 2 | Metabolic Acidosis | MUDPILES/HARD UP classification, Winter's formula, ABG table |
| 3 | Diabetes Complications | 4-pathway biochemistry table, micro/macrovascular features, DKA vs HHS |
| 4 | Protein Misfolding | Folding vs. misfolding diagram, disease table, prion mechanism |
| 5 | Hyperkalemia & Hypokalemia | Causes table, ECG changes in order, A-C-D-D-D-D treatment |
| 6 | Acute Phase Proteins | Positive and negative APP tables with clinical uses |
| 7 | Serum Electrophoresis | Normal fractions + 7 abnormal pattern comparisons |
| 8 | IRDS | Surfactant biochemistry, L:S ratio, Kennedy pathway, pathophysiology |
| 9 | Jaundice | Full bilirubin metabolism flowchart, 3-type comparison table, syndromes |
| 10 | Glycogen Storage Disorders | All GSD types table, Type I biochemistry flowchart |
| 11 | Competitive Inhibitors | 9 clinical drug examples, kinetics table, why useful as drugs |
It’s not open
✅ Download Your PDF
MBBS Biochemistry Short Notes LO
PDF Document · PDF
- G-6-PD Deficiency
- Metabolic Acidosis
- Complications of Diabetes Mellitus
- Protein Misfolding Disorders
- Hyperkalemia & Hypokalemia
- Acute Phase Plasma Proteins
- Normal vs. Abnormal Serum Electrophoresis
- Infant Respiratory Distress Syndrome
- Jaundice
- Glycogen Storage Disorders
- Competitive Inhibitors as Drugs
Still it’s not open
✅ Download Your PDF
Biochemistry Short Notes
PDF Document · PDF
- Right-click the link → Save As → then open the saved file
- Open it in your browser directly (Chrome, Firefox, Safari all have built-in PDF viewers)
- On mobile, use Adobe Acrobat Reader or Google Drive to open

Short note on these topics for mbbs biochemistry exam and give me a pdf with answer