
These are the changes in ischemia, injury, and infarction, and the difference between them.
myocardial ischemia electrocardiography
ECG changes ischemia injury infarction ST T wave pathological Q wave authoritative
https://www.ahajournals.org/doi/10.1161/circulationaha.108.1…
| Stage | What it means | Typical ECG change | Reversibility |
|---|---|---|---|
| Ischemia | Inadequate oxygen supply to viable myocardium | T-wave inversion and/or ST-segment depression | Usually reversible if perfusion is restored |
| Injury | More severe, acute myocardial damage, often from transmural ischemia | ST-segment elevation in contiguous leads, often with reciprocal ST depression | May be reversible early, but signals threatened infarction |
| Infarction | Irreversible myocyte necrosis after prolonged ischemia | Development of pathological Q waves and reduced/absent R-wave progression; ST elevation may later resolve and T waves may invert | Irreversible necrosis |
ECG evolution in an acute transmural MI
- Hyperacute T waves: tall, broad T waves may occur very early.
- Acute injury pattern: ST elevation in anatomically contiguous leads.
- Infarction pattern: pathological Q waves can develop over hours to days.
- Evolution: ST segments often return toward baseline; T-wave inversion may persist. Q waves may persist permanently, though not in every infarct.
Practical distinction
- Ischemia affects repolarization, hence T-wave and ST-depression changes.
- Injury produces an acute ST-elevation pattern and needs urgent assessment for acute coronary occlusion.
- Infarction means cell death has occurred. Diagnosis requires a rise and/or fall in cardiac troponin with evidence of acute ischemia, such as symptoms, ischemic ECG changes, imaging evidence, or coronary thrombus. Myocardial injury on troponin testing can also occur without infarction, for example in myocarditis, heart failure, pulmonary embolism, or severe supply-demand imbalance. Fuster and Hurst's definition distinguishes ischemic from non-ischemic myocardial injury. Fuster and Hurst's The Heart, 15th ed., p. 646.
Important caution
- ST elevation is not always MI, such as in pericarditis, early repolarization, ventricular aneurysm, or Brugada pattern.
- An MI can occur without ST elevation (NSTEMI).
- Pathological Q waves are suggestive of prior or evolving infarction but are neither required nor invariably permanent.
What does reciprocal changes mean in an ECG?
ECG acute inferior ST elevation myocardial infarction reciprocal ST depression leads I aVL
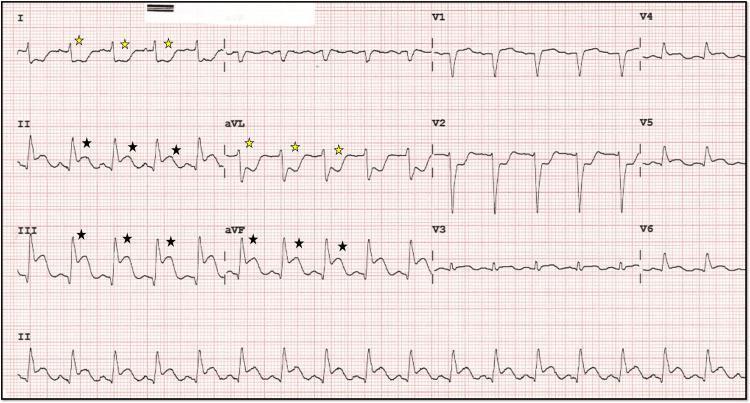
A 12-lead electrocardiogram (ECG) demonstrating diagnostic findings of an acute inferior wall myocardial infarction (ST-elevation myocardial infarction, or STEMI). The primary findings include significant ST-segment elevation in the inferior leads (II, III, and aVF), marked with black stars. Concurrently, there is evidence of reciprocal ST-segment depression in the high lateral leads (I and aVL), indicated by yellow stars. The precordial leads (V1-V3) also exhibit prominent ST-segment depression, which can suggest posterior wall involvement or reciprocal changes from the inferior injury. The inferior leads show a 'shark fin' morphology, characterized by a fusion of the QRS complex, ST segment, and T wave, typically indicating a large area of transmural ischemia. The rhythm appears to be a junctional or sinus bradycardia/tachycardia depending on the clinical phase, with evident electrical instability. This ECG is a critical educational example for identifying acute coronary syndrome and understanding the relationship between anatomical lead groups and reciprocal changes.
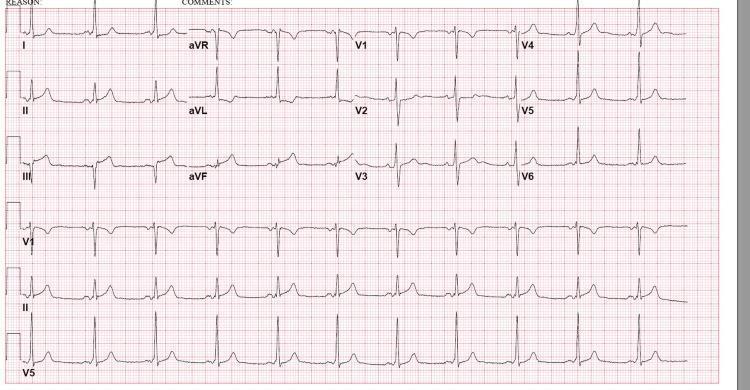
This diagnostic image is a 12-lead electrocardiogram (ECG) demonstrating signs of an acute inferior wall ST-elevation myocardial infarction (STEMI). The tracing reveals significant ST-segment elevation in the inferior leads (II, III, and aVF), with the elevation being most pronounced in lead III compared to lead II. Accompanying these changes is evidence of reciprocal ST-segment depression and T-wave inversion in the high lateral leads, specifically I and aVL. The precordial leads (V1-V6) show preserved R-wave progression without significant ST-segment deviations or QRS widening. The rhythm appears to be sinus bradycardia with a regular rate. This ECG is a classic representation of acute myocardial ischemia or infarction involving the territory of the right coronary artery (RCA). It serves as an educational tool for identifying inferior STEMI patterns, understanding reciprocal changes in lateral leads, and differentiating localized ST elevations from diffuse patterns.
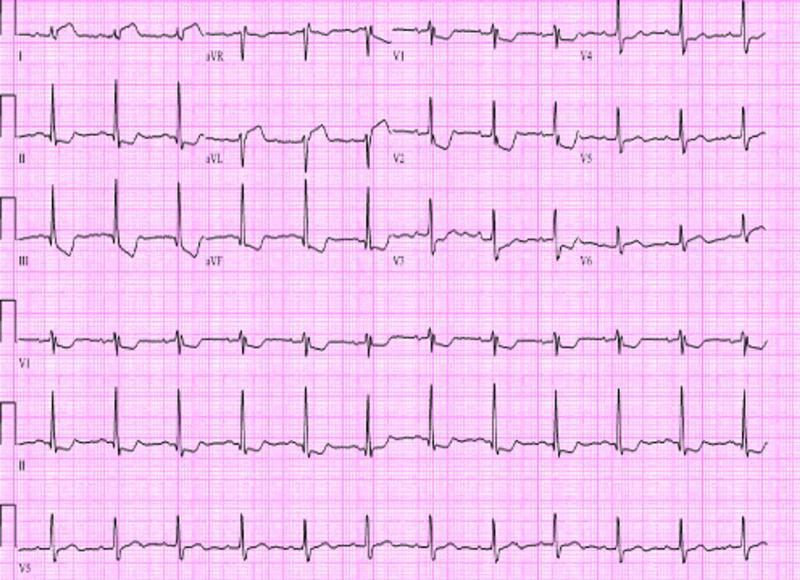
A 12-lead electrocardiogram (ECG) demonstrating visual evidence of an acute ST-elevation myocardial infarction (STEMI) with inferior and posterior wall involvement. The diagnostic image shows significant ST-segment elevation in the inferior leads (II, III, and aVF). Reciprocal ST-segment depression is visible in the lateral leads (I and aVL). Furthermore, the precordial leads V1 through V3 exhibit prominent R waves and marked ST-segment depression, which are highly suggestive of a concomitant posterior wall infarction. ST-T wave changes also extend into the lateral precordial leads (V4-V6). The QRS complexes appear relatively narrow, and the underlying rhythm is consistent with sinus tachycardia. This ECG illustrates the visual presentation of an acute coronary syndrome resulting from left circumflex artery or right coronary artery occlusion, emphasizing the importance of recognizing both primary elevations and reciprocal changes for comprehensive cardiac triage.
myocardial infarction reciprocal ST depression electrocardiography
reciprocal ST segment changes ECG myocardial infarction educational review
Example: inferior STEMI
- ST elevation: leads II, III, aVF indicate inferior-wall injury.
- Reciprocal ST depression: leads I and aVL, which view the high lateral wall from an opposing angle.
Why it matters
Another important pattern
Explain facts about Chauhan Vansh in Rajasthan.
Chauhan dynasty Rajasthan history Ajmer Sambhar Nadol official sources