
Role of bone densitometry in clinical practice
"bone densitometry" AND "clinical practice" AND osteoporosis
DXA bone densitometry T-score Z-score osteoporosis BMD graph
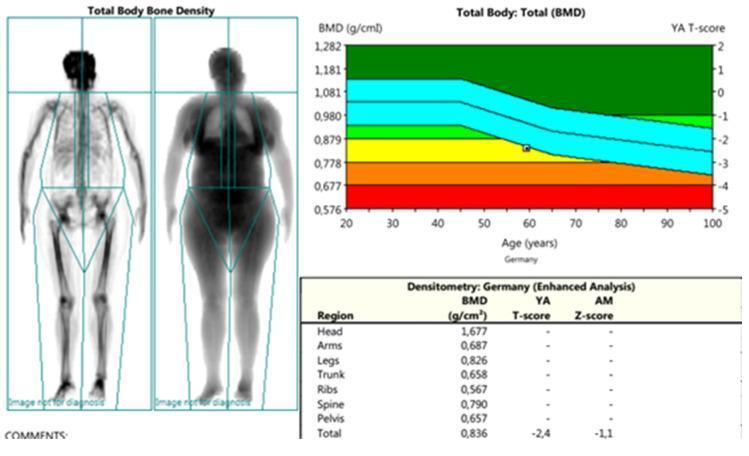
A multi-panel medical diagnostic image showing a Dual-energy X-ray Absorptiometry (DXA) total body composition and bone mineral density (BMD) analysis. The left panel displays two whole-body scans in posterior projection: a skeletal rendering and a soft tissue attenuation map, with cyan-colored region-of-interest (ROI) boxes defining segments for head, trunk, arms, legs, pelvis, and spine. The top-right panel features a scatter plot graph titled 'Total Body: Total (BMD)' comparing the patient's BMD (g/cm²) against age-matched reference data for Germany. The graph uses a color-coded T-score scale: green (normal), yellow (osteopenia), and orange/red (osteoporosis), with the patient's data point positioned at approximately age 60 in the yellow zone. The bottom-right panel contains a 'Densitometry: Germany (Enhanced Analysis)' table, providing regional BMD values. The total body BMD is recorded as 0.836 g/cm², with a corresponding T-score of -2.4 and a Z-score of -1.1, indicating low bone mass (osteopenia) bordering on osteoporosis. This clinical image is typical for metabolic bone disease assessment and fracture risk stratification in geriatric or rheumatological populations.
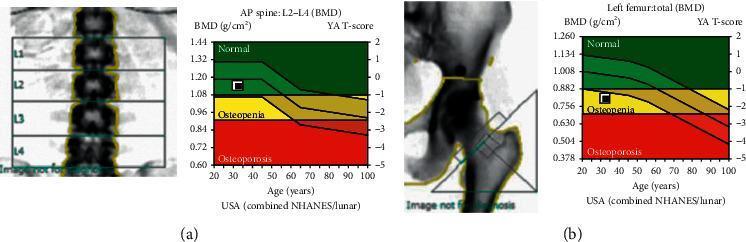
Dual-energy X-ray absorptiometry (DXA) report illustrating bone mineral density (BMD) assessments for the lumbar spine and left femur. Figure (a) displays an AP spine scan of vertebrae L1-L4 alongside a BMD graph for L2-L4. The graph plots BMD (g/cm²) and Young Adult (YA) T-score against age (20-100 years), categorized into WHO-defined zones: Normal (green, T-score > -1.0), Osteopenia (yellow, T-score between -1.0 and -2.5), and Osteoporosis (red, T-score < -2.5). The patient's data point (1.140 g/cm², Z-score -0.4) is located within the normal zone. Figure (b) shows the DXA scan of the left hip/femur with a corresponding graph for the total femur. The patient's measurement (0.807 g/cm², Z-score -1.4) is plotted within the yellow osteopenia zone. These visuals serve as diagnostic tools for evaluating skeletal health and fracture risk in the context of metabolic bone diseases like Hereditary Hypophosphatemic Rickets with Hypercalciuria (HHRH).
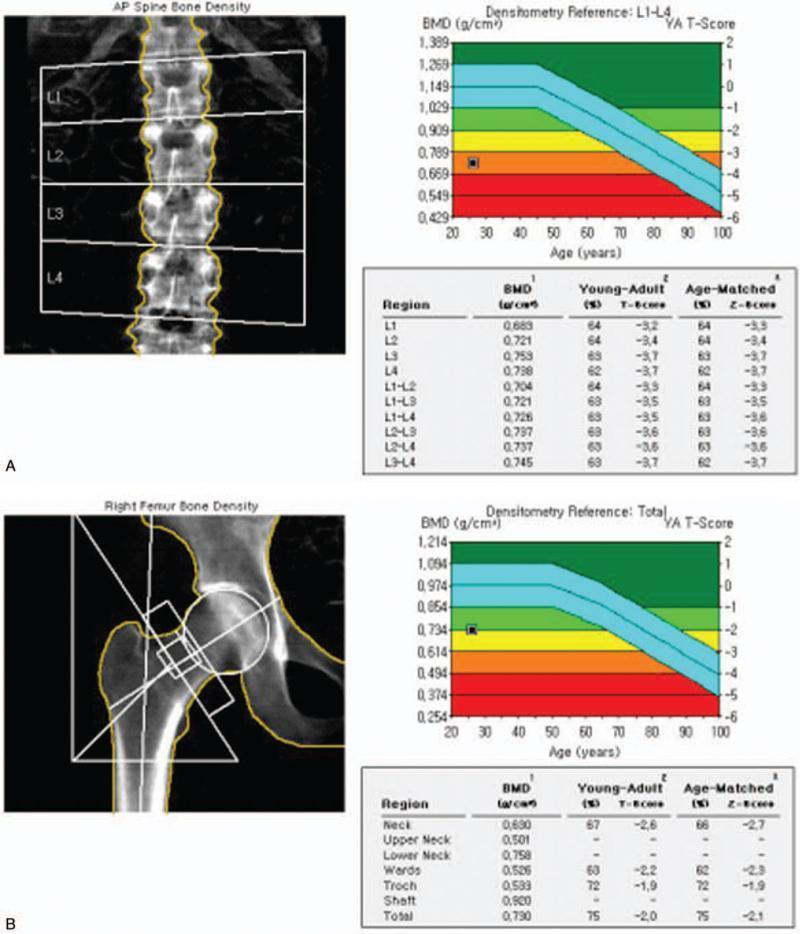
This diagnostic visual comprises two dual-energy X-ray absorptiometry (DXA) scan reports, labeled A and B, assessing bone mineral density (BMD). Panel A displays an anteroposterior (AP) view of the lumbar spine (L1-L4). It includes the scout image with vertebrae segmentation, a densitometry reference graph, and a data table. The graph plots the patient's BMD against age-matched reference ranges, showing a data point in the red zone (high fracture risk). The L1-L4 combined T-score is -3.5, indicating significant osteoporosis. Panel B illustrates a DXA scan of the right femur, including the femoral neck and total hip regions. The corresponding graph shows the patient's data point in the yellow-to-orange osteopenic/osteoporotic threshold, with a total hip T-score of -2.0 and a femoral neck T-score of -2.6. Both reports provide detailed metrics including BMD (g/cm²), Young-Adult T-scores, and Age-Matched Z-scores for multiple sub-regions, serving as a clinical standard for diagnosing bone density disorders and evaluating fracture risk.
Role of Bone Densitometry in Clinical Practice
1. What Is Bone Densitometry?
- T-score: BMD compared to a young healthy adult (age 30, same sex and race). Each unit = 1 SD.
- Z-score: BMD compared to an age- and sex-matched reference. Used in pre-menopausal women and men under 50.
2. WHO Diagnostic Classification (T-score Based)
| T-score | Diagnosis |
|---|---|
| > -1.0 | Normal BMD |
| -1.0 to -2.5 | Low bone mass (osteopenia) |
| ≤ -2.5 | Osteoporosis |
| ≤ -2.5 + fragility fracture | Severe (established) osteoporosis |
Note: Because >50% of fragility fractures occur in individuals with osteopenia (T-score between -1.0 and -2.5), T-score alone is insufficient. Absolute fracture risk assessment using FRAX is therefore an essential complement to BMD. - Harrison's Principles of Internal Medicine 22E, p. 3340
3. Measurement Sites
- Lumbar spine (L1-L4) - preferred in younger, perimenopausal women; more sensitive for early bone loss
- Proximal femur (total hip + femoral neck) - preferred site overall; best predictor of hip fracture risk
- Distal radius (33% radius) - used when hip/spine cannot be measured (e.g., prior surgery, implants, severe degenerative disease)
- DXA is a 2D scan and cannot measure bone depth, so small, slim individuals tend to have falsely low BMD
- Osteophytes and spinal spondylosis falsely increase lumbar spine BMD in older patients, making it an unreliable site in that group
- Serial measurements should be performed on the same machine and preferably by the same technician, as different manufacturers yield different absolute values
- The femoral neck is particularly susceptible to inter-machine variation
4. Indications for Bone Densitometry
- All women aged ≥65 years, regardless of risk factors
- Postmenopausal women aged <65 years with one or more additional risk factors (early menopause, family history of hip fracture, low body weight, smoking, excessive alcohol)
- Women in the menopausal transition with clinical risk factors
- Men aged ≥70 years, regardless of risk factors
- Men aged 50-69 with clinical risk factors for fracture
- Adults with a fragility fracture at age ≥50
- Patients on glucocorticoids (>5 mg prednisone/day for >3 months)
- Patients with conditions causing secondary osteoporosis: rheumatoid arthritis, hyperparathyroidism (primary or secondary), malabsorption, hypogonadism, chronic renal/hepatic disease
- Radiographic evidence of vertebral abnormality or osteopenia
- Patients being considered for anti-osteoporotic therapy when BMD would influence the decision
- Monitoring therapy response in patients already on treatment
5. Fracture Risk Assessment - FRAX
| FRAX Inputs |
|---|
| Age, sex, height, weight |
| Prior fragility fracture |
| Parental history of hip fracture |
| Current smoking |
| Alcohol use >2 units/day |
| Glucocorticoid use |
| Rheumatoid arthritis |
| Secondary causes of osteoporosis |
| Femoral neck BMD (optional) |
- Major osteoporotic fracture (hip, clinical spine, wrist, proximal humerus)
- Hip fracture alone
- 10-year hip fracture risk ≥ 3%, OR
- 10-year major osteoporotic fracture risk ≥ 20%
- Most accurate in untreated patients - should not be used to assess fracture risk in those on pharmacotherapy
- Does not account for fall risk, vertebral fracture severity, recent vs. remote fractures, glucocorticoid dose, diabetes, COPD, immobilization, or epilepsy
- Does not mandate vertebral fracture diagnosis as an additional input
- FRAX 2.0 is expected to address several of these gaps
6. Vertebral Fracture Assessment (VFA)
- 70% of vertebral fractures are asymptomatic
- A prevalent vertebral fracture independently raises fracture risk by 4-5x
- VFA is lower radiation and more convenient than full spinal radiographs, though slightly less definitive
| Age group | Trigger |
|---|---|
| Women ≥70, men ≥80 | BMD T-score < -1.0 anywhere |
| Women 65-69, men 70-79 | BMD T-score < -1.5 |
| Postmenopausal women and men ≥50 | Fragility fracture, height loss >4 cm, glucocorticoid use |
7. Comparison of Bone Imaging Modalities
| Technique | Diagnostic Use | Radiation | Vertebral Fracture Assessment | Notes |
|---|---|---|---|---|
| DXA | +++ | Low (+) | + | Gold standard, widely available |
| Quantitative Ultrasound | - | None | - | Portable, low cost; screening only |
| QCT | + | High (+++) | + | Measures cortical + trabecular bone separately |
| MRI | - | None | + | Best for fracture acuity/edema assessment |
| HRpQCT/FEA | - | Low (+) | - | Research tool; optimal for microarchitecture |
| Biomechanical CT (BCT) | + (FDA-approved) | +++ | + | Useful when DXA not feasible (prior implants) |
8. Monitoring Treatment Response
- A minimum significant change (MSC) in BMD must exceed the precision error of the machine to be clinically meaningful (typically 2-3% at the spine, 3-6% at the hip)
- Same machine and same technician are recommended for serial measurements
- In general, repeat DXA is performed every 1-2 years during active treatment; intervals may be extended to 3-5 years in stable patients or those with low baseline risk
- Biochemical markers of bone turnover (osteocalcin, bone-specific alkaline phosphatase, serum CTX, urine NTX) can complement DXA by detecting early treatment response within 3-6 months, before BMD changes become apparent
9. Special Populations and Limitations
- Children: Z-scores are mandatory (not T-scores); compare to age, sex, and pubertal stage norms. Spine BMD and total-body-less-head (TBLH) are preferred sites.
- Premenopausal women and men <50: Use Z-scores. Diagnosis of osteoporosis should not be made on BMD alone in these groups without secondary causes.
- Obesity/bariatric patients: DXA may underestimate fracture risk; body habitus can exceed scan table limits.
- Paget's disease, severe OA, prior fractures at the scan site: Can falsely elevate BMD, making the site unreliable.
- Plain radiography can only detect bone loss once >25% of density is lost and is not appropriate for diagnosis or monitoring.
Summary
| Role | Tool |
|---|---|
| Diagnosis of osteoporosis | DXA T-score (spine/hip) |
| Fracture risk estimation | FRAX ± BMD |
| Screening trigger decision | NOF/USPSTF indications |
| Asymptomatic vertebral fracture detection | DXA-VFA |
| Treatment monitoring | Serial DXA (same machine) |
| Early treatment response | Bone turnover markers |
| When DXA not feasible | BCT (FDA-approved) |