
Replication of herpes simplex virus
herpes simplex virus replication cycle diagram
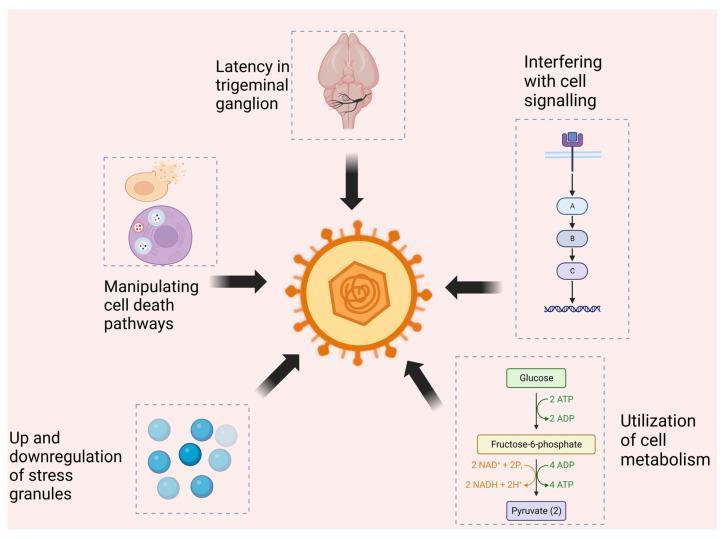
A pathophysiology diagram illustrating the survival and replication strategies of Herpes Simplex Virus 2 (HSV-2). At the center is a simplified illustration of an enveloped virus with surface glycoproteins. Five distinct panels surround the virus, connected by inward-pointing arrows, representing various mechanisms of host-pathogen interaction. 1) Top: An anatomical illustration of the human brain and trigeminal nerve, labeled 'Latency in trigeminal ganglion.' 2) Top Right: A signaling pathway diagram showing a surface receptor leading to a downstream cascade (molecules A, B, and C) terminating at a DNA strand, labeled 'Interfering with cell signalling.' 3) Bottom Right: A metabolic pathway schematic showing the conversion of Glucose to Fructose-6-phosphate and finally to Pyruvate, labeled 'Utilization of cell metabolism.' 4) Bottom Left: A collection of blue spheres representing protein aggregates, labeled 'Up and downregulation of stress granules.' 5) Middle Left: A cellular diagram depicting cytoplasmic changes, labeled 'Manipulating cell death pathways.' The diagram summarizes how HSV-2 influences host cell physiology, metabolism, and immune signaling to facilitate lifelong infection and periodic reactivation.
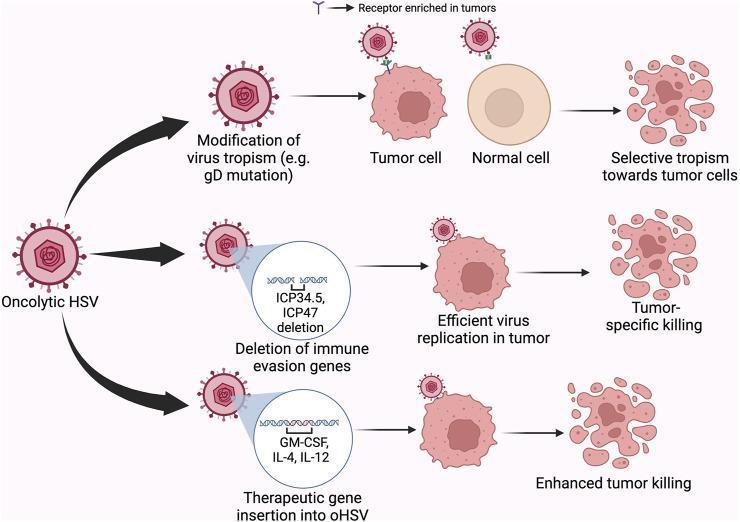
This pathophysiology diagram illustrates three distinct engineering strategies for modifying Oncolytic Herpes Simplex Virus (oHSV) to achieve targeted tumor eradication. The flowchart progresses from a baseline oHSV particle through three pathways: 1) Modification of virus tropism (e.g., gD mutation), which demonstrates selective binding to 'receptors enriched in tumors' on malignant cells while sparing normal cells, leading to selective tropism. 2) Deletion of immune evasion genes (specifically ICP34.5 and ICP47), which promotes efficient virus replication within the tumor environment, resulting in tumor-specific killing. 3) Therapeutic gene insertion (GM-CSF, IL-4, IL-12) into the oHSV genome to stimulate the host immune response, resulting in enhanced tumor killing. The final stage of each pathway depicts the visual disintegration or lysis of the irregularly shaped tumor cells into fragments. The diagram utilizes standard medical iconography for viral structures, DNA sequences, and cell morphology to explain the mechanisms of viro-immunotherapy in oncology.
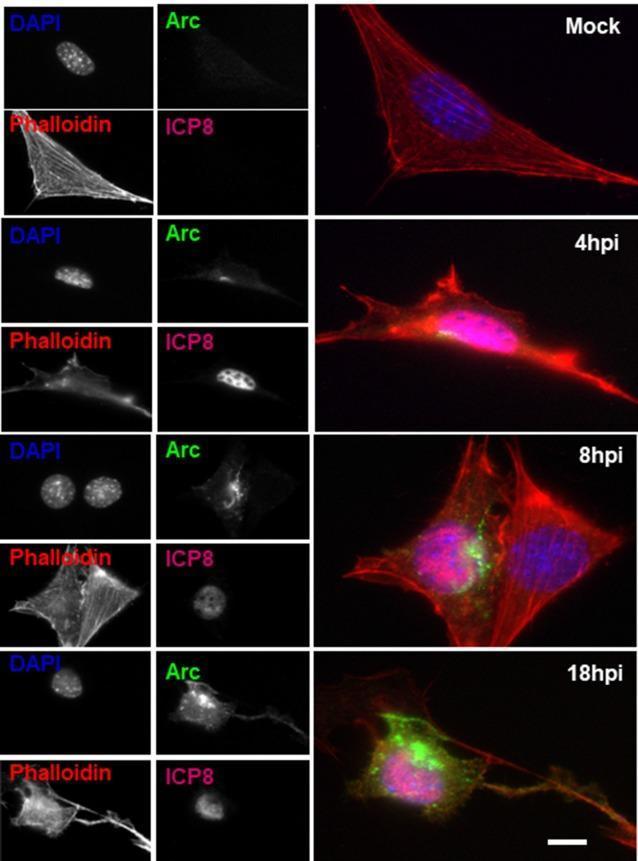
This diagnostic image consists of multi-channel immunofluorescence microscopy panels demonstrating the temporal progression of Herpes Simplex Virus type 1 (HSV-1) infection in HT22 neuronal cells at four time points: Mock (control), 4, 8, and 18 hours post-infection (hpi). Each row displays individual greyscale channels for DAPI (nucleus), Phalloidin (F-actin cytoskeleton), Arc (activity-regulated cytoskeleton-associated protein), and ICP8 (viral replication protein), alongside a merged color composite. In mock-infected cells, Arc and ICP8 signals are negligible. Following infection, ICP8 (pink in merge) shows progressive nuclear localization and intensity increases. Concurrently, Arc protein (green in merge) shows an altered distribution, accumulating significantly in the perinuclear region by 8 and 18 hpi, suggesting an association with the Golgi apparatus during the viral cycle. Phalloidin staining (red in merge) reveals morphological changes, including cell shrinkage and cytoskeletal reorganization by 18 hpi. This comparison illustrates the upregulation and spatial redistribution of synaptic plasticity-related proteins during acute neurotropic viral infection.
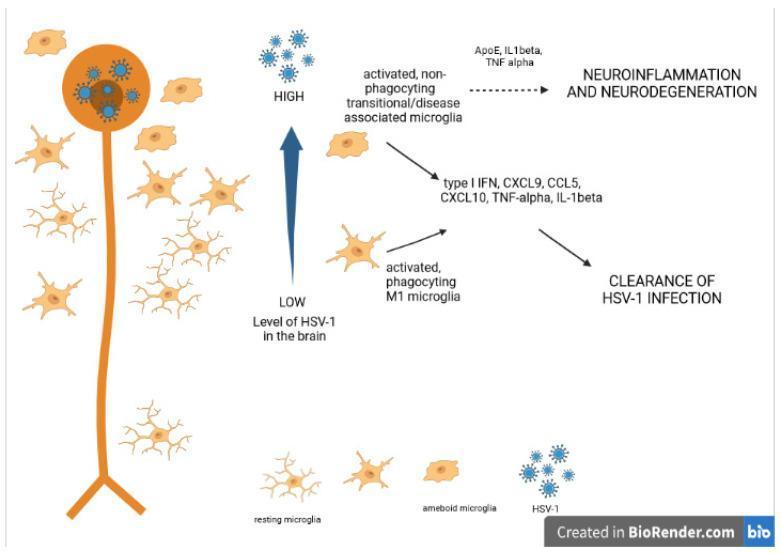
This pathophysiology diagram illustrates the relationship between Herpes Simplex Virus type 1 (HSV-1) brain infection and microglia morphological states. It depicts a spectrum of microglia transformation from highly branched 'resting microglia' to 'ameboid microglia' in response to infection. The diagram bifurcates based on viral load: a 'LOW' level of HSV-1 triggers 'activated, phagocyting M1 microglia' which secrete cytokines and chemokines including type I IFN, CXCL9, CCL5, CXCL10, TNF-alpha, and IL-1beta, leading to the 'CLEARANCE OF HSV-1 INFECTION'. Conversely, a 'HIGH' level of HSV-1 results in 'activated, non-phagocyting transitional/disease associated microglia' (DAM). This state is associated with ApoE, IL-1beta, and TNF-alpha, and is linked to chronic 'NEUROINFLAMMATION AND NEURODEGENERATION'. The visual serves as an educational model for understanding how varying intensities of viral stimuli can shift immune responses from protective phagocytosis to pathological neurodegeneration in the central nervous system.
Replication of Herpes Simplex Virus (HSV)
HSV Virion Structure
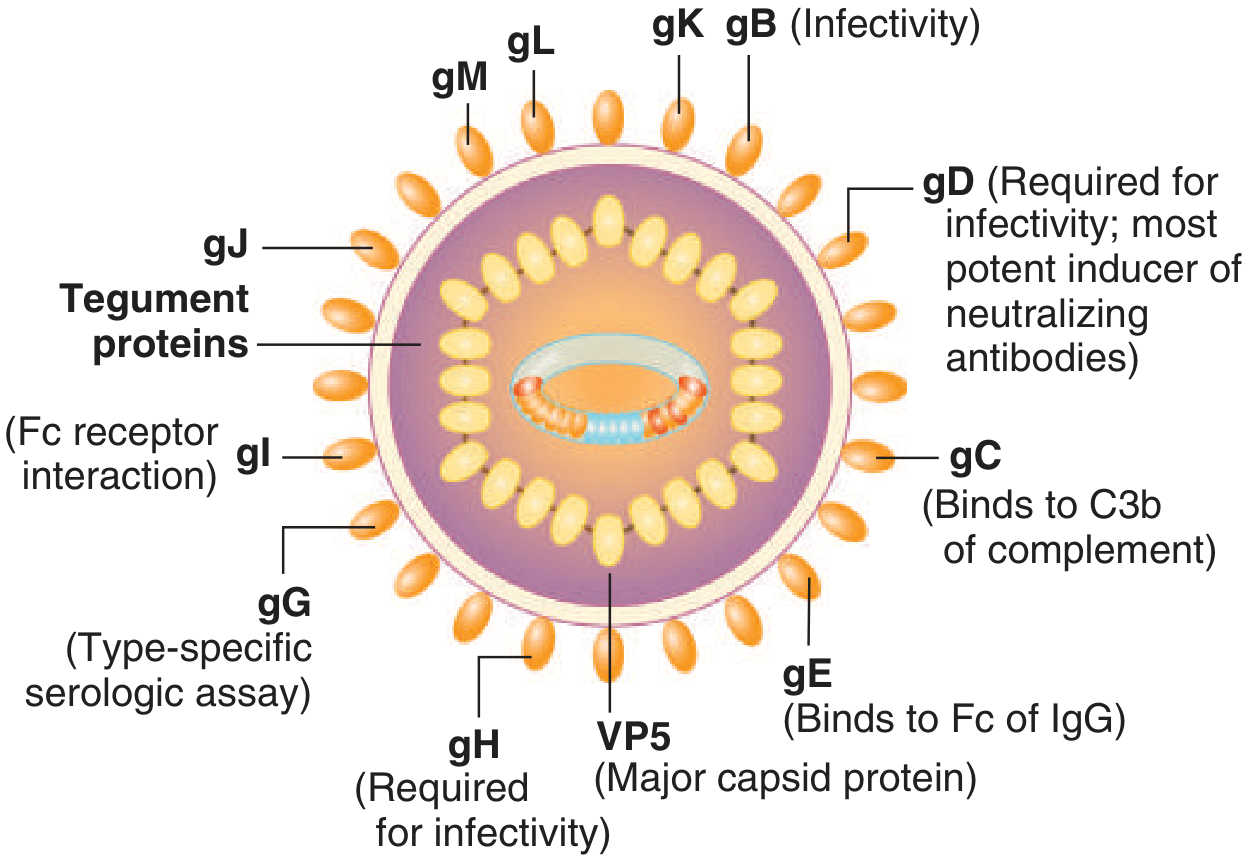
- gB, gD, gH - required for entry and infectivity
- gC - binds complement C3b
- gE/gI - Fc receptor interaction
- VP5 - major capsid protein
The Replication Cycle
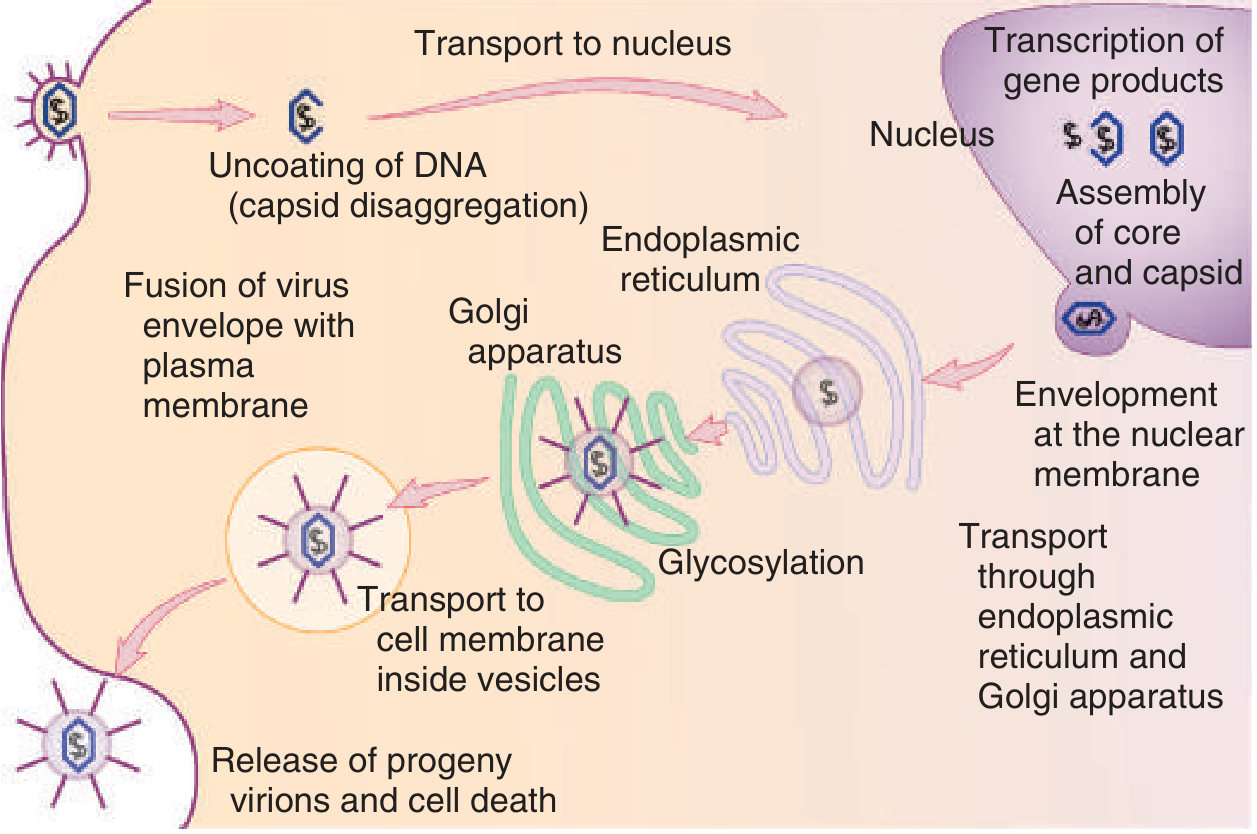
Step 1: Attachment and Entry
- The envelope glycoproteins first bind to heparan sulfate proteoglycans on the cell surface - a low-affinity initial attachment step.
- The virus then binds higher-affinity receptors (e.g., herpesvirus entry mediator/HVEM, nectin-1) via glycoprotein D (gD).
- Binding triggers fusion of the viral envelope with the plasma membrane (in most cell types), releasing tegument proteins into the cytoplasm along with the nucleocapsid.
- In some cell types, the virus may be endocytosed first, with fusion then occurring in the endosome.
Step 2: Capsid Transport to the Nucleus
- The nucleocapsid travels along microtubules toward the nucleus (retrograde transport).
- At the nuclear pore, the viral DNA genome is extruded directly into the nucleus - the capsid does not enter.
Step 3: Circularization and Gene Expression
- Once inside the nucleus, the linear viral DNA circularizes.
- Transcription is carried out entirely by host RNA polymerase II.
- Gene expression proceeds in a highly regulated, sequential cascade of three classes:
| Class | Genes | Timing | Function |
|---|---|---|---|
| Immediate Early (IE) | alpha (α) genes | 2-4 hours post-infection | Regulatory proteins; do NOT require prior viral protein synthesis; regulate downstream gene expression and evade host defenses |
| Early (E) | beta (β) genes | After IE proteins | Enzymes for DNA replication: viral DNA polymerase, thymidine kinase (TK), DNA-binding proteins |
| Late (L) | gamma (γ) genes | After DNA replication | Structural proteins: capsid subunits, tegument proteins, envelope glycoproteins |
- IE gene products shut off E genes once E proteins accumulate.
- E gene products (thymidine kinase and DNA polymerase) are distinct from host cell enzymes - this is what makes them ideal antiviral drug targets (e.g., acyclovir is phosphorylated by viral TK, then inhibits viral DNA polymerase).
Step 4: Viral DNA Replication
- DNA replication occurs in the nucleus via a rolling circle mechanism, generating high-molecular-weight DNA concatemers.
- The concatemers are then cleaved at specific packaging signals and inserted into preassembled capsids in the nucleus.
- A viral protease cleaves the scaffolding protein, causing capsid maturation.
Step 5: Envelopment and Egress
- Nucleocapsids acquire their primary envelope by budding through the inner nuclear membrane (acquiring tegument proteins in the process).
- The primary enveloped virion enters the endoplasmic reticulum lumen and is transported to the Golgi apparatus.
- A process of de-envelopment and re-envelopment occurs in the Golgi - the primary envelope fuses with the Golgi membrane (de-envelopment), and the capsid re-buds into Golgi-derived vesicles (final envelopment), picking up the full complement of glycoproteins and undergoing glycosylation.
- Mature virions are carried in vesicles to the plasma membrane, where they fuse and are released.
Step 6: Cell Death and Release
- Host cell protein synthesis is shut off by a viral protein complex that cleaves host mRNAs (this occurs for α- and γ-herpesviruses).
- Ultimately, lytic replication leads to death of the infected epithelial cell and release of hundreds to thousands of progeny virions.
Latency (Post-Replication)
- The viral genome persists as a non-integrated circular episome in the nucleus.
- No infectious virus is produced - this is true latency, not chronic infection.
- Only latency-associated transcripts (LATs) and microRNAs are expressed - no viral proteins, minimizing immune detection.
- HSV-1 expresses only microRNAs during latency.
- Reactivation is triggered by stress, UV light, fever, trauma, or immunosuppression - virus then travels anterograde back down the nerve to the mucosal surface, causing recurrent lesions.
Key Antiviral Targets
| Drug | Target | Mechanism |
|---|---|---|
| Acyclovir/valacyclovir | Viral TK + viral DNA polymerase | Viral TK phosphorylates acyclovir; active form inhibits viral polymerase and acts as a chain terminator |
| Foscarnet | Viral DNA polymerase | Direct inhibitor; does not require TK activation (used in acyclovir-resistant HSV) |
| Cidofovir | Viral DNA polymerase | Nucleotide analog, phosphorylated by cellular kinases |
Summary of Key Features
- Genome: Large, linear dsDNA (~152 kb), replicates in the nucleus
- Polymerase for transcription: Host RNA polymerase II
- Polymerase for DNA replication: Viral DNA polymerase (target of acyclovir)
- Replication site: Nucleus (DNA replication + capsid assembly); ER/Golgi (envelopment)
- Replication mechanism: Rolling circle
- Host cell outcome: Lytic infection with cell death in epithelial cells; latency in neurons
- Cell tropism: Widest among herpesviruses - infects many human and animal cell types