
Make ppt on mechanism of immunity with vivid images
innate immunity mechanism diagram
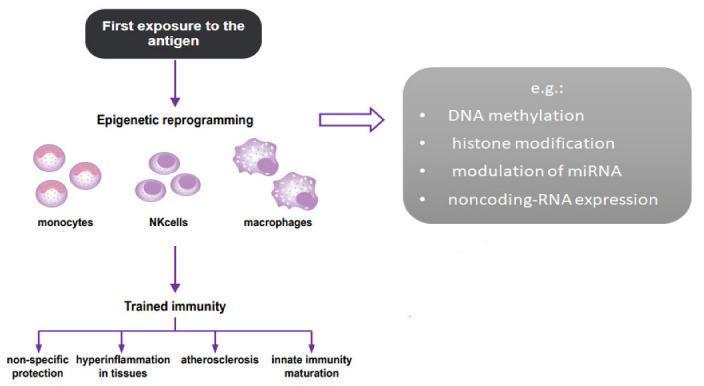
A pathophysiology diagram illustrating the mechanism of trained immunity in humans. The flowchart begins with 'First exposure to the antigen,' which triggers 'Epigenetic reprogramming' in innate immune cells, specifically monocytes, NK cells, and macrophages. These cells are visually depicted with characteristic morphologies: monocytes and NK cells appear as small spherical cells, while macrophages are shown as larger, more irregular phagocytic cells. The diagram highlights key molecular processes involved in this reprogramming, including DNA methylation, histone modification, modulation of miRNA, and noncoding-RNA expression. The central outcome of these changes is identified as 'Trained immunity.' The bottom section of the algorithm shows the clinical consequences and manifestations of this state, branching into four categories: non-specific protection, hyperinflammation in tissues, atherosclerosis (ASCVD), and innate immunity maturation. This visual resource effectively summarizes the link between molecular epigenetic changes in the innate immune system and chronic inflammatory pathologies.
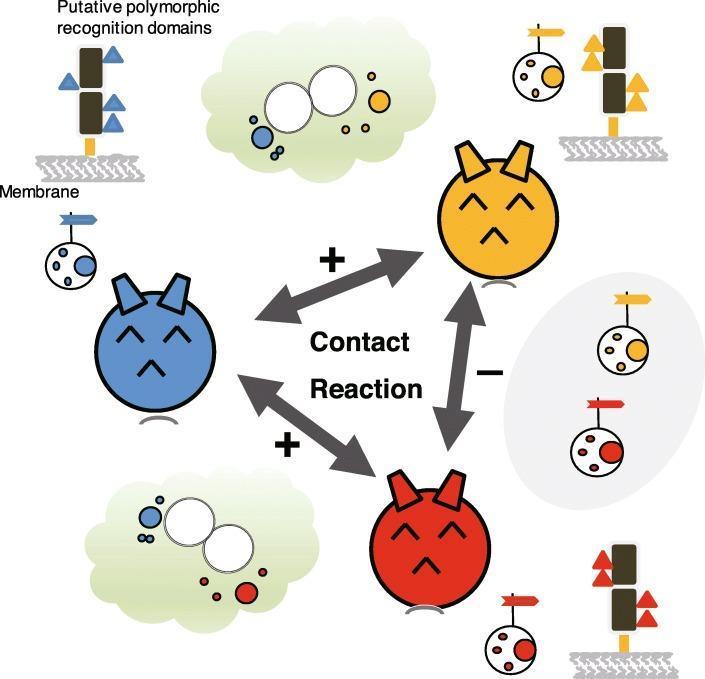
This medical schematic illustrates the mechanism of allorecognition and the contact reaction (CR) process, which serves as an evolutionary model for innate immunity. The diagram depicts three distinct hemocytes (represented as colored circular cells: blue, yellow, and red) and their interactions. At the molecular level, the image highlights 'putative polymorphic recognition domains'—represented by small triangles of varying colors and patterns—located on membrane-bound self-marker proteins (HrSMLP1). A positive contact reaction (+), characterized by cellular activation, de-vacuolation, and pigment formation, is shown when cells with mismatched polymorphic patterns (e.g., blue vs. yellow or blue vs. red) interact. In contrast, a negative reaction (-) occurs between individuals with similar or identical recognition domain patterns (e.g., yellow vs. red in this specific illustrative context), suggesting self-compatibility. This model provides insight into non-self discrimination mechanisms analogous to vertebrate Natural Killer (NK) cell responses and the 'missing self' hypothesis, focusing on the role of glycoprotein diversity in primitive immune signaling pathways.
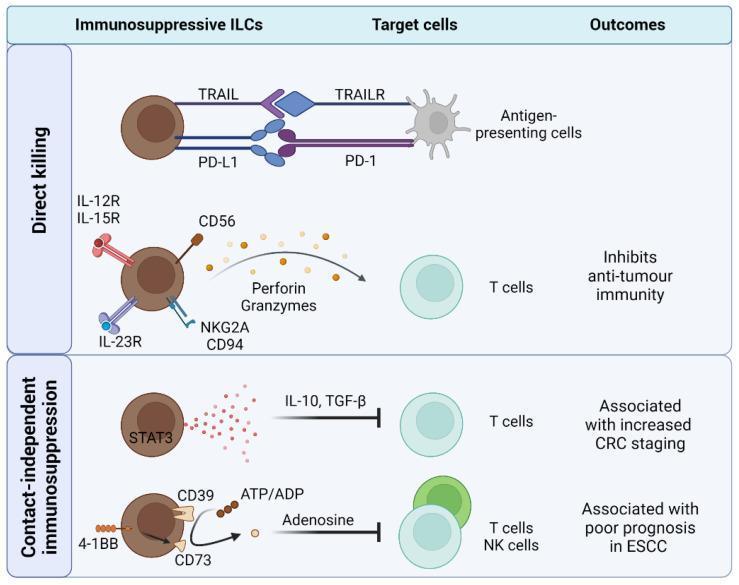
This pathophysiology diagram illustrates the mechanisms by which immunosuppressive innate lymphoid cells (ILCs) inhibit anti-tumor immunity, categorized into direct killing and contact-independent immunosuppression. In the direct killing panel, ILCs target antigen-presenting cells (APCs) via TRAIL-TRAILR and PD-L1-PD-1 surface interactions. Simultaneously, ILCs expressing IL-12R, IL-15R, IL-23R, CD56, and NKG2A/CD94 induce T cell lysis through the release of perforin and granzymes. In the contact-independent immunosuppression panel, STAT3-expressing ILCs secrete immunoregulatory cytokines IL-10 and TGF-β to inhibit T cells, a process associated with increased colorectal cancer (CRC) staging. Another pathway shows ILCs expressing 4-1BB, CD39, and CD73 converting extracellular ATP/ADP into adenosine, which suppresses both T cells and NK cells, a mechanism linked to poor prognosis in esophageal squamous cell carcinoma (ESCC). The diagram effectively maps cellular interactions and molecular pathways involved in tumor immune evasion.
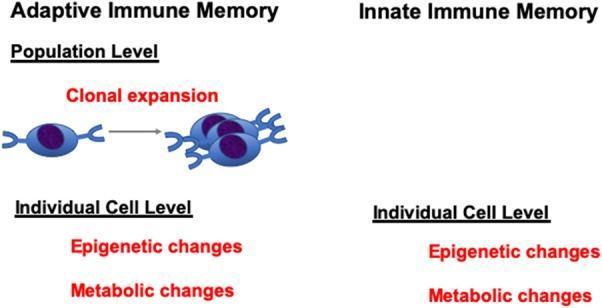
This Comparison Chart illustrates the fundamental differences and similarities between Adaptive and Innate Immune Memory across population and individual cellular levels. The diagram is divided into two primary columns: 'Adaptive Immune Memory' and 'Innate Immune Memory.' Under the Adaptive Immune Memory section, the 'Population Level' mechanism is visually represented by a diagram showing 'Clonal expansion,' where a single lymphocyte progresses through cell division into a larger cluster. At the 'Individual Cell Level,' both Adaptive and Innate Immune Memory share identical mechanisms, listed as 'Epigenetic changes' and 'Metabolic changes.' Crucially, the Innate Immune Memory side lacks the 'Population Level' clonal expansion component, highlighting that its memory (often referred to as 'trained immunity') resides solely within functional alterations of individual cells like monocytes or macrophages rather than numerical expansion of antigen-specific clones. This medical illustration is designed to clarify that while the pathways to immunological memory differ, epigenetic and metabolic reprogramming are common denominators in both arms of the human immune system.
adaptive immunity T cell B cell antibody response
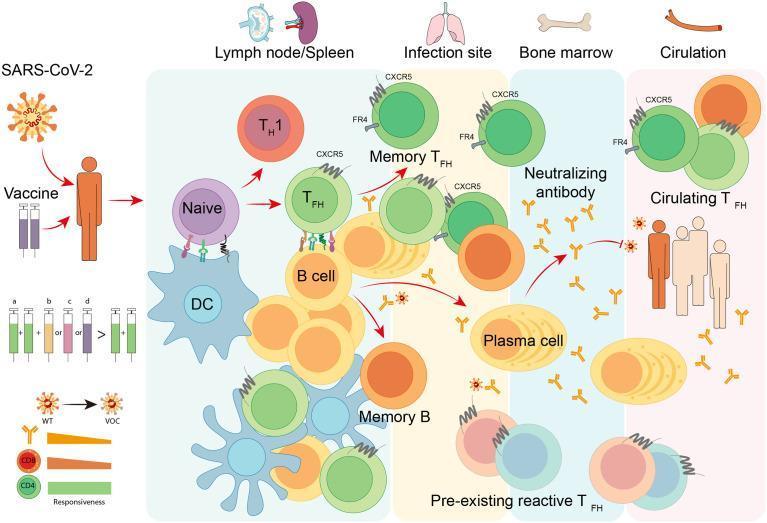
A pathophysiology diagram illustrating the adaptive immune response to SARS-CoV-2 infection or vaccination, with a focus on follicular helper T (TFH) cell dynamics. The flowchart spans four anatomical compartments: Lymph node/Spleen, Infection site (lung), Bone marrow, and Circulation. In secondary lymphoid organs, dendritic cells (DCs) present antigens to naive CD4+ T cells, which differentiate into TH1 and TFH cells (expressing CXCR5 and FR4). TFH cells facilitate B cell maturation into memory B cells and antibody-secreting plasma cells. The diagram highlights the migration of memory TFH cells to the infection site and the persistence of long-lived plasma cells in the bone marrow, both contributing to the production of neutralizing antibodies. Circulating TFH cells are shown in the systemic circulation. Educational components include the role of heterologous vaccination in enhancing responsiveness to variants of concern (VOCs) and the synergy between cellular (CD4+, CD8+) and humoral immunity in providing long-term protection against COVID-19.
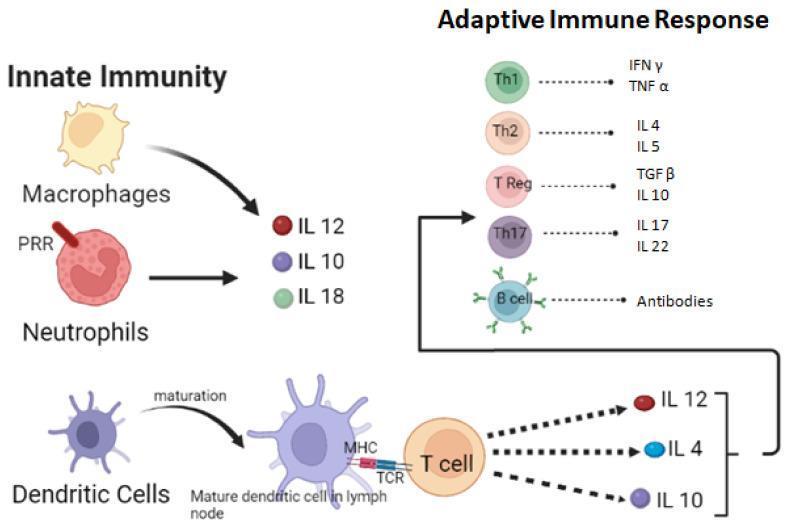
This medical illustration depicts the interplay between innate immunity and the adaptive immune response, specifically in the context of the host defense against pathogens such as fungi. The 'Innate Immunity' section features macrophages, neutrophils with pattern recognition receptors (PRR), and the maturation of dendritic cells. These cells are shown influencing a cytokine profile including IL-12, IL-10, and IL-18. A mature dendritic cell in a lymph node is shown interacting with a naive T cell via MHC-TCR binding, which subsequently promotes the secretion of IL-12, IL-4, and IL-10 to drive adaptive differentiation. The 'Adaptive Immune Response' section details the differentiation of T-helper subsets and their respective cytokine outputs: Th1 (IFN-̳, TNF-̱), Th2 (IL-4, IL-5), T Reg (TGF-̲, IL-10), and Th17 (IL-17, IL-22). Additionally, it illustrates the humoral component, showing B cell activation and subsequent antibody production. This diagram serves as an educational tool for understanding immunology, cellular signaling, and the bridge between non-specific and specific immune responses.
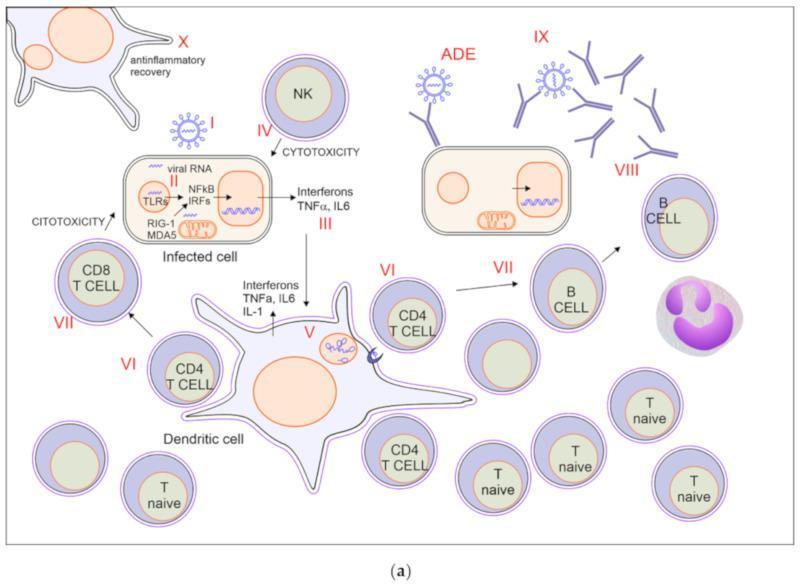
This pathophysiology diagram illustrates the coordinated innate and adaptive immune response to a viral infection, specifically SARS-CoV-2. The visual sequence (Roman numerals I-X) begins with viral RNA entry into a host cell. Intracellular sensing via TLRs, RIG-1, and MDA5 activates NFkB and IRF pathways, leading to the secretion of pro-inflammatory cytokines including Interferons, TNF-alpha, IL-6, and IL-1. A central dendritic cell acts as an antigen-presenting cell, activating CD4+ and naive T cells. The diagram highlights effector mechanisms including cytotoxicity by Natural Killer (NK) cells and CD8+ T cells against the infected cell. Adaptive immunity is further depicted through B cell activation and the production of antibodies (IgG/IgM). The visual also notes Antibody-Dependent Enhancement (ADE) where antibodies facilitate viral entry. The final stage shows anti-inflammatory recovery and tissue resolution. This educational resource demonstrates the transition from innate recognition to cellular and humoral immunity required for viral clearance.
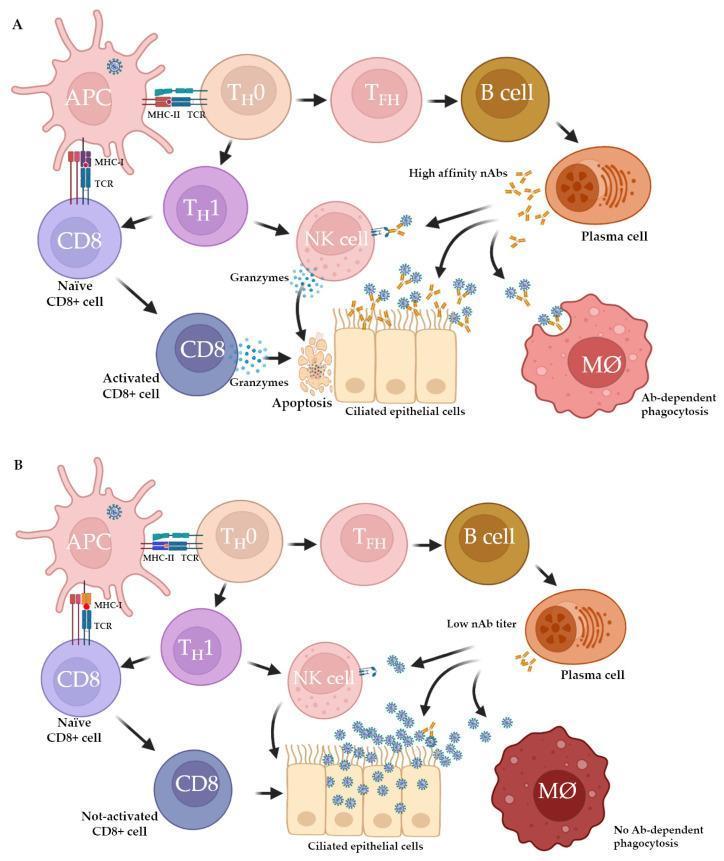
This medical illustration depicts two comparative pathophysiology diagrams (Scenario A and Scenario B) illustrating the impact of MHC-II variation on the adaptive immune response to SARS-CoV-2. Both scenarios show a sequence starting with an Antigen Presenting Cell (APC) presenting viral peptides via MHC-I to CD8+ T cells and via MHC-II to TH0 cells. The TH0 cells differentiate into TFH and TH1 cells, subsequently activating B cells to become antibody-secreting plasma cells. Scenario A illustrates an effective response where high-affinity neutralizing antibodies (nAbs) facilitate antibody-dependent cellular cytotoxicity (ADCC) via NK cells and antibody-dependent phagocytosis (ADP) by macrophages. Activated CD8+ T cells and NK cells are shown releasing granzymes to induce apoptosis in ciliated epithelial cells. In contrast, Scenario B depicts an ineffective response characterized by polymorphic MHC-II molecules leading to failed CD4+ stimulation, low nAb titers, and non-activated CD8+ cells, resulting in a lack of ADP and reduced viral clearance. The diagram highlights the critical role of HLA class II polymorphism in determining the efficacy of neutralization and cellular immunity.
phagocytosis macrophage neutrophil killing bacteria
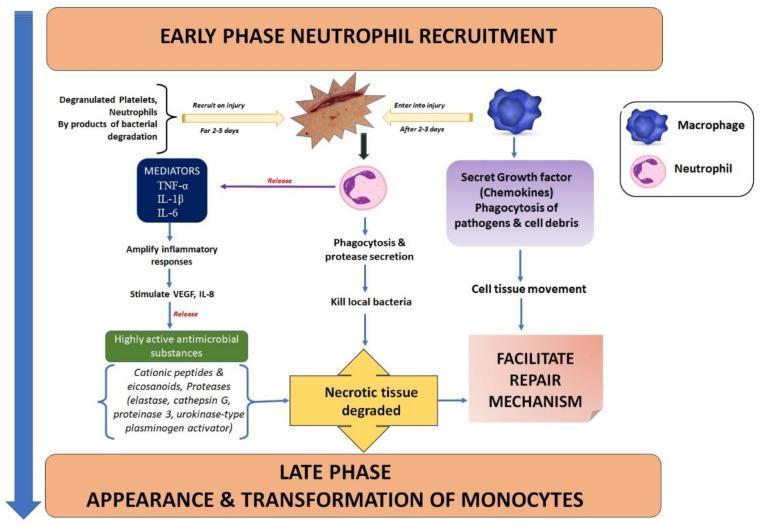
This medical pathophysiology flowchart illustrates the inflammatory phase following a cutaneous injury, specifically focusing on early-phase neutrophil recruitment and late-phase monocyte transformation. The diagram is structured to show the temporal progression of wound healing over 2-5 days. Central to the initial stage is a cutaneous incision icon attracting neutrophils and degranulated platelets. The neutrophil-mediated pathway details the release of pro-inflammatory mediators (TNF-α, IL-1β, IL-6), which amplify the inflammatory response and stimulate VEGF and IL-8, leading to the release of antimicrobial substances like cationic peptides and proteases (elastase, cathepsin G). These neutrophils perform phagocytosis and protease secretion to kill local bacteria and degrade necrotic tissue. Simultaneously, macrophages enter the injury site after 2-3 days, secreting growth factors and chemokines while performing phagocytosis of pathogens and cell debris. This macrophage activity promotes cell tissue movement to facilitate repair mechanisms. The flowchart concludes with a transition into the late phase, characterized by the appearance and transformation of monocytes into mature macrophages, bridging the inflammatory response to the proliferative repair stage.
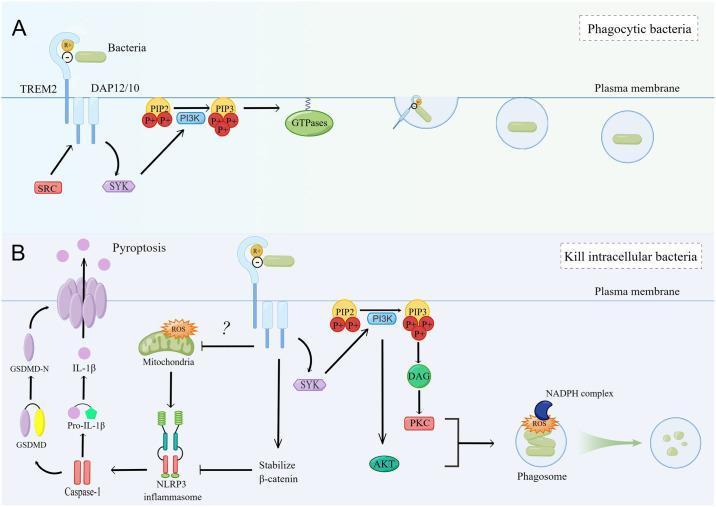
This medical pathophysiology diagram illustrates the dual role of the Triggering Receptor Expressed on Myeloid cells 2 (TREM2) in mediating bacterial phagocytosis, intracellular killing, and the regulation of inflammatory cell death (pyroptosis). Panel A depicts bacterial phagocytosis: TREM2 binds bacteria and signals through DAP12/10, activating SRC and SYK kinases. This pathway triggers PI3K to convert PIP2 to PIP3, leading to GTPase-mediated actin rearrangement, plasma membrane invagination, and the engulfment of bacteria into phagocytic vacuoles. Panel B shows intracellular bacterial killing and pyroptosis regulation. In the killing pathway, TREM2-mediated signaling through SYK, AKT, and PKC (via DAG) activates the NADPH oxidase complex on phagosomes to generate reactive oxygen species (ROS) for bacterial destruction. Simultaneously, TREM2 provides a protective effect by stabilizing beta-catenin to inhibit NLRP3 inflammasome assembly and transcription. This inhibition prevents Caspase-1 activation, which would otherwise cleave Pro-IL-1β into mature IL-1β and GSDMD into GSDMD-N, the latter of which forms pores leading to cell lysis (pyroptosis). The diagram highlights the complex intracellular signaling network involved in macrophage-mediated innate immunity.
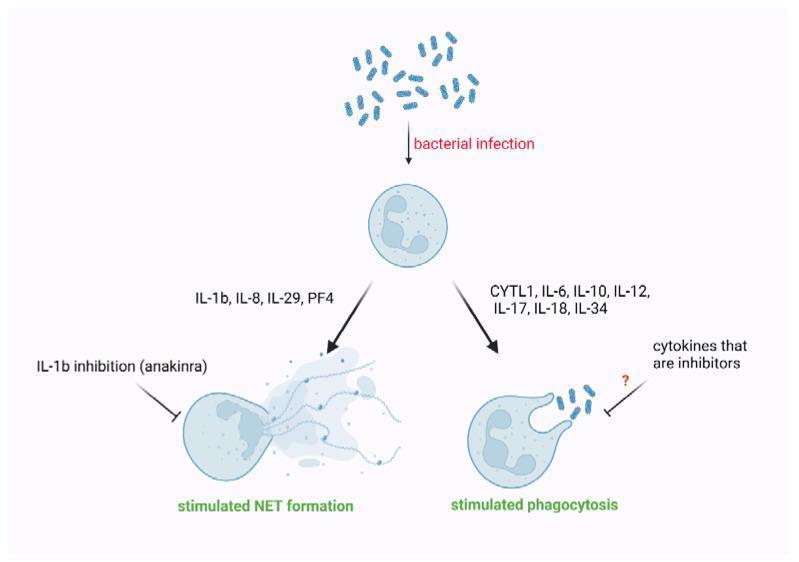
This pathophysiology diagram illustrates the modulation of neutrophil effector functions by specific cytokines during bacterial infection, focusing on two primary pathways: NET formation and phagocytosis. At the top, bacterial infection triggers the activation of a neutrophil. The left pathway shows 'stimulated NET formation' (neutrophil extracellular traps), where the cell extrudes web-like DNA structures; this process is promoted by IL-1b, IL-8, IL-29, and PF4, while being inhibited by IL-1b inhibition (anakinra). The right pathway shows 'stimulated phagocytosis', where the neutrophil membrane engulfs bacteria; this process is stimulated by cytokines including CYTL1, IL-6, IL-10, IL-12, IL-17, IL-18, and IL-34. The diagram uses standard flow logic to represent immunological signaling, highlighting the clinical relevance of cytokine balance in conditions like sepsis and the potential for therapeutic intervention through cytokine inhibition. This visual serves as an educational summary of innate immune responses and inflammatory mediators for intermediate to advanced medical students.
complement system activation pathway
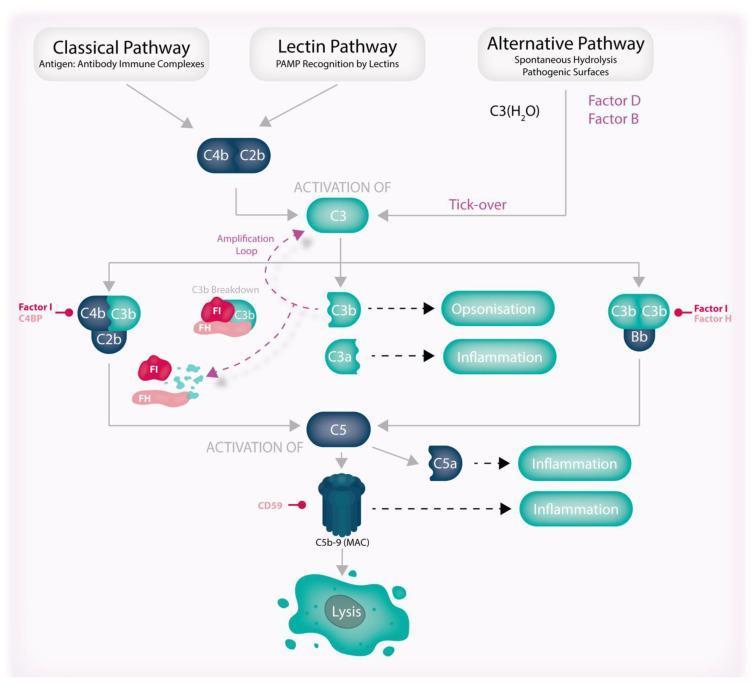
This pathophysiology diagram illustrates the three activation pathways of the human complement system: Classical, Lectin, and Alternative. The Classical pathway is triggered by antigen-antibody complexes, the Lectin pathway by PAMP recognition, and the Alternative pathway via spontaneous hydrolysis ('tick-over') involving Factors B and D. All three pathways converge at the activation of C3. Key downstream events include the cleavage of C3 into C3a (driving inflammation) and C3b (mediating opsonization). The diagram highlights an 'amplification loop' where C3b reinforces C3 activation, alongside regulatory mechanisms such as C3b breakdown by Factor I (FI) and Factor H (FH). The cascade progresses to C5 activation, resulting in C5a-mediated inflammation and the formation of the C5b-9 Membrane Attack Complex (MAC), which is regulated by CD59 and ultimately leads to cell lysis. The illustration serves as an educational summary of innate immune system proteolytic signaling, highlighting the balance between effector functions (inflammation, opsonization, lysis) and inhibitory regulation.
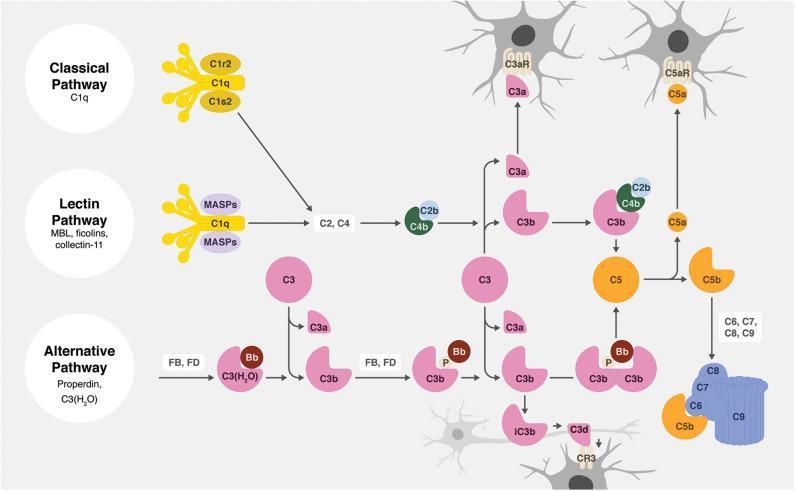
A comprehensive pathophysiology diagram illustrating the three activation pathways of the human complement system: Classical, Lectin, and Alternative. The Classical pathway is initiated by C1q (complexed with C1r2 and C1s2); the Lectin pathway utilizes MBL, ficolins, and collectin-11 with MASPs; and the Alternative pathway involves Properdin and C3(H2O) with Factors B and D. All three pathways converge at the enzymatic cleavage of C3 into C3a and C3b. The C4b2b complex (C3 convertase) is shown mediating this in the classical/lectin routes, while C3bBb performs this in the alternative route. The downstream cascade leads to C5 cleavage, producing the anaphylatoxin C5a and fragment C5b. Educational highlights include the assembly of the Membrane Attack Complex (MAC, C5b-9) depicted as a blue pore-forming structure, and the production of opsonins (iC3b, C3d). The diagram specifically contextualizes the immune response within the nervous system, showing receptors like C3aR, C5aR, and CR3 on glial-like cells, illustrating the role of complement in neuroinflammation or synaptic pruning.
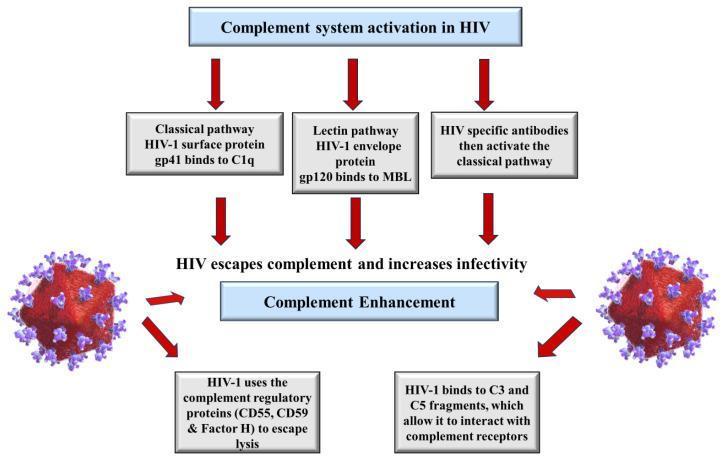
A pathophysiology flow diagram illustrating the mechanisms of complement system activation and evasion by the Human Immunodeficiency Virus (HIV). The top level depicts three primary activation pathways: the Classical pathway (initiated by HIV-1 surface protein gp41 binding to C1q), the Lectin pathway (HIV-1 envelope protein gp120 binding to Mannose-Binding Lectin/MBL), and an antibody-mediated pathway where HIV-specific antibodies trigger the classical cascade. Central to the diagram is the process of evasion, where HIV escapes complement-mediated lysis and increases infectivity. This is achieved through two main mechanisms: the recruitment of host complement regulatory proteins (CD55, CD59, and Factor H) to inhibit membrane attack complex formation, and the binding of the virus to C3 and C5 fragments to facilitate interaction with complement receptors. These processes converge on 'Complement Enhancement,' visually represented as promoting the survival and opsonization of HIV virions. This diagram serves as a medical educational resource for understanding viral immune evasion strategies and the dual role of the complement system in HIV pathogenesis.
MHC antigen presentation T helper cytotoxic
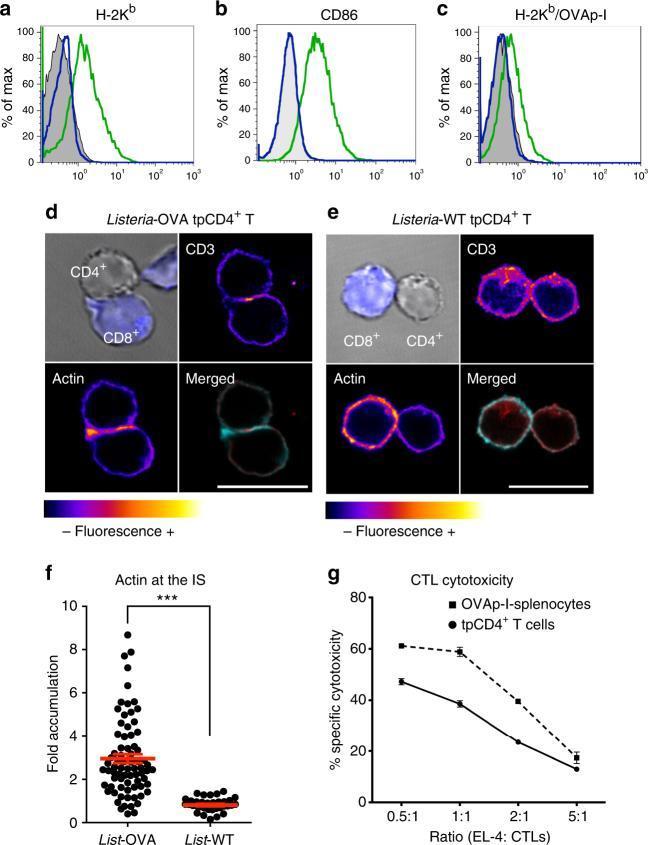
This composite educational image illustrates the antigen-presenting capacity of transphagocytic CD4+ T cells (tpCD4+). Panels (a-c) present flow cytometry histograms showing increased expression of H-2Kb, CD86, and the OVAp-I/H-2Kb complex on CD4+ T cells following transphagocytosis of Listeria-OVA, indicating acquisition of MHC-I and costimulatory molecules. Panels (d) and (e) display confocal microscopy images of conjugates between tpCD4+ T cells and naive CD8+ T cells. In the Listeria-OVA group (d), there is a distinct accumulation of CD3 (red in merged) and polymerized actin (cyan in merged) at the cell-cell interface, signifying a mature immunological synapse (IS). In contrast, the Listeria-WT group (e) lacks this organized synapse structure. Panel (f) provides quantitative analysis of actin accumulation at the IS, showing significantly higher fold-accumulation in Listeria-OVA conjugates (P < 0.001). Panel (g) is a line graph demonstrating that CD8+ cytotoxic T lymphocytes (CTLs) activated by these tpCD4+ cells exhibit robust specific cytotoxicity against target cells, comparable to splenocyte-activated controls. The content is relevant to immunology, specifically cross-presentation and T-cell activation mechanisms.
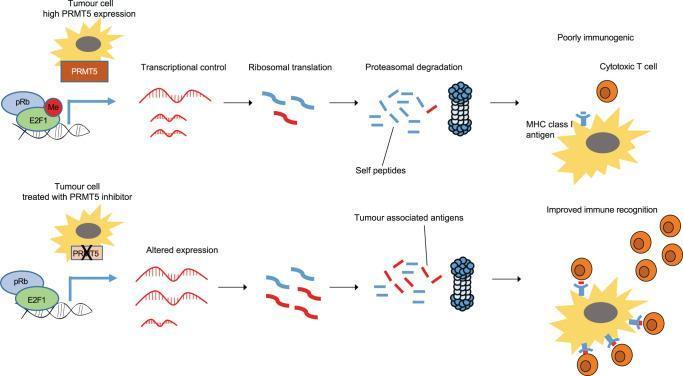
This pathophysiology diagram illustrates the molecular pathway of lncRNA-derived antigen presentation in tumor cells under two conditions: high PRMT5 expression (untreated) and pharmacological PRMT5 inhibition. The upper panel shows that PRMT5 methylates E2F1 (Me), which interacts with pRb at the DNA level to exert transcriptional control. This leads to ribosomal translation and proteasomal degradation of predominantly 'self-peptides' (blue), resulting in an MHC class I antigen display that is poorly immunogenic to cytotoxic T cells. The lower panel depicts a tumor cell treated with a PRMT5 inhibitor (T1-44), which halts E2F1 methylation. This results in altered transcriptional expression of lncRNAs, yielding a different polypeptide composition during ribosomal translation. Subsequent proteasomal degradation generates 'Tumour associated antigens' (red) that are presented on MHC class I complexes. This alteration leads to improved immune recognition and increased infiltration of cytotoxic T cells. This diagram illustrates a novel mechanism where PRMT5 and E2F1 regulate the non-coding genome to influence tumor immunogenicity.
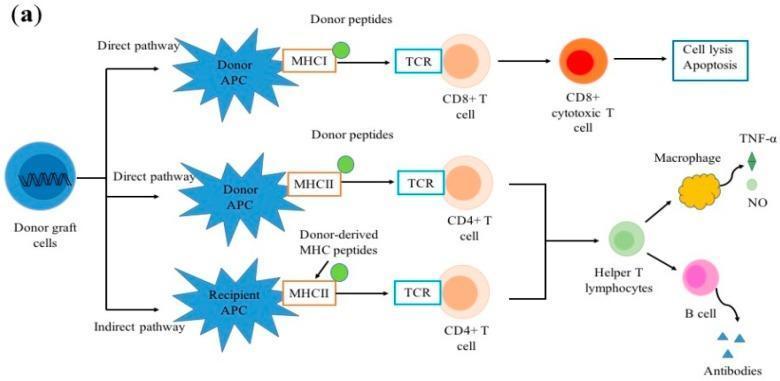
This pathophysiology diagram illustrates the direct and indirect pathways of allorecognition following organ transplantation. The direct pathway features donor antigen-presenting cells (APCs) presenting donor peptides via MHC I and MHC II molecules directly to recipient T-cell receptors (TCRs). Activation of CD8+ T cells leads to their differentiation into cytotoxic T cells, resulting in target cell lysis and apoptosis. Activation of CD4+ T cells leads to the formation of helper T lymphocytes. In the indirect pathway, recipient APCs process donor-derived MHC peptides and present them on self-MHC II molecules to recipient CD4+ T cells, which also differentiate into helper T lymphocytes. These helper T lymphocytes subsequently interact with macrophages, stimulating the release of inflammatory mediators like TNF-α and nitric oxide (NO), and with B cells to stimulate the production of donor-specific antibodies. This schematic summarizes the cellular interactions and signaling pathways that drive acute and chronic allograft rejection in human immunology.
inflammation cytokines interleukins signaling
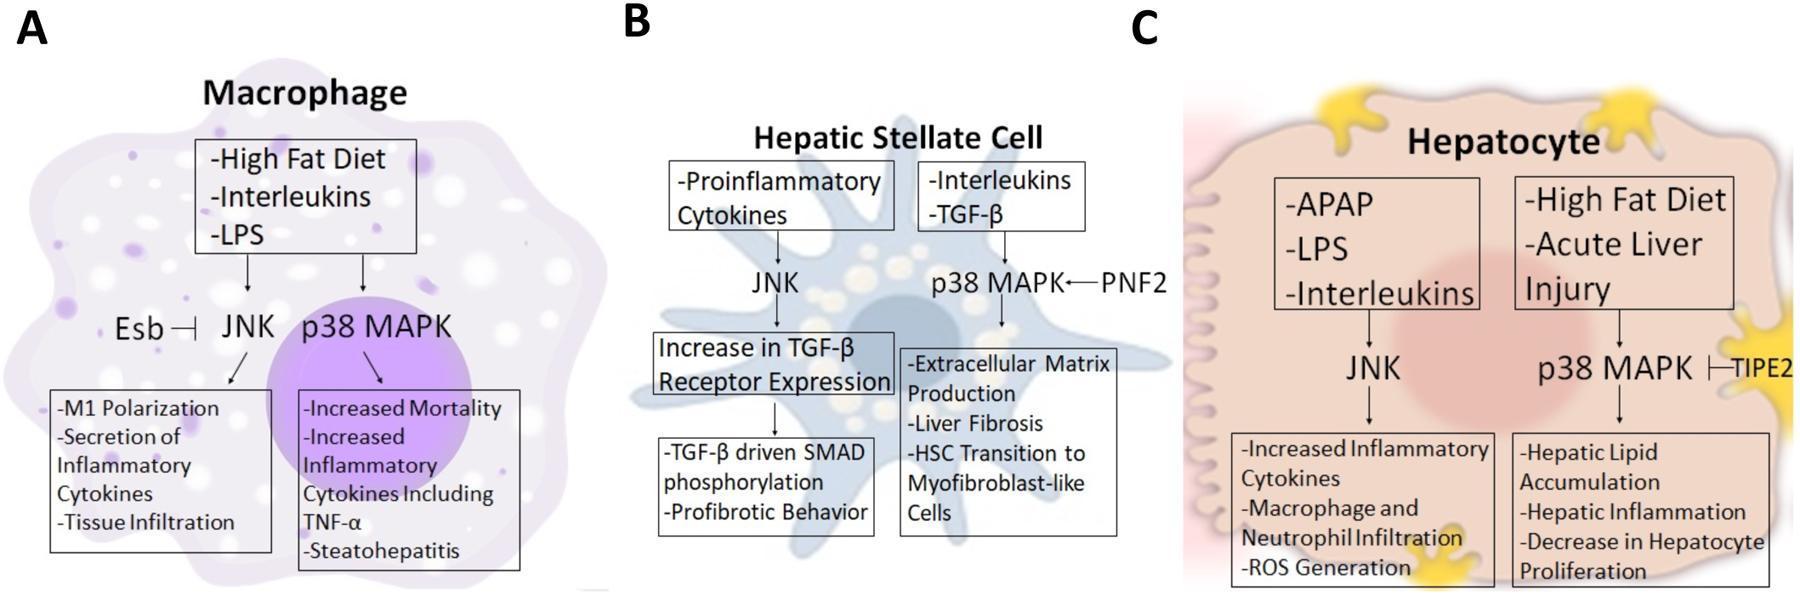
A pathophysiology diagram illustrating Mitogen-Activated Protein Kinase (MAPK) signaling pathways—specifically JNK and p38 MAPK—across three liver cell types involved in hepatic injury and inflammation. Panel A (Macrophage) shows that High Fat Diet (HFD), Interleukins, and LPS trigger JNK-driven M1 polarization and cytokine secretion, while p38 MAPK activation leads to increased TNF-α and steatohepatitis. Panel B (Hepatic Stellate Cell) depicts proinflammatory cytokines activating JNK to increase TGF-β receptor expression and SMAD phosphorylation, promoting profibrotic behavior. Concurrently, p38 MAPK (modulated by PNF2) drives extracellular matrix production and transition to myofibroblast-like cells. Panel C (Hepatocyte) illustrates JNK activation by APAP, LPS, and Interleukins causing inflammatory cytokine production and ROS generation. p38 MAPK activation in hepatocytes, influenced by TIPE2, stimulates lipid accumulation and inhibits cell proliferation. The diagram demonstrates the distinct roles of these signaling cascades in liver fibrosis, steatosis, and the inflammatory response.
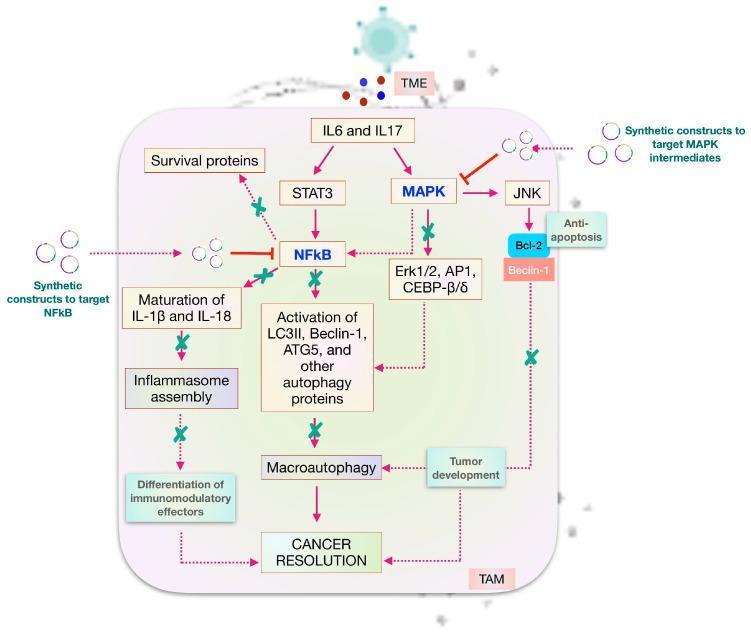
A pathophysiology diagram illustrating the intracellular signaling pathways involved in cancer progression and potential therapeutic targets. The process begins in the tumor microenvironment (TME) where cytokines IL-6 and IL-17 initiate two primary signaling axes: the STAT3-NFkB pathway and the MAPK-JNK pathway. Activation of STAT3 leads to NFkB signaling, which regulates survival proteins, the maturation of inflammatory interleukins (IL-1β, IL-18), and inflammasome assembly. Simultaneously, the MAPK pathway influences JNK and transcription factors like AP1 and CEBP-̦/̤, which together with NFkB, drive the activation of autophagy proteins including LC3II, Beclin-1, and ATG5. These pathways culminate in macroautophagy and tumor development. The diagram highlights potential therapeutic interventions using synthetic constructs to inhibit NFkB and MAPK intermediates, indicated by red inhibitory lines. Successful modulation of these targets is shown to lead to the differentiation of immunomodulatory effectors and 'Cancer Resolution,' potentially mediated by tumor-associated macrophages (TAMs). This educational illustration serves as a model for understanding chronic inflammation and autophagy in oncology.
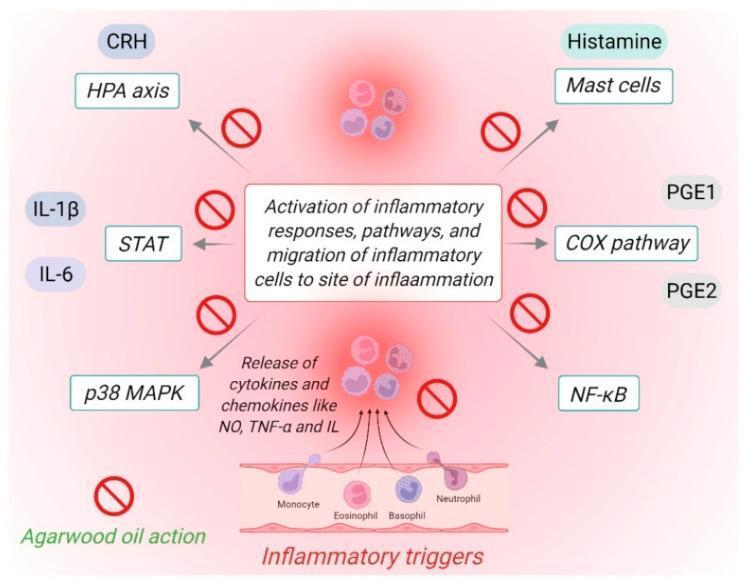
A pathophysiology diagram illustrating the multi-target anti-inflammatory mechanisms of agarwood oil. The flow begins with 'Inflammatory triggers' acting on blood vessels, leading to the recruitment and activation of monocytes, eosinophils, basophils, and neutrophils. This process initiates a cascade involving the release of pro-inflammatory cytokines and chemokines, specifically Nitric Oxide (NO), TNF-α, and various Interleukins (IL). The central node describes the 'Activation of inflammatory responses, pathways, and migration of inflammatory cells to the site of inflammation.' Radiating from this center are various signaling pathways and mediators targeted for inhibition, including the CRH/HPA axis, IL-1β/IL-6 via STAT pathways, p38 MAPK, Histamine release from Mast cells, the COX pathway involving PGE1 and PGE2, and the NF-κB transcription factor. 'Agarwood oil action' is visually represented by red 'prohibition' icons superimposed on arrows leading to these specific mediators and signaling pathways, indicating its therapeutic potential to interrupt the systemic and cellular inflammatory response across multiple biological axes.
mkdir -p /tmp/workspace/immunity-ppt && ls /tmp/workspace/immunity-ppt/
~/immunity-ppt/create_ppt.py
import json, subprocess, base64
from io import BytesIO
from pptx import Presentation
from pptx.util import Inches, Pt, Emu
from pptx.dml.color import RGBColor
from pptx.enum.text import PP_ALIGN, MSO_ANCHOR

# ── colour palette ──────────────────────────────────────────────
NAVY        = RGBColor(0x0D, 0x2B, 0x55)   # dark navy
TEAL        = RGBColor(0x00, 0x7A, 0x87)   # accent teal
LIGHT_TEAL  = RGBColor(0xE0, 0xF5, 0xF7)  # very light teal bg
GOLD        = RGBColor(0xF0, 0xA5, 0x00)   # accent gold
WHITE       = RGBColor(0xFF, 0xFF, 0xFF)
DARK_GREY   = RGBColor(0x33, 0x33, 0x33)
MID_GREY    = RGBColor(0x66, 0x66, 0x66)
LIGHT_GREY  = RGBColor(0xF2, 0xF4, 0xF8)

# ── image URLs ──────────────────────────────────────────────────
IMAGES = {
    "trained_immunity": "https://cdn.orris.care/cdss_images/pmc_clinical_VQA_9a075fc56848a434f533b54f23a0082ce51cf0e2b0d5a4cbd52a4677576e6f9e.jpg",
    "innate_adaptive":  "https://cdn.orris.care/cdss_images/pmc_clinical_VQA_8ae4724d61ece6ed64577506226728646675764afeab63a54e1eb6bfbc8d62a7.jpg",
    "viral_response":   "https://cdn.orris.care/cdss_images/pmc_clinical_VQA_ce1053fcc11bb56a6cea34d593ce34fcb72d651c8a976fec08c24921e0a72a29.jpg",
    "phagocytosis":     "https://cdn.orris.care/cdss_images/pmc_clinical_VQA_c24c16477b40925bfc0836e02c9c4a79ba308078e25ace8ef95d478b8b87612f.jpg",
    "neutrophil_nets":  "https://cdn.orris.care/cdss_images/pmc_clinical_VQA_0d91a80044aeb4a48f632b2e6dea1ac6fcca31b6179676cda80173d07dca6169.jpg",
    "complement1":      "https://cdn.orris.care/cdss_images/pmc_clinical_VQA_d2fa6eaef65ba9db3932aef137c6ed843ac0b63298964c4ec0acf211ac1eb4d3.jpg",
    "complement2":      "https://cdn.orris.care/cdss_images/pmc_clinical_VQA_6de16457576020abcd29e733f37ecb280b1724d8000c550683c30206628bd9c2.jpg",
    "adaptive_covid":   "https://cdn.orris.care/cdss_images/pmc_clinical_VQA_17bc9b4c8682ac93af752713578757df96ef0fb072dfdf429cc7701fa258a414.jpg",
    "allorecognition":  "https://cdn.orris.care/cdss_images/pmc_clinical_VQA_d1db89d070022cffe931ac1986ab64c04c70a7239b4e8dd7a1cd312c3850013c.jpg",
    "immune_memory":    "https://cdn.orris.care/cdss_images/pmc_clinical_VQA_aeb4fc4b9d6924036ffdf7fa85d826e703c613201ea2df8e185bb00deb3e28ee.jpg",
}

# ── fetch images ────────────────────────────────────────────────
print("Fetching images …")
url_list = list(IMAGES.values())
raw = subprocess.check_output(
    ["python", "/tmp/skills/shared/scripts/fetch_images.py"] + url_list,
    timeout=120
)
fetched = json.loads(raw)
img_map = {}
for key, url in IMAGES.items():
    for item in fetched:
        if item["url"] == url and item.get("base64"):
            b64 = item["base64"]
            # strip data: prefix if present
            if "," in b64:
                b64 = b64.split(",", 1)[1]
            img_map[key] = base64.b64decode(b64)
            break
print(f"Fetched {len(img_map)}/{len(IMAGES)} images")


# ── helpers ─────────────────────────────────────────────────────
def blank_slide(prs):
    return prs.slides.add_slide(prs.slide_layouts[6])

def add_rect(slide, l, t, w, h, fill_color, alpha=None):
    from pptx.oxml.ns import qn
    from lxml import etree
    shape = slide.shapes.add_shape(1, Inches(l), Inches(t), Inches(w), Inches(h))
    shape.line.fill.background()
    shape.fill.solid()
    shape.fill.fore_color.rgb = fill_color
    return shape

def add_textbox(slide, text, l, t, w, h, font_size=18, bold=False,
                color=DARK_GREY, align=PP_ALIGN.LEFT, wrap=True, italic=False):
    tb = slide.shapes.add_textbox(Inches(l), Inches(t), Inches(w), Inches(h))
    tf = tb.text_frame
    tf.word_wrap = wrap
    tf.margin_left = 0; tf.margin_right = 0
    tf.margin_top = 0; tf.margin_bottom = 0
    p = tf.paragraphs[0]
    p.alignment = align
    run = p.add_run()
    run.text = text
    run.font.size = Pt(font_size)
    run.font.bold = bold
    run.font.italic = italic
    run.font.color.rgb = color
    run.font.name = "Calibri"
    return tb

def add_bullet_box(slide, bullets, l, t, w, h, font_size=15, color=DARK_GREY):
    tb = slide.shapes.add_textbox(Inches(l), Inches(t), Inches(w), Inches(h))
    tf = tb.text_frame
    tf.word_wrap = True
    tf.margin_left = Inches(0.05); tf.margin_right = 0
    tf.margin_top = 0; tf.margin_bottom = 0
    first = True
    for bullet in bullets:
        if first:
            p = tf.paragraphs[0]; first = False
        else:
            p = tf.add_paragraph()
        p.space_before = Pt(4)
        run = p.add_run()
        run.text = f"• {bullet}"
        run.font.size = Pt(font_size)
        run.font.color.rgb = color
        run.font.name = "Calibri"
    return tb

def add_image(slide, key, l, t, w, h):
    if key not in img_map:
        print(f"  Missing image: {key}")
        return
    buf = BytesIO(img_map[key])
    slide.shapes.add_picture(buf, Inches(l), Inches(t), Inches(w), Inches(h))

def slide_header(slide, title, subtitle=None):
    # navy top bar
    add_rect(slide, 0, 0, 13.333, 1.15, NAVY)
    add_textbox(slide, title, 0.35, 0.12, 10, 0.7,
                font_size=28, bold=True, color=WHITE, align=PP_ALIGN.LEFT)
    if subtitle:
        add_textbox(slide, subtitle, 0.35, 0.75, 10, 0.38,
                    font_size=14, bold=False, color=LIGHT_TEAL, align=PP_ALIGN.LEFT)
    # thin gold accent line
    add_rect(slide, 0, 1.15, 13.333, 0.045, GOLD)


# ══════════════════════════════════════════════════════════════
#  BUILD PRESENTATION
# ══════════════════════════════════════════════════════════════
prs = Presentation()
prs.slide_width  = Inches(13.333)
prs.slide_height = Inches(7.5)

# ─── Slide 1: Title ───────────────────────────────────────────
slide = blank_slide(prs)
add_rect(slide, 0, 0, 13.333, 7.5, NAVY)
# decorative teal band
add_rect(slide, 0, 4.5, 13.333, 3.0, TEAL)
# gold line
add_rect(slide, 0, 4.45, 13.333, 0.08, GOLD)
add_textbox(slide, "MECHANISMS OF IMMUNITY",
            0.6, 1.4, 12, 1.3, font_size=42, bold=True, color=WHITE, align=PP_ALIGN.CENTER)
add_textbox(slide, "Innate • Adaptive • Complement • Memory",
            0.6, 2.75, 12, 0.8, font_size=22, bold=False, color=GOLD, align=PP_ALIGN.CENTER)
add_textbox(slide, "A comprehensive visual overview of how the human immune system\nrecognizes, responds to, and remembers pathogens",
            0.6, 3.5, 12, 1.0, font_size=16, bold=False, color=LIGHT_TEAL, align=PP_ALIGN.CENTER)
add_textbox(slide, "Immunology | Medical Sciences",
            0.6, 5.0, 12, 0.6, font_size=14, bold=False, color=WHITE, align=PP_ALIGN.CENTER, italic=True)

# ─── Slide 2: Overview of Immunity ────────────────────────────
slide = blank_slide(prs)
add_rect(slide, 0, 0, 13.333, 7.5, LIGHT_GREY)
slide_header(slide, "Overview of the Immune System", "Two main branches working in concert")

add_rect(slide, 0.3, 1.4, 5.8, 5.7, WHITE)
add_rect(slide, 6.6, 1.4, 6.4, 5.7, WHITE)

add_textbox(slide, "INNATE IMMUNITY", 0.5, 1.55, 5.4, 0.5,
            font_size=17, bold=True, color=TEAL, align=PP_ALIGN.CENTER)
add_bullet_box(slide, [
    "First line of defense — responds within minutes to hours",
    "Non-specific: recognizes broad pathogen patterns (PAMPs)",
    "Key cells: Neutrophils, Macrophages, NK cells, Dendritic cells",
    "Pattern recognition via Toll-like receptors (TLRs)",
    "Triggers inflammation, fever & interferons",
    "Physical barriers: skin, mucus, cilia",
    "Does NOT generate immunological memory",
], 0.5, 2.15, 5.4, 4.5, font_size=14)

add_textbox(slide, "ADAPTIVE IMMUNITY", 7.0, 1.55, 5.6, 0.5,
            font_size=17, bold=True, color=NAVY, align=PP_ALIGN.CENTER)
add_bullet_box(slide, [
    "Second line — activated within days to weeks",
    "Highly specific: targets unique antigens on pathogens",
    "Key cells: T lymphocytes, B lymphocytes",
    "Antigen presentation via MHC-I and MHC-II molecules",
    "Produces antibodies (humoral) & cytotoxic cells (cellular)",
    "Generates long-lived memory cells for faster future response",
    "Self vs. non-self discrimination (tolerance)",
], 7.0, 2.15, 5.6, 4.5, font_size=14)

add_textbox(slide, "⟵  INNATE", 5.5, 4.15, 1.4, 0.4, font_size=13, bold=True, color=TEAL)
add_rect(slide, 6.15, 1.4, 0.08, 5.7, GOLD)
add_textbox(slide, "ADAPTIVE  ⟶", 6.3, 4.15, 1.4, 0.4, font_size=13, bold=True, color=NAVY)

# ─── Slide 3: Innate Immunity – Cellular Mechanisms ───────────
slide = blank_slide(prs)
add_rect(slide, 0, 0, 13.333, 7.5, LIGHT_GREY)
slide_header(slide, "Innate Immunity – Cellular Mechanisms", "Phagocytes, NK cells & pattern recognition")

add_image(slide, "phagocytosis", 0.3, 1.35, 7.2, 5.8)

add_rect(slide, 7.7, 1.35, 5.3, 5.8, WHITE)
add_textbox(slide, "Key Players", 7.9, 1.5, 5.0, 0.45,
            font_size=17, bold=True, color=NAVY)
add_bullet_box(slide, [
    "Neutrophils — first responders; phagocytose & kill bacteria via ROS, NETs, proteases",
    "Macrophages — enter site at 2-3 days; phagocytosis + cytokine release (TNF-α, IL-1β, IL-6)",
    "NK cells — kill virus-infected/cancer cells without prior sensitisation",
    "Dendritic cells — professional APCs; bridge innate and adaptive immunity",
    "Mast cells — release histamine; mediate early inflammation",
], 7.9, 2.05, 5.0, 5.0, font_size=13.5)

# ─── Slide 4: Innate Immunity – Neutrophil NETs ───────────────
slide = blank_slide(prs)
add_rect(slide, 0, 0, 13.333, 7.5, LIGHT_GREY)
slide_header(slide, "Neutrophil Effector Functions", "Phagocytosis and Neutrophil Extracellular Traps (NETs)")

add_image(slide, "neutrophil_nets", 0.3, 1.35, 7.8, 5.8)

add_rect(slide, 8.3, 1.35, 4.7, 5.8, WHITE)
add_textbox(slide, "Dual Killing Mechanisms", 8.5, 1.5, 4.4, 0.45,
            font_size=16, bold=True, color=NAVY)
add_bullet_box(slide, [
    "NET Formation: DNA + histones + enzymes extruded to trap & kill bacteria extracellularly",
    "NET promoters: IL-1β, IL-8, IL-29, PF4",
    "Phagocytosis: engulf and destroy pathogens in phagolysosome",
    "Phagocytosis stimulators: IL-6, IL-10, IL-12, IL-17, IL-18, IL-34",
    "Cytokine balance determines which mechanism dominates in sepsis",
    "Clinical relevance: dysregulated NETs worsen sepsis & thrombosis",
], 8.5, 2.1, 4.4, 4.5, font_size=13)

# ─── Slide 5: Complement System ───────────────────────────────
slide = blank_slide(prs)
add_rect(slide, 0, 0, 13.333, 7.5, LIGHT_GREY)
slide_header(slide, "Complement System", "Three pathways converging at C3 → MAC")

add_image(slide, "complement2", 0.3, 1.35, 7.5, 5.8)

add_rect(slide, 7.95, 1.35, 5.0, 5.8, WHITE)
add_textbox(slide, "3 Activation Pathways", 8.1, 1.5, 4.7, 0.45,
            font_size=16, bold=True, color=NAVY)
add_bullet_box(slide, [
    "Classical: antigen-antibody complex activates C1q",
    "Lectin: MBL/ficolins bind PAMPs → MASP activation",
    "Alternative: spontaneous C3 hydrolysis ('tick-over') + Properdin",
    "All converge → C3 convertase → C3a + C3b",
    "C3b: opsonisation — tags pathogens for phagocytosis",
    "C3a / C5a: anaphylatoxins — recruit and activate immune cells",
    "C5b-9: Membrane Attack Complex (MAC) → cell lysis",
    "Regulated by Factor H, Factor I, CD59 to prevent self-damage",
], 8.1, 2.05, 4.7, 4.5, font_size=12.5)

# ─── Slide 6: Innate ↔ Adaptive Bridge ─────────────────────────
slide = blank_slide(prs)
add_rect(slide, 0, 0, 13.333, 7.5, LIGHT_GREY)
slide_header(slide, "Bridging Innate and Adaptive Immunity", "Dendritic cells & cytokine cross-talk")

add_image(slide, "innate_adaptive", 0.3, 1.35, 7.5, 5.8)

add_rect(slide, 8.0, 1.35, 5.0, 5.8, WHITE)
add_textbox(slide, "The Bridge", 8.2, 1.5, 4.7, 0.45,
            font_size=16, bold=True, color=NAVY)
add_bullet_box(slide, [
    "Macrophages, neutrophils detect fungi/bacteria via PRRs",
    "Mature dendritic cells migrate to lymph nodes",
    "Present antigen via MHC-II to naïve CD4+ T cells",
    "IL-12 → Th1 differentiation (IFN-γ, TNF-β)",
    "IL-4 → Th2 differentiation (IL-4, IL-5)",
    "TGF-β → T-regulatory cells (IL-10, TGF-β)",
    "IL-17 → Th17 cells (anti-fungal/extracellular bacteria)",
    "B cell activation leads to antibody production",
], 8.2, 2.05, 4.7, 4.5, font_size=13)

# ─── Slide 7: Adaptive Immunity – Cellular ────────────────────
slide = blank_slide(prs)
add_rect(slide, 0, 0, 13.333, 7.5, LIGHT_GREY)
slide_header(slide, "Adaptive Immunity – Cellular & Humoral Arms", "T cells, B cells, MHC and antigen presentation")

add_image(slide, "allorecognition", 0.3, 1.35, 7.5, 5.8)

add_rect(slide, 8.0, 1.35, 5.0, 5.8, WHITE)
add_textbox(slide, "Two Arms of Adaptive Immunity", 8.2, 1.5, 4.7, 0.45,
            font_size=15, bold=True, color=NAVY)
add_bullet_box(slide, [
    "Cellular (T cell-mediated):",
    "  CD8+ cytotoxic T cells kill infected cells via MHC-I",
    "  CD4+ helper T cells coordinate response via MHC-II",
    "  Granzymes/perforin induce target cell apoptosis",
    "",
    "Humoral (B cell-mediated):",
    "  B cells activated by CD4+ helper T cells",
    "  Differentiate into plasma cells → antibody secretion",
    "  IgM (early), IgG (late, opsonisation), IgA (mucosal), IgE (allergy)",
    "  Donor-specific antibodies drive graft rejection",
], 8.2, 2.05, 4.7, 4.6, font_size=12)

# ─── Slide 8: Viral Immune Response ───────────────────────────
slide = blank_slide(prs)
add_rect(slide, 0, 0, 13.333, 7.5, LIGHT_GREY)
slide_header(slide, "Coordinated Response to Viral Infection", "From viral sensing to antibody production")

add_image(slide, "viral_response", 0.3, 1.35, 7.5, 5.8)

add_rect(slide, 8.0, 1.35, 5.0, 5.8, WHITE)
add_textbox(slide, "Step-by-Step (I–X)", 8.2, 1.5, 4.7, 0.45,
            font_size=16, bold=True, color=NAVY)
add_bullet_box(slide, [
    "① Viral RNA enters host cell",
    "② TLRs, RIG-I, MDA5 sense viral PAMPs",
    "③ NFκB + IRF pathways activate",
    "④ IFN-α/β, TNF-α, IL-6, IL-1β secreted",
    "⑤ Dendritic cell presents antigen to naïve T cells",
    "⑥ NK cells kill infected cells (innate)",
    "⑦ CD8+ T cells kill infected cells (adaptive)",
    "⑧ B cell activation → IgG / IgM antibodies",
    "⑨ Antibody-dependent enhancement (ADE) — risk",
    "⑩ Anti-inflammatory resolution & tissue repair",
], 8.2, 2.05, 4.7, 4.6, font_size=12.5)

# ─── Slide 9: Adaptive Immunity – COVID/TFH ───────────────────
slide = blank_slide(prs)
add_rect(slide, 0, 0, 13.333, 7.5, LIGHT_GREY)
slide_header(slide, "Follicular Helper T Cells & Long-Term Protection", "Lymph node to bone marrow — building lasting immunity")

add_image(slide, "adaptive_covid", 0.3, 1.35, 7.5, 5.8)

add_rect(slide, 8.0, 1.35, 5.0, 5.8, WHITE)
add_textbox(slide, "TFH Cell Pathway", 8.2, 1.5, 4.7, 0.45,
            font_size=16, bold=True, color=NAVY)
add_bullet_box(slide, [
    "Dendritic cells present antigen to naïve CD4+ T cells",
    "Naïve CD4+ → TH1 and TFH (CXCR5+, FR4+) cells",
    "TFH cells enter germinal centres in lymph nodes",
    "Drive B cell maturation → memory B cells + plasma cells",
    "Long-lived plasma cells reside in bone marrow",
    "Secrete neutralizing antibodies for months–years",
    "Memory TFH cells migrate to infection site",
    "Heterologous vaccination boosts cross-reactive protection",
], 8.2, 2.05, 4.7, 4.6, font_size=13)

# ─── Slide 10: Immunological Memory ──────────────────────────
slide = blank_slide(prs)
add_rect(slide, 0, 0, 13.333, 7.5, LIGHT_GREY)
slide_header(slide, "Immunological Memory", "Adaptive memory vs. trained innate immunity")

add_image(slide, "immune_memory", 0.3, 1.35, 6.5, 5.8)

add_rect(slide, 7.0, 1.35, 6.0, 5.8, WHITE)
add_textbox(slide, "Two Forms of Immune Memory", 7.2, 1.5, 5.7, 0.45,
            font_size=16, bold=True, color=NAVY)
add_textbox(slide, "Adaptive Immune Memory", 7.2, 2.1, 5.7, 0.4,
            font_size=14, bold=True, color=TEAL)
add_bullet_box(slide, [
    "Clonal expansion of antigen-specific B & T cells",
    "Memory cells persist for years to decades",
    "Faster, stronger secondary response (anamnestic)",
    "Basis of vaccination effectiveness",
], 7.2, 2.55, 5.7, 1.8, font_size=13)

add_textbox(slide, "Trained Innate Immunity", 7.2, 4.5, 5.7, 0.4,
            font_size=14, bold=True, color=GOLD)
add_bullet_box(slide, [
    "Epigenetic reprogramming of monocytes/macrophages/NK cells",
    "DNA methylation + histone modification + miRNA changes",
    "Enhanced non-specific response to subsequent infections",
    "Can also contribute to hyperinflammation & atherosclerosis",
], 7.2, 4.95, 5.7, 2.1, font_size=13)

# ─── Slide 11: Trained Immunity Deep-Dive ────────────────────
slide = blank_slide(prs)
add_rect(slide, 0, 0, 13.333, 7.5, LIGHT_GREY)
slide_header(slide, "Trained Innate Immunity", "Epigenetic reprogramming after first antigen exposure")

add_image(slide, "trained_immunity", 0.3, 1.35, 7.5, 5.8)

add_rect(slide, 8.0, 1.35, 5.0, 5.8, WHITE)
add_textbox(slide, "Mechanism", 8.2, 1.5, 4.7, 0.45,
            font_size=16, bold=True, color=NAVY)
add_bullet_box(slide, [
    "1st exposure to antigen",
    "→ Epigenetic reprogramming of innate immune cells",
    "   (monocytes, macrophages, NK cells)",
    "",
    "Epigenetic changes:",
    "  • DNA methylation / demethylation",
    "  • Histone modification",
    "  • miRNA & non-coding RNA modulation",
    "",
    "Outcomes of trained immunity:",
    "  • Non-specific cross-protection",
    "  • Risk of hyperinflammation in tissues",
    "  • Atherosclerosis / cardiovascular disease",
    "  • Enhanced innate immune maturation",
], 8.2, 2.05, 4.7, 4.6, font_size=12)

# ─── Slide 12: Summary ────────────────────────────────────────
slide = blank_slide(prs)
add_rect(slide, 0, 0, 13.333, 7.5, NAVY)
add_rect(slide, 0, 6.3, 13.333, 1.2, TEAL)
add_rect(slide, 0, 6.25, 13.333, 0.08, GOLD)

add_textbox(slide, "Summary", 0.5, 0.3, 12, 0.8,
            font_size=32, bold=True, color=WHITE, align=PP_ALIGN.CENTER)
add_rect(slide, 0.4, 1.25, 3.8, 4.7, RGBColor(0x12, 0x3A, 0x6B))
add_rect(slide, 4.55, 1.25, 3.9, 4.7, RGBColor(0x12, 0x3A, 0x6B))
add_rect(slide, 8.7, 1.25, 4.3, 4.7, RGBColor(0x12, 0x3A, 0x6B))

add_textbox(slide, "INNATE", 0.6, 1.4, 3.4, 0.45,
            font_size=16, bold=True, color=GOLD, align=PP_ALIGN.CENTER)
add_bullet_box(slide, [
    "Immediate response (mins–hrs)",
    "Non-specific pattern recognition",
    "Neutrophils, Macrophages, NK cells",
    "Phagocytosis, NETs, complement",
    "Inflammation & interferon release",
    "No immunological memory",
], 0.6, 1.95, 3.4, 3.8, font_size=12.5, color=LIGHT_TEAL)

add_textbox(slide, "ADAPTIVE", 4.75, 1.4, 3.5, 0.45,
            font_size=16, bold=True, color=GOLD, align=PP_ALIGN.CENTER)
add_bullet_box(slide, [
    "Delayed response (days–weeks)",
    "Highly antigen-specific",
    "T cells (cellular) & B cells (humoral)",
    "MHC-I / MHC-II antigen presentation",
    "Antibody production (IgG, IgM, IgA)",
    "Generates long-lived memory",
], 4.75, 1.95, 3.5, 3.8, font_size=12.5, color=LIGHT_TEAL)

add_textbox(slide, "MEMORY & COMPLEMENT", 8.9, 1.4, 3.9, 0.45,
            font_size=14, bold=True, color=GOLD, align=PP_ALIGN.CENTER)
add_bullet_box(slide, [
    "Complement: 3 pathways → MAC lysis",
    "Opsonisation enhances phagocytosis",
    "Adaptive memory: clonal expansion",
    "Trained innate: epigenetic changes",
    "Vaccination mimics natural memory",
    "Both arms cooperate for full defense",
], 8.9, 1.95, 3.9, 3.8, font_size=12.5, color=LIGHT_TEAL)

add_textbox(slide, "Innate immunity provides immediate, broad defence • Adaptive immunity mounts specific, long-lasting responses • Complement amplifies both arms",
            0.5, 6.35, 12.3, 0.8, font_size=13, bold=False,
            color=WHITE, align=PP_ALIGN.CENTER)

# ── Save ────────────────────────────────────────────────────────
out_path = "/tmp/workspace/immunity-ppt/Mechanisms_of_Immunity.pptx"
buf = BytesIO()
prs.save(buf)
with open(out_path, "wb") as f:
    f.write(buf.getvalue())
print(f"Saved: {out_path}")
cd /tmp/workspace/immunity-ppt && python create_ppt.py 2>&1
**/fetch_images.py in /tmp/skills
~/immunity-ppt/create_ppt.py
Successfully replaced 1 instance(s) of the string in '/tmp/workspace/immunity-ppt/create_ppt.py'
~/immunity-ppt/create_ppt.py
Successfully replaced 1 instance(s) of the string in '/tmp/workspace/immunity-ppt/create_ppt.py'
cd /tmp/workspace/immunity-ppt && python create_ppt.py 2>&1
Mechanisms of Immunity
Presentation · PPTX
| Slide | Title | Image |
|---|---|---|
| 1 | Title slide | Decorative layout |
| 2 | Overview: Innate vs Adaptive | Side-by-side comparison table |
| 3 | Innate Immunity – Cellular Mechanisms | Neutrophil/macrophage wound response |
| 4 | Neutrophil Effector Functions | Phagocytosis & NET formation pathway |
| 5 | Complement System | Classical/Lectin/Alternative → MAC diagram |
| 6 | Bridging Innate & Adaptive | Dendritic cell → T helper subset differentiation |
| 7 | Adaptive Immunity – Cellular & Humoral | MHC-I/II antigen presentation & allorecognition |
| 8 | Coordinated Viral Response (I–X steps) | TLR/RIG-I → NK/CD8+ → antibody cascade |
| 9 | Follicular Helper T Cells & Long-term Protection | TFH → plasma cells → bone marrow |
| 10 | Immunological Memory | Adaptive clonal expansion vs. trained immunity |
| 11 | Trained Innate Immunity | Epigenetic reprogramming pathway |
| 12 | Summary slide | Three-column visual recap |