
Ecg
Asking for Preferences
What would you like to know about ECG?
The user wants a full ECG overview and study notes. This is a medical topic, so I need to read the medical-library skill first.
Reading File
Now let me search the medical library for comprehensive ECG content.
Finding Sources
Finding Sources
Finding Sources
Reading File
Let me now read Harrison's ECG section and the Braunwald's ECG sections which are the most authoritative.
Reading File
Reading File
Now let me read the main ECG chapter from Harrison's and the Braunwald's ECG chapter for the comprehensive overview.
Reading File
Reading File
Let me now get the actual core ECG content - the Harrison's ECG chapter section and the Braunwald dedicated ECG chapter.
Finding Sources
Finding Sources
Reading File
Reading File
Now let me read the Harrison's ECG dedicated section (which I found at line 1270 area) and also fetch the main ECG figure from Harrison's.
Reading File
I now have excellent material from Harrison's. Let me fetch the key ECG waveform image and read the remaining important ECG section.
Loading Image
Reading File
I now have comprehensive, rich content from Harrison's Principles of Internal Medicine. Let me also quickly fetch the normal ECG image and get the bundle branch block section.
Loading Image
Reading File
I now have all the content I need to write a comprehensive ECG overview. Let me compile this into a thorough study guide.
ECG (Electrocardiogram) - Full Overview & Study Notes
Based on Harrison's Principles of Internal Medicine 22E and Braunwald's Heart Disease
What is an ECG?
An ECG records the electrical activity of the heart from electrodes placed on the skin. It measures voltage differences over time, displayed as waveforms on graph paper. It is the most inexpensive, risk-free, and widely used cardiac diagnostic tool.
1. ECG Paper & Basic Measurements
ECG paper runs at 25 mm/s (standard speed):
- Each small box (1 mm) = 40 ms (0.04 s)
- Each large box (5 mm) = 200 ms (0.20 s)
- Vertical axis: amplitude - standard calibration is 1 mV = 10 mm
Heart rate calculation:
- Divide 300 by the number of large boxes between R waves
- Or divide 1500 by the number of small boxes between R waves
2. The ECG Waveforms
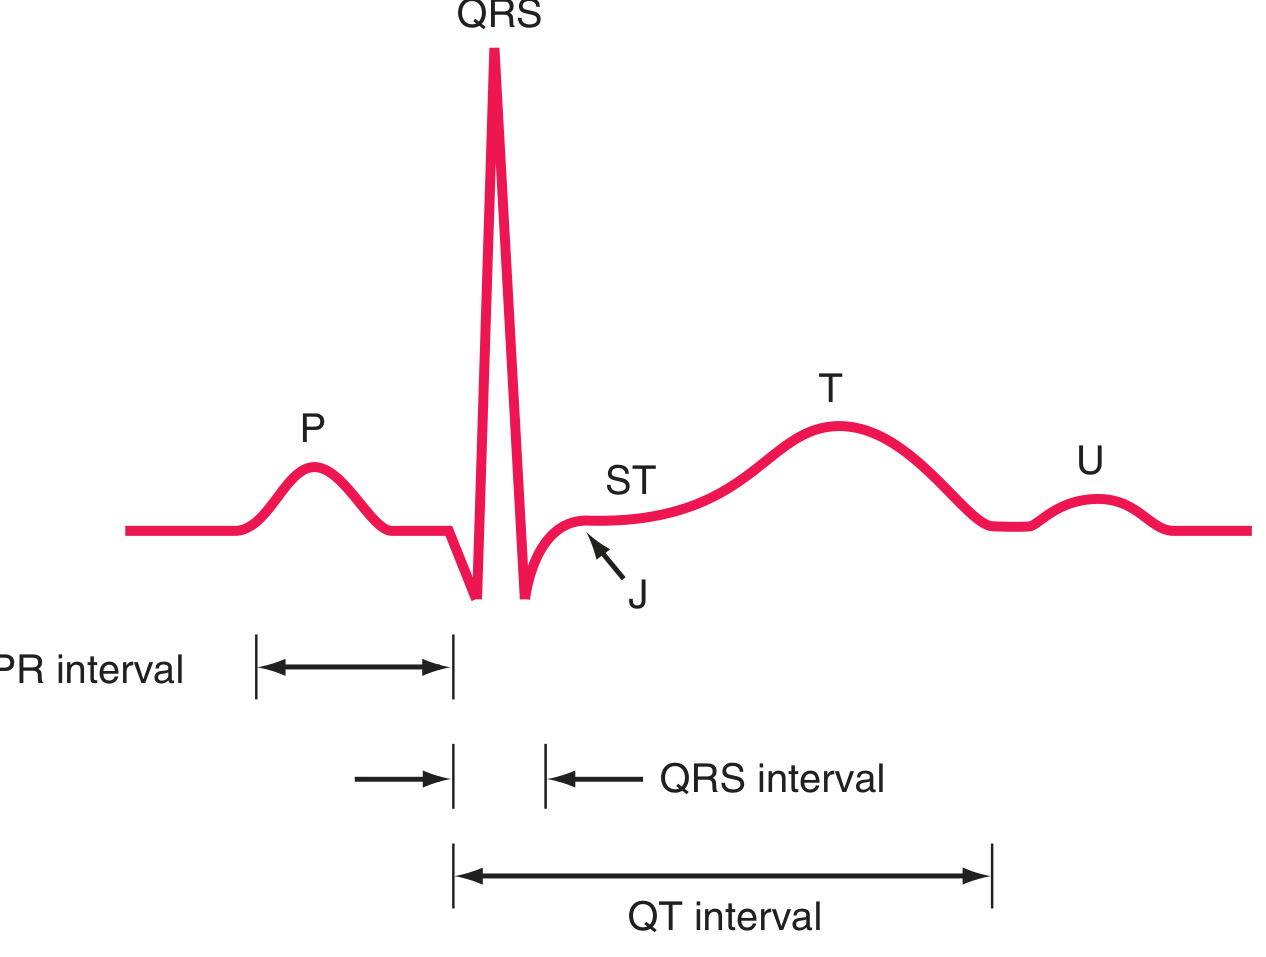
Figure: Basic ECG waveforms and intervals - Harrison's Principles of Internal Medicine 22E
| Wave/Segment | Represents | Normal Duration/Value |
|---|---|---|
| P wave | Atrial depolarization | <120 ms, <2.5 mm tall |
| PR interval | Atrio-ventricular conduction delay | 120-200 ms |
| QRS complex | Ventricular depolarization | ≤100-110 ms |
| ST segment | Ventricular plateau (phase 2 of action potential) | Isoelectric (flat) |
| T wave | Ventricular repolarization (phase 3) | Upright in most leads |
| U wave | Possibly Purkinje repolarization | Small, after T wave |
| QT interval | Total ventricular depolarization + repolarization | Rate-dependent; QTc: ≤460 ms (women), ≤450 ms (men) |
| J point | Junction between end of QRS and start of ST segment | At baseline |
Action potential correlations:
- Phase 0 (rapid upstroke, Na+ influx) → QRS onset
- Phase 2 (plateau) → isoelectric ST segment
- Phase 3 (active repolarization) → T wave
3. The 12 Leads
A normal 12-lead ECG shown below:
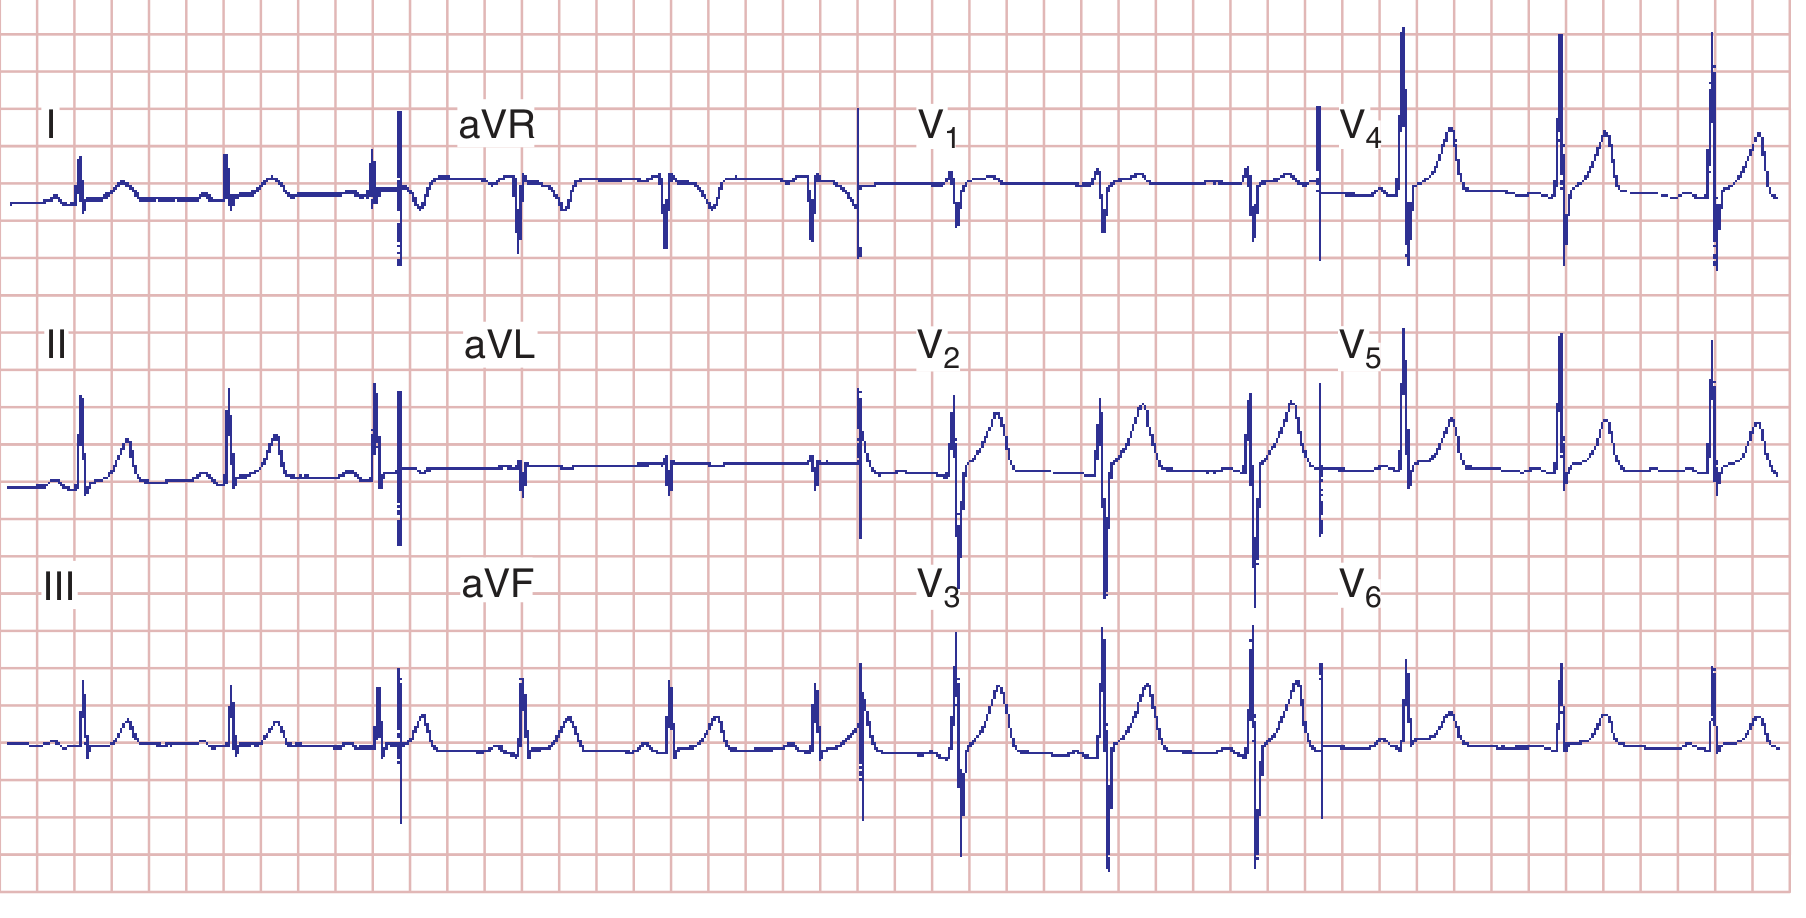
Figure: Normal ECG - sinus rhythm at 75 bpm, PR 160 ms, QRS 80 ms, QTc ~390 ms, axis ~+70° - Harrison's 22E
Limb Leads (Frontal Plane)
| Lead | Orientation | Looks at |
|---|---|---|
| I | 0° | Lateral (left) |
| II | +60° | Inferior |
| III | +120° | Inferior |
| aVR | -150° | Cavity (inverted view) |
| aVL | -30° | Lateral (high) |
| aVF | +90° | Inferior |
Precordial (Chest) Leads (Horizontal Plane)
| Lead | Position | Looks at |
|---|---|---|
| V1 | 4th ICS, right sternal border | Septal / RV |
| V2 | 4th ICS, left sternal border | Septal |
| V3 | Between V2 and V4 | Anterior |
| V4 | 5th ICS, midclavicular line | Anterior |
| V5 | Anterior axillary line | Lateral |
| V6 | Midaxillary line | Lateral |
Lead polarity rule: A depolarization wave moving toward the positive pole of a lead produces an upright (positive) deflection. Moving away produces a negative deflection. Moving perpendicular produces a biphasic deflection.
4. Normal P Wave
- Sinus node fires → depolarization spreads right → left atrium
- Normal vector: downward and leftward
- Positive in lead II, negative in aVR (diagnostic of sinus rhythm)
- In V1: may be biphasic (positive = RA depolarization; small negative = LA depolarization)
- Ectopic/junctional pacemakers produce retrograde P waves (negative in II, positive in aVR)
5. Normal QRS Complex
Ventricular depolarization proceeds in 3 phases:
- Septal depolarization - left-to-right → small r in V1, small q in V5/V6
- Free wall depolarization - both ventricles simultaneously (LV dominates due to mass) → main QRS deflection
- Basal depolarization - last portion of ventricles
R-wave progression: R waves increase in amplitude V1→V5/V6 (the "transition zone" where R=S is normally at V3/V4). Loss of R-wave progression suggests anterior MI.
6. Mean QRS Axis
Normal axis: -30° to +90°
| Axis | Range | Causes |
|---|---|---|
| Normal | -30° to +90° | - |
| Left axis deviation (LAD) | < -30° | LBBB, left anterior fascicular block, inferior MI, LVH |
| Right axis deviation (RAD) | > +90° | RVH, RBBB, left posterior fascicular block, lateral MI |
| Extreme / northwest | -90° to ±180° | Ventricular tachycardia, severe RVH |
Quick axis check: If QRS is positive in both I and aVF → normal axis. Positive in I, negative in aVF → LAD. Negative in I, positive in aVF → RAD.
7. Key Intervals - Normal Values
| Interval | Normal | Abnormal → Think |
|---|---|---|
| PR | 120-200 ms | Short (<120 ms): WPW, junctional rhythm / Long (>200 ms): 1st degree AV block |
| QRS | ≤110 ms | Wide (>120 ms): BBB, ventricular rhythm, WPW, hyperkalemia |
| QT (corrected) | ≤450 ms (men), ≤460 ms (women) | Prolonged: drugs (antiarrhythmics, antipsychotics), hypokalemia, hypocalcemia, hypomagnesemia, congenital LQTS → risk of Torsades de pointes |
| QTc formula (Bazett) | QTc = QT/√RR | - |
8. Bundle Branch Blocks
Right Bundle Branch Block (RBBB) - QRS ≥120 ms:
- RSR' ("rabbit ears") in V1/V2 - the classic pattern
- Wide, slurred S wave in I, V5, V6
- May be normal variant or seen with RVH, ASD, PE, anterior MI
Left Bundle Branch Block (LBBB) - QRS ≥120 ms:
- Broad, notched R wave ("M" shape) in I, aVL, V5, V6
- Deep QS in V1/V2
- Important: LBBB causes widespread ST-T changes that make ischemia hard to detect. New LBBB with chest pain may indicate acute MI (Sgarbossa criteria used).
9. Chamber Enlargement & Hypertrophy
Atrial Abnormalities
- Right atrial overload (P-pulmonale): P wave amplitude ≥2.5 mm (tall, peaked), best seen in II
- Left atrial abnormality (P-mitrale): Broad (≥120 ms), notched P wave in limb leads; biphasic P wave in V1 with prominent negative component
Ventricular Hypertrophy
Right ventricular hypertrophy (RVH):
- Tall R wave in V1 (R ≥ S), right axis deviation
- ST depression + T-wave inversion in right precordial leads (V1-V3)
Left ventricular hypertrophy (LVH) - common voltage criteria:
- Sokolow-Lyon: S in V1 + R in V5 or V6 ≥35 mm
- Cornell: R in aVL + S in V3 ≥28 mm (men), ≥20 mm (women)
- LVH is associated with ST-T changes ("strain pattern") in lateral leads (I, aVL, V5, V6)
10. Ischemia and Infarction
Ischemia (reversible)
- Subendocardial ischemia: ST depression (horizontal or downsloping) in affected leads
- Transmural ischemia/vasospasm: ST elevation (e.g., Prinzmetal's angina)
- T-wave inversions: deep, symmetric T-wave inversions in precordial leads (especially V1-V4) suggest LAD stenosis - the Wellens sign
Infarction - Temporal Evolution
| Stage | ECG Changes |
|---|---|
| Hyperacute (minutes) | Tall, broad, peaked T waves |
| Acute (hours) | ST elevation + developing Q waves |
| Evolving (hours-days) | Q waves deepen, ST normalizes, T-wave inversion |
| Chronic/old (weeks-months) | Persistent Q waves ± T-wave normalization |
Infarct Localization by Lead
| Territory | Leads | Artery |
|---|---|---|
| Inferior | II, III, aVF | RCA (or LCx) |
| Anterior | V1-V4 | LAD |
| Lateral | I, aVL, V5, V6 | LCx |
| Septal | V1-V2 | Septal branches of LAD |
| Posterior | Reciprocal tall R + ST depression in V1-V2 | RCA/LCx |
| Right ventricular | V3R-V6R (right-sided leads) | RCA proximal |
Q wave criteria for pathological Q wave: ≥40 ms (0.04 s) wide OR ≥25% of R-wave amplitude.
11. Arrhythmia Recognition
Rate & Rhythm - Normal Sinus Rhythm Criteria
- Rate 60-100 bpm
- P wave before every QRS; QRS after every P
- PR interval 120-200 ms, constant
- P wave positive in II, negative in aVR
Common Arrhythmias at a Glance
| Arrhythmia | Key ECG Features |
|---|---|
| Sinus bradycardia | Rate <60, normal P-QRS-T |
| Sinus tachycardia | Rate >100, normal P-QRS-T |
| Atrial fibrillation (AF) | No distinct P waves; irregularly irregular rhythm; fibrillatory baseline |
| Atrial flutter | "Sawtooth" flutter waves at ~300/min, usually 2:1 block → ventricular rate ~150 |
| SVT (AVNRT/AVRT) | Regular, narrow-complex tachycardia ~150-250 bpm, P waves often hidden |
| 1st degree AV block | PR >200 ms, every P conducts |
| 2nd degree AV block - Mobitz I (Wenckebach) | Progressive PR lengthening → dropped QRS |
| 2nd degree AV block - Mobitz II | Constant PR, sudden dropped QRS (more dangerous) |
| 3rd degree (complete) AV block | Complete AV dissociation; P and QRS independent |
| LBBB | Wide QRS, broad R in I/aVL/V5/V6, QS in V1-V2 |
| RBBB | Wide QRS, RSR' in V1, slurred S in I/V5/V6 |
| WPW | Short PR (<120 ms), delta wave, wide QRS; risk of AF with rapid conduction |
| VT | Wide complex (≥120 ms), regular, rate >100 bpm, AV dissociation |
| VF | Chaotic, irregular, no recognizable complexes |
| Torsades de pointes | Polymorphic VT twisting around isoelectric line; preceded by long QT |
12. ST/T Changes - Important Patterns
| Condition | ECG Pattern |
|---|---|
| Pericarditis | Diffuse ST elevation (saddle-shaped), PR depression; no reciprocal changes |
| Digoxin effect | "Scooped" (reverse-tick) ST depression, shortened QT |
| Hyperkalemia | Peaked T waves → wide QRS → sine wave → VF |
| Hypokalemia | Flat T waves, prominent U waves, apparent QU prolongation |
| Hypocalcemia | Prolonged QT (long ST segment) |
| Hypercalcemia | Shortened QT |
| Hypothermia | Osborn (J) wave - convex hump at J point; sinus bradycardia; QT prolongation |
| Pulmonary embolism | S1Q3T3 (S wave in I, Q wave + T inversion in III), sinus tachycardia, RBBB, right axis |
| Brugada syndrome | RBBB pattern + ST elevation in V1-V3 (coved/saddle-back type) |
| Pericardial effusion/tamponade | Sinus tachycardia + low voltage + electrical alternans |
13. Systematic Approach to Every ECG (Harrison's 14-Step Method)
- Calibration and technical quality (lead placement, artifacts, 1 mV = 10 mm standard)
- Rhythm (regular/irregular, identify P waves)
- Heart rate
- PR interval / AV conduction
- QRS duration
- QT/QTc interval
- Mean QRS axis
- P wave morphology
- QRS voltage (hypertrophy criteria)
- Precordial R-wave progression
- Abnormal Q waves (infarct?)
- ST segments (elevation or depression)
- T wave morphology
- U waves
Always compare with prior ECGs when available. Many errors in ECG interpretation are errors of omission - being systematic prevents missing findings.
14. QTc Formulas
| Formula | Calculation |
|---|---|
| Bazett (classic) | QTc = QT / √RR (in seconds) |
| Framingham | QTc = QT + 0.154(1000 - RR) in ms |
Upper normal: QTc ≤460 ms in women, ≤450 ms in men
15. Important ECG Patterns You Must Know
| Eponym/Pattern | Description |
|---|---|
| Wellens sign | Deep T inversions in V1-V4; indicates critical LAD stenosis |
| De Winter T waves | Upsloping ST depression + tall peaked T in precordials; indicates proximal LAD occlusion (STEMI equivalent) |
| Sgarbossa criteria | For diagnosing MI in LBBB: ST elevation ≥1 mm concordant with QRS; ST depression ≥1 mm in V1-V3; or ST elevation ≥5 mm discordant |
| Brugada pattern | Coved ST elevation in V1-V2 ± RBBB morphology; risk of sudden death |
| Osborn (J) wave | Convex J-point hump in hypothermia |
| Delta wave | Slurred initial QRS upstroke in WPW (accessory pathway pre-excitation) |
| Epsilon wave | Small deflection after QRS in V1-V3; marker of ARVC (arrhythmogenic right ventricular cardiomyopathy) |
| Electrical alternans | Beat-to-beat alternation in QRS amplitude; classic for pericardial tamponade |
Sources
- Harrison's Principles of Internal Medicine, 22nd Edition (2025), Chapter 247: Electrocardiography - Goldberger AL
- Braunwald's Heart Disease: A Textbook of Cardiovascular Medicine - Electrocardiography chapter
This is a shared conversation. Sign in to Orris to start your own chat.