
Uh, see, I have my university exams, like, uh, you know, just a few days, and I haven't studied physiology at all the whole first year. So now I have to study. So I'm going to give you some topics, like, accordingly, and you explain it to me very, very nicely, okay? So that I can understand also, and I can write it in such length that, uh, I get rewarded good marks for them. Okay. So for LAQ, like LAQ, accordingly, you should know the length. So for LAQ, we have to write a lot. So, uh, for LAQ topics, we have cardiac cycle, coronary circulation, blood pressure, circulatory shock, ECG, and, um, mean arterial pressure, like define, enumerate mechanisms regulating, especially the baroreceptor mechanism. Uh, yeah, that's-- And cardiac output. Cardiac output also. Like, everything. Explain everything.
- Cardiac Cycle - phases (systole/diastole), pressure-volume changes, heart sounds, Wiggers diagram
- Coronary Circulation - anatomy, phasic flow changes, regulation, coronary reserve
- Cardiac Output - definition, normal value, Fick principle, factors regulating (preload, afterload, contractility, heart rate), measurement methods
- Mean Arterial Pressure (MAP) - definition, determinants, and full regulation: baroreceptor reflex (short-term), plus chemoreceptors, CNS ischemic response, renal/hormonal (long-term - RAAS, ANP)
- Blood Pressure - definition, normal values, short-term vs long-term regulation mechanisms
- ECG - genesis, waves (P-QRS-T), intervals, leads, normal values, clinical correlation
- Circulatory Shock - definition, types (hypovolemic, cardiogenic, septic, anaphylactic, neurogenic), stages, compensatory mechanisms, decompensation
Which LAQ topic should we do first, in full exam-writing depth?
- Cardiac Cycle - phases (systole/diastole), pressure-volume changes, heart sounds, Wiggers diagram
- Coronary Circulation - anatomy, phasic flow changes, regulation, coronary reserve
- Cardiac Output - definition, normal value, Fick principle, factors regulating (preload, afterload, contractility, heart rate), measurement methods
- Mean Arterial Pressure (MAP) - definition, determinants, and full regulation: baroreceptor reflex (short-term), plus chemoreceptors, CNS ischemic response, renal/hormonal (long-term - RAAS, ANP)
- Blood Pressure - definition, normal values, short-term vs long-term regulation mechanisms
- ECG - genesis, waves (P-QRS-T), intervals, leads, normal values, clinical correlation
- Circulatory Shock - definition, types (hypovolemic, cardiogenic, septic, anaphylactic, neurogenic), stages, compensatory mechanisms, decompensation
MEAN ARTERIAL PRESSURE (MAP) - Definition, Regulation, and Baroreceptor Mechanism
1. Definition
2. Enumeration of Mechanisms Regulating Arterial Pressure
A. Rapidly acting (seconds) - Nervous mechanisms
- Baroreceptor reflex (carotid sinus and aortic arch) - fastest, most important short-term regulator
- Chemoreceptor reflex (carotid and aortic bodies) - responds mainly to hypoxia, also to fall in BP below ~80 mmHg
- CNS ischemic response - activated only when brain blood flow falls severely (BP < 40-50 mmHg); causes massive sympathetic discharge ("last-ditch stand" mechanism)
- Atrial and pulmonary artery reflexes (low pressure receptors/volume receptors) - respond to blood volume changes, trigger reflex tachycardia and affect ADH/renal function
B. Intermediate acting (minutes)
- Renin-Angiotensin-Aldosterone System (RAAS) - angiotensin II causes vasoconstriction (minutes) and later aldosterone-mediated Na+/water retention (hours)
- Stress-relaxation of vasculature - vessels adjust their tone when overstretched or underfilled
- Capillary fluid shift mechanism - fluid moves between plasma and interstitium to correct blood volume
C. Long-term (hours to days) - the most powerful for chronic control
- Renal-body fluid (pressure diuresis/natriuresis) mechanism - Guyton's cornerstone concept: rising arterial pressure increases renal excretion of salt and water, reducing blood volume and bringing pressure back down. This is considered the dominant long-term controller of MAP.
- Antidiuretic hormone (ADH/vasopressin) - water retention, mild vasoconstriction
- Atrial natriuretic peptide (ANP) - released from stretched atria, promotes natriuresis and vasodilation, opposes RAAS
3. The Baroreceptor Mechanism (Baroreceptor Reflex) - Detailed
Definition
A. Receptors (Baroreceptors)
- Type: Spray-type / stretch receptors (mechanoreceptors) - NOT stimulated by pressure itself, but by the stretch/distension of the vessel wall that pressure produces.
- Location:
- Carotid sinus - slight dilatation of the internal carotid artery just above the bifurcation of the common carotid artery
- Aortic arch
- Carotid sinus baroreceptors respond to both rise AND fall in pressure; aortic arch baroreceptors are more sensitive to rises in pressure.
B. Afferent Pathway
- From carotid sinus -> Hering's nerve -> glossopharyngeal nerve (CN IX) -> Nucleus Tractus Solitarius (NTS) in the medulla
- From aortic arch -> vagus nerve (CN X) -> same NTS in medulla
C. Center
- Nucleus Tractus Solitarius (NTS) in the medulla receives and integrates the afferent signal, then connects to:
- Vasomotor/vasoconstrictor center (excitatory, in rostral ventrolateral medulla)
- Cardioinhibitory (vagal) center (nucleus ambiguus/dorsal motor nucleus of vagus)
D. Efferent Pathway
- Sympathetic fibers -> heart (SA node, myocardium) and blood vessels (arterioles, veins)
- Parasympathetic (vagal) fibers -> SA node of the heart
E. Mechanism of Action - Response to a RISE in Arterial Pressure
- Increased arterial pressure -> increased stretch of carotid sinus/aortic arch walls
- Increased firing rate of baroreceptor afferents -> NTS
- NTS response: increases parasympathetic (vagal) outflow to heart AND inhibits sympathetic outflow to heart and vessels
- Effects (all act to bring pressure back DOWN toward normal):
- Decreased heart rate (negative chronotropic, vagal)
- Decreased contractility -> decreased stroke volume -> decreased CO
- Vasodilation of arterioles -> decreased TPR
- Venodilation -> decreased venous return
F. Response to a FALL in Arterial Pressure (e.g., hemorrhage) - reverse pattern
| Parameter | Response to fall in MAP |
|---|---|
| Heart rate | Increased |
| Contractility | Increased |
| Total Peripheral Resistance | Increased (arteriolar constriction, sparing brain & heart) |
| Venous tone (unstressed volume) | Decreased -> increased venous return, increased stressed volume |
| Net effect | Cardiac output and TPR both rise -> MAP restored toward normal |
G. Response Characteristics (important for LAQ marks)
- Operating range: Carotid sinus baroreceptors are silent below ~50-60 mmHg, respond progressively up to about 180 mmHg
- Maximal sensitivity is at the normal operating point around 100 mmHg - i.e., the reflex is most sensitive exactly where it is needed most (a small change in pressure around normal produces a large change in reflex signal)
- Rate sensitivity: Baroreceptors respond more strongly to a rapidly changing pressure than to a sustained/stationary pressure at the same value
- Adaptation/Resetting: Baroreceptors adapt within 1-2 days to a sustained change in pressure (e.g., in chronic hypertension, the set-point resets to the new higher pressure). This is why the baroreceptor reflex is considered important only for short-term, not long-term, BP control - a key point examiners specifically test.
H. Physiological Significance
- Buffers transient changes in BP during postural change (e.g., standing up), exercise, and Valsalva maneuver
- Central compensatory mechanism in hemorrhage and shock (this links directly to your Circulatory Shock topic - same reflex, different context)
- Clinically relevant in carotid sinus massage/hypersensitivity, carotid sinus syncope, and baroreceptor stimulation devices used in resistant hypertension
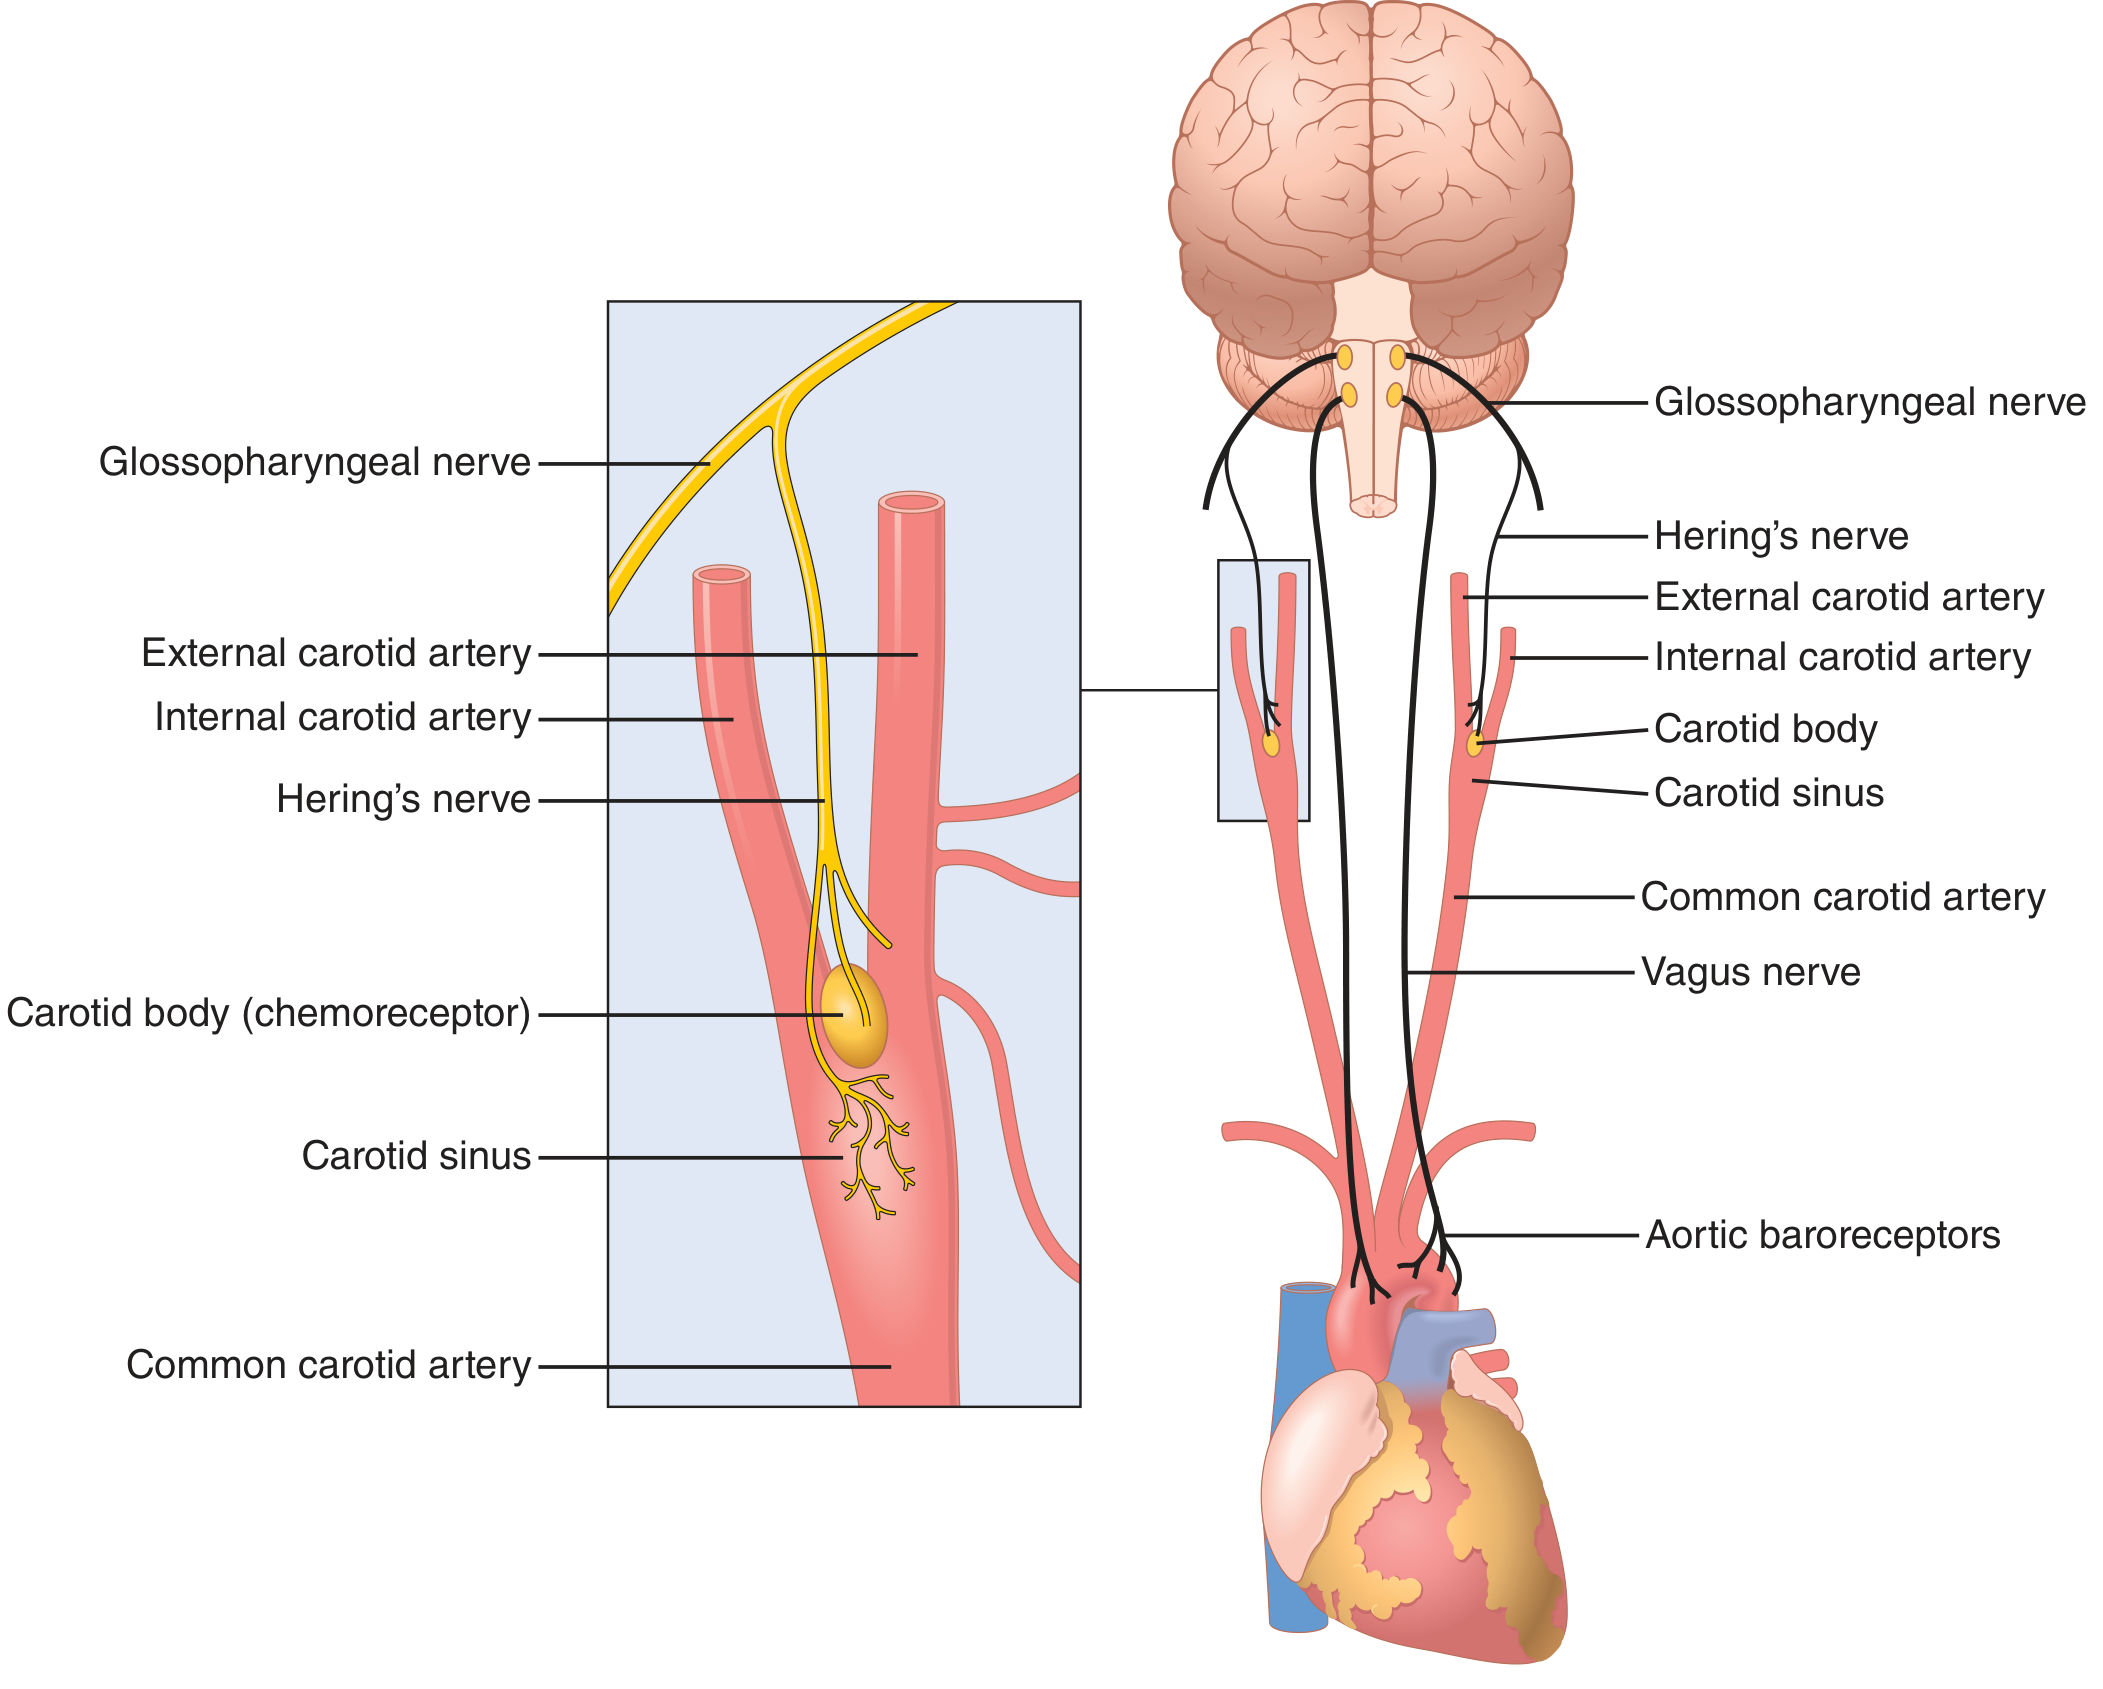
How to structure this for full LAQ marks
- Define MAP + formula + normal value (2 marks)
- Enumerate all regulatory mechanisms, short vs long term (2-3 marks)
- Detailed baroreceptor mechanism: receptors -> afferents -> center -> efferents -> effects, with labeled diagram (6-8 marks - this is where most marks are)
- Special properties: operating range, rate sensitivity, resetting (2 marks)
- One line on clinical/physiological significance (1 mark)
The next topic that I'd like to do is the cardiac cycle.
Wiggers diagram cardiac cycle pressure volume ECG heart sounds
THE CARDIAC CYCLE
1. Definition
2. The Seven Phases of the Cardiac Cycle (correlate with Wiggers diagram)
Phase A: Atrial Systole
- Triggered by the P wave (atrial depolarization) + PR interval
- Left atrium contracts, atrial pressure rises slightly, pushes final ~20-30% of blood into the already-filling ventricle (atrial kick)
- Mitral valve is open; aortic valve closed
- Produces the a wave of the venous/atrial pressure pulse
- S4 (fourth heart sound) may coincide here - not normally audible in healthy adults, heard in reduced ventricular compliance (e.g., ventricular hypertrophy)
Phase B: Isovolumetric Ventricular Contraction
- Begins with the QRS complex (ventricular depolarization)
- Ventricular pressure rises steeply, exceeds atrial pressure -> mitral valve closes
- Ventricular pressure is still less than aortic pressure, so the aortic valve remains closed too
- All 4 valves closed -> volume is constant while pressure rises rapidly (hence "isovolumetric" / isovolumic)
- Mitral valve closure produces the first heart sound (S1) - "lub"
Phase C: Rapid Ventricular Ejection
- ST segment on ECG
- Ventricular pressure exceeds aortic pressure -> aortic valve opens
- Blood ejected rapidly into the aorta; ventricular volume falls sharply
- Both ventricular and aortic pressures rise together and reach their peak/maximum in this phase
- No heart sound normally audible here (silent phase)
Phase D: Reduced Ventricular Ejection
- Coincides with the T wave (ventricular repolarization)
- Ejection continues but at a slower rate
- Ventricular volume reaches its minimum (= end-systolic volume, ~50 mL)
- Aortic pressure begins to fall as blood runs off into the peripheral arterial tree faster than it's being added
- Ventricular pressure actually falls slightly below aortic pressure toward the end, but forward momentum keeps blood flowing briefly
Phase E: Isovolumetric Ventricular Relaxation
- Ventricle relaxes, pressure falls rapidly
- Once ventricular pressure drops below aortic pressure -> aortic valve closes
- This closure produces the second heart sound (S2) - "dub" - and produces the characteristic small notch on the aortic pressure curve called the incisura (dicrotic notch)
- Mitral valve still closed (LV pressure still above LA pressure momentarily) -> again all 4 valves closed, volume constant while pressure falls steeply
Phase F: Rapid Ventricular Filling
- Ventricular pressure falls below atrial pressure -> mitral valve opens
- Blood that has been accumulating in the atria (venous return) rushes rapidly into the relaxed ventricle
- Ventricular volume rises quickly; pressure stays low
- May produce a third heart sound (S3) in this phase if audible - physiological in children/young adults, pathological (suggests volume overload/heart failure) in older adults
Phase G: Reduced Ventricular Filling (Diastasis)
- The longest but "quietest" phase - passive filling slows down as ventricular and atrial pressures equalize
- Ventricle continues to fill slowly until the next P wave initiates atrial systole again, closing the loop
3. Summary Table (write this - high yield for marks)
| Phase | Ventricular volume | Valves | ECG event | Heart sound |
|---|---|---|---|---|
| Atrial systole | Slight increase | Mitral open, Aortic closed | P wave | S4 (if present) |
| Isovolumetric contraction | Constant | All closed | QRS | S1 |
| Rapid ejection | Decreases sharply | Aortic open | ST segment | - |
| Reduced ejection | Decreases (to minimum) | Aortic open | T wave | - |
| Isovolumetric relaxation | Constant | All closed | - | S2 |
| Rapid filling | Increases sharply | Mitral open | - | S3 (if present) |
| Diastasis | Increases slowly | Mitral open | - | - |
4. Pressure and Volume Values to Quote
- Left ventricular pressure: rises from ~0-8 mmHg (diastole) to ~120 mmHg (peak systole)
- Aortic pressure: oscillates between ~80 mmHg (diastolic) and ~120 mmHg (systolic)
- Left atrial pressure: low throughout, ~2-10 mmHg, with three small waves: a wave (atrial contraction), c wave (bulging of AV valve into atrium during isovolumic contraction/early ventricular contraction), and v wave (atrial filling against closed mitral valve)
- End-diastolic volume (EDV): ~110-120 mL
- End-systolic volume (ESV): ~50 mL
- Stroke volume (EDV - ESV): ~70 mL
- Ejection fraction (SV/EDV): ~60-65% normally - this links directly into your Cardiac Output topic
5. Heart Sounds (mechanism - a common sub-question)
- S1 ("lub"): closure of mitral and tricuspid (AV) valves at start of systole; caused by vibration of the tensed valve leaflets and chordae tendineae when back-surging blood abruptly stops them; duration ~0.14 sec, lower pitch (AV valves less taut)
- S2 ("dub"): closure of aortic and pulmonary (semilunar) valves at end of systole; vibration of taut semilunar valves and elastic recoil of arterial walls; duration ~0.11 sec, higher pitch (semilunar valves are tauter)
- S3: rapid ventricular filling phase - physiological in youth, pathological if loud in adults (volume overload, heart failure, dilated ventricle)
- S4: atrial contraction against a stiff, non-compliant ventricle - always pathological in adults (hypertrophy, ischemia, hypertension)
6. Right Heart vs Left Heart (mention briefly)
- Develops much lower peak systolic pressure (~25 mmHg vs 120 mmHg)
- Isovolumetric contraction/relaxation periods are shorter
- Pulmonary valve opens slightly before and closes slightly after the aortic valve
How to score full marks on this LAQ
- Definition + duration of cycle, systole vs diastole (2 marks)
- Well-labeled Wiggers diagram with all 5 tracings (6-8 marks - this is the single biggest scoring element)
- Phase-by-phase description with valve status and pressure-volume correlation (6-8 marks)
- Heart sounds mechanism correlated to phases (3-4 marks)
- Normal values: EDV, ESV, SV, EF, pressures (2 marks)
Make a visual Wiggers diagram poster I can print and study
An educational physiology poster titled "The Cardiac Cycle - Wiggers Diagram" for exam study. It shows five vertically stacked graph panels sharing the same horizontal time axis (one cardiac cycle, in seconds), divided into 7 labeled vertical phase bands: 1) Atrial Systole, 2) Isovolumetric Ventricular Contraction, 3) Rapid Ventricular Ejection, 4) Reduced Ventricular Ejection, 5) Isovolumetric Ventricular Relaxation, 6) Rapid Ventricular Filling, 7) Diastasis (Reduced Filling). Panel 1 (top): ECG waveform showing P wave, QRS complex, T wave aligned with the correct phases. Panel 2: Aortic pressure curve (oscillating between about 80 and 120 mmHg) with a labeled dicrotic notch (incisura) where the aortic valve closes. Panel 3: Left ventricular pressure curve (rising from near 0 to about 120 mmHg and back down), overlapping conceptually with the aortic pressure curve during ejection, with labeled points for "Mitral valve closes", "Aortic valve opens", "Aortic valve closes", "Mitral valve opens". Panel 4: Left atrial pressure curve, small waveform showing labeled a wave, c wave, and v wave. Panel 5: Left ventricular volume curve, a loop-like curve showing decrease during ejection to end-systolic volume (~50 mL) and increase during filling to end-diastolic volume (~120 mL), with those two volumes labeled with dashed reference lines. Bottom panel: a phonocardiogram / heart sounds track showing labeled S1, S2, S3, and S4 marks positioned at the correct time points in the cycle. All panels are vertically aligned so the phase boundaries line up across every graph with thin dashed vertical guide lines. Clear axis labels (Pressure in mmHg, Volume in mL, Time in seconds). Clean textbook medical diagram style, black and white line-art with light color accents distinguishing each curve, suitable for printing on a single page as a study poster.
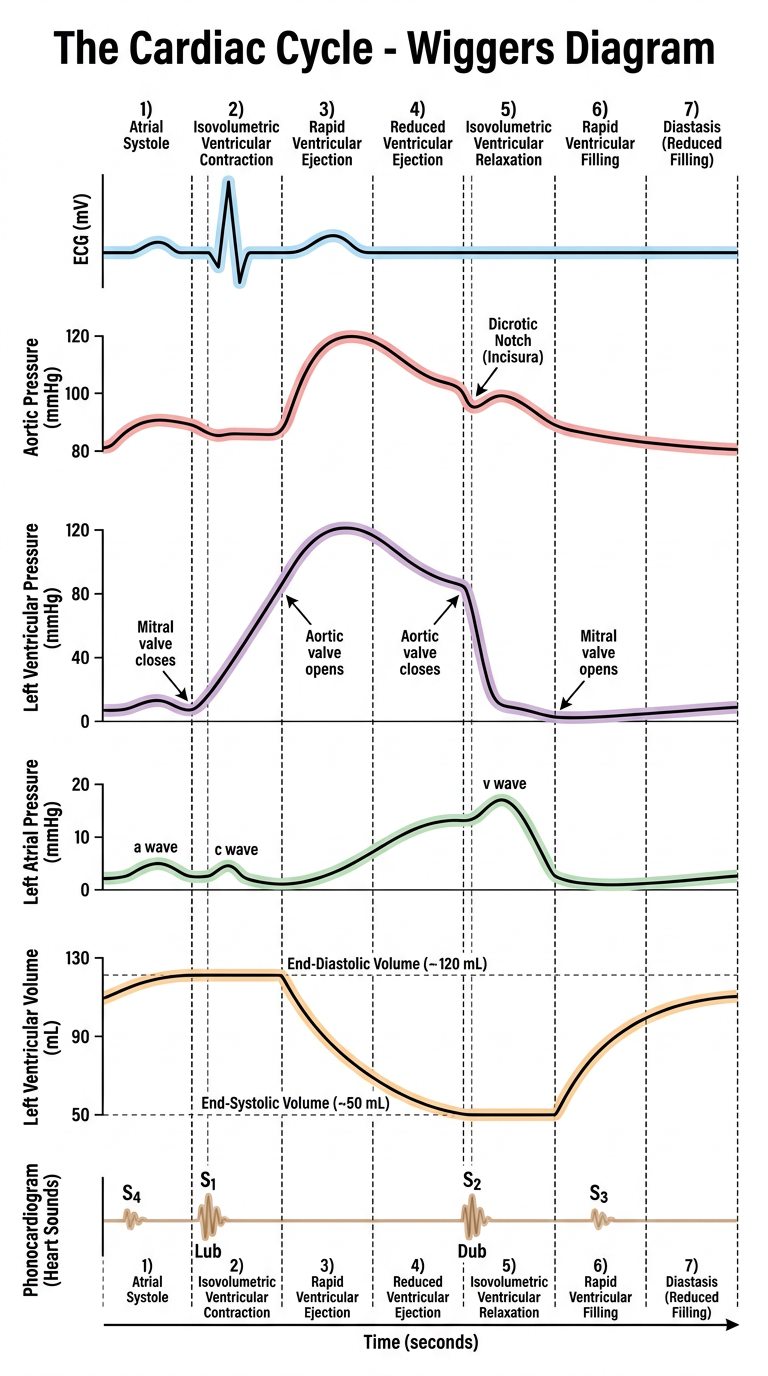
- ECG (P, QRS, T waves)
- Aortic pressure with the dicrotic notch
- LV pressure with mitral/aortic valve open-close points marked
- LA pressure with a, c, v waves
- LV volume with end-diastolic and end-systolic volumes marked
- Heart sounds (S1-S4) at their correct time points
Incorporate this diagram in the answer above of the cardiac cycle.
THE CARDIAC CYCLE
1. Definition
Wiggers Diagram (draw this - it's the highest-scoring element of this LAQ)
2. The Seven Phases of the Cardiac Cycle (correlate with the diagram above)
Phase A: Atrial Systole
- Triggered by the P wave (atrial depolarization) + PR interval
- Left atrium contracts, atrial pressure rises slightly, pushes final ~20-30% of blood into the already-filling ventricle (atrial kick)
- Mitral valve open; aortic valve closed
- Produces the a wave of the atrial/venous pressure pulse
- S4 may coincide here - not normally audible in healthy adults, heard in reduced ventricular compliance (e.g., ventricular hypertrophy)
Phase B: Isovolumetric Ventricular Contraction
- Begins with the QRS complex (ventricular depolarization)
- Ventricular pressure rises steeply, exceeds atrial pressure -> mitral valve closes
- Ventricular pressure still less than aortic pressure, so aortic valve remains closed too
- All 4 valves closed -> volume constant while pressure rises rapidly ("isovolumetric")
- Mitral valve closure produces the first heart sound (S1) - "lub"
Phase C: Rapid Ventricular Ejection
- ST segment on ECG
- Ventricular pressure exceeds aortic pressure -> aortic valve opens
- Blood ejected rapidly into the aorta; ventricular volume falls sharply
- Both ventricular and aortic pressures rise together and reach their peak/maximum here
- No heart sound normally audible in this phase
Phase D: Reduced Ventricular Ejection
- Coincides with the T wave (ventricular repolarization)
- Ejection continues but at a slower rate
- Ventricular volume reaches its minimum (= end-systolic volume, ~50 mL)
- Aortic pressure begins to fall as blood runs off into the peripheral arteries faster than it's being added
Phase E: Isovolumetric Ventricular Relaxation
- Ventricle relaxes, pressure falls rapidly
- Once ventricular pressure drops below aortic pressure -> aortic valve closes
- Produces the second heart sound (S2) - "dub" - and the dicrotic notch (incisura) on the aortic pressure curve
- Mitral valve still closed -> all 4 valves closed again, volume constant while pressure falls steeply
Phase F: Rapid Ventricular Filling
- Ventricular pressure falls below atrial pressure -> mitral valve opens
- Blood pooled in the atria rushes rapidly into the relaxed ventricle
- Ventricular volume rises quickly; pressure stays low
- May produce a third heart sound (S3) - physiological in children/young adults, pathological (volume overload/heart failure) in older adults
Phase G: Reduced Ventricular Filling (Diastasis)
- Longest but "quietest" phase - passive filling slows as ventricular and atrial pressures equalize
- Ventricle fills slowly until the next P wave restarts the cycle
3. Summary Table
| Phase | Ventricular volume | Valves | ECG event | Heart sound |
|---|---|---|---|---|
| Atrial systole | Slight increase | Mitral open, Aortic closed | P wave | S4 (if present) |
| Isovolumetric contraction | Constant | All closed | QRS | S1 |
| Rapid ejection | Decreases sharply | Aortic open | ST segment | - |
| Reduced ejection | Decreases (to minimum) | Aortic open | T wave | - |
| Isovolumetric relaxation | Constant | All closed | - | S2 |
| Rapid filling | Increases sharply | Mitral open | - | S3 (if present) |
| Diastasis | Increases slowly | Mitral open | - | - |
4. Pressure and Volume Values to Quote
- Left ventricular pressure: rises from ~0-8 mmHg (diastole) to ~120 mmHg (peak systole)
- Aortic pressure: oscillates between ~80 mmHg (diastolic) and ~120 mmHg (systolic)
- Left atrial pressure: low throughout, ~2-10 mmHg, with a, c, v waves (a = atrial contraction; c = AV valve bulging into atrium during isovolumic contraction; v = atrial filling against closed mitral valve)
- End-diastolic volume (EDV): ~110-120 mL
- End-systolic volume (ESV): ~50 mL
- Stroke volume (EDV - ESV): ~70 mL
- Ejection fraction (SV/EDV): ~60-65% (links directly to Cardiac Output)
5. Heart Sounds (mechanism)
- S1 ("lub"): closure of mitral and tricuspid valves at start of systole; vibration of tensed valve leaflets/chordae tendineae as back-surging blood abruptly stops them; duration ~0.14 sec, lower pitch
- S2 ("dub"): closure of aortic and pulmonary valves at end of systole; vibration of taut semilunar valves and elastic recoil of arterial walls; duration ~0.11 sec, higher pitch
- S3: rapid ventricular filling phase - physiological in youth, pathological if loud in adults
- S4: atrial contraction against a stiff, non-compliant ventricle - always pathological in adults
6. Right Heart vs Left Heart (brief mention)
How to score full marks on this LAQ
- Definition + duration of cycle, systole vs diastole (2 marks)
- Well-labeled Wiggers diagram, all 6 tracings (6-8 marks - biggest scoring element)
- Phase-by-phase description with valve status and pressure-volume correlation (6-8 marks)
- Heart sounds mechanism correlated to phases (3-4 marks)
- Normal values: EDV, ESV, SV, EF, pressures (2 marks)
Next, let's go with the cardiac output topic.
CARDIAC OUTPUT
1. Definition
- Stroke volume (SV) = ~70 mL/beat
- Heart rate (HR) = ~72 beats/min
- Stroke Volume = EDV - ESV = 140 - 70 = 70 mL
- Cardiac Output = SV x HR = 70 x 75 = 5250 mL/min
- Ejection Fraction = SV/EDV = 70/140 = 0.50 (50%)
2. Measurement of Cardiac Output
A. Fick Principle (Oxygen Fick Method) - most important, always asked
- Measure O2 consumption (VO2) - collect and analyze expired air over a timed interval
- Measure O2 content of arterial blood (peripheral artery puncture)
- Measure O2 content of mixed venous blood (pulmonary artery catheter - because right heart blood is not yet mixed with atrial/systemic differences until it reaches the pulmonary artery)
- Apply the formula
B. Indicator Dilution Method (Dye dilution / Thermodilution)
- A known quantity of indicator (dye, or cold saline in thermodilution) is injected into a vein
- Concentration of the indicator is measured downstream over time as it passes and recirculates
- CO is calculated from the amount injected and the area under the concentration-time curve
- Thermodilution using a Swan-Ganz (pulmonary artery) catheter is the clinically used bedside method today
C. Echocardiography
- Doppler measurement of blood flow velocity across the aortic valve combined with the cross-sectional area of the outflow tract gives stroke volume; multiplied by heart rate gives CO
- Non-invasive, widely used clinically
3. Factors Regulating Cardiac Output
A. Regulation of Heart Rate
- Autonomic nervous system: Sympathetic stimulation (via beta-1 receptors) increases HR (positive chronotropic); parasympathetic/vagal stimulation decreases HR (negative chronotropic) - this is the dominant control at rest (vagal tone predominates)
- Baroreceptor reflex (from your MAP topic) - directly adjusts HR to buffer BP changes
- Bainbridge reflex - stretch of right atrial receptors from increased venous return reflexively increases HR
- Chemical factors: hyperthermia, thyroid hormone, catecholamines increase HR; hypothermia, hyperkalemia can decrease it
- Intrinsic SA node properties: rate of phase 4 depolarization, maximum diastolic potential, threshold potential
B. Regulation of Stroke Volume - three classical determinants (write this as a dedicated sub-heading, high yield)
- Mechanism: increased venous return -> increased EDV -> increased stretch of myocardial fibers -> increased force of contraction (length-tension relationship of cardiac muscle, related to optimal actin-myosin overlap) -> increased stroke volume
- This intrinsic mechanism ensures that in the steady state, cardiac output = venous return - whatever comes into the heart is pumped back out, without requiring nervous control
- Factors increasing preload: increased blood volume, venoconstriction (sympathetic), skeletal muscle pump, respiratory pump, increased atrial contractility
- Afterload = the pressure/tension the ventricle must generate to eject blood = approximated clinically by aortic pressure / total peripheral resistance (for LV) and pulmonary artery pressure (for RV)
- Increased afterload (e.g., hypertension, aortic stenosis) -> for a given preload and contractility, stroke volume decreases because more of the contractile energy is used generating pressure rather than shortening/ejecting
- This is best demonstrated on the ventricular pressure-volume loop - increased afterload shifts the loop to a higher end-systolic pressure with reduced stroke volume width
- Contractility = the intrinsic strength of ventricular contraction at any given preload
- Positive inotropic agents (sympathetic stimulation/catecholamines, digoxin, increased Ca2+) shift the Frank-Starling curve upward and to the left - more stroke volume/CO for the same EDV, higher ejection fraction
- Negative inotropic agents (parasympathetic stimulation, myocardial ischemia/infarction, heart failure, many anesthetic/antiarrhythmic drugs, acidosis, hypoxia) shift the curve downward and to the right
- Mechanism: contractility changes reflect altered intracellular Ca2+ availability to the contractile machinery (independent of fiber length)
C. Ventricular Pressure-Volume Loop (excellent diagram for extra marks)
- Point 1 (end-diastole, ~140 mL, low pressure) -> isovolumetric contraction (vertical line up) -> Point 2 (mitral valve closes, aortic valve about to open)
- Point 2 -> 3: ejection phase (volume falls as aortic valve is open, pressure rises then falls slightly) -> Point 3 = end-systole (touches the systolic/maximal pressure-volume curve - this defines contractility)
- Point 3 -> 4: isovolumetric relaxation (vertical line down, aortic valve closes)
- Point 4 -> 1: ventricular filling (mitral valve open, volume rises back to EDV)
- Width of the loop = Stroke Volume
- Area of the loop = Stroke Work (external work done by the ventricle per beat)
- Increased contractility -> loop's upper-left corner (point 3) shifts left, and the whole loop widens (bigger SV) for the same EDV
- Increased afterload -> point 2-3 line shifts up, SV narrows
4. Other Physiological Factors Affecting Cardiac Output
- Venous return - determined by blood volume, venous tone, skeletal muscle pump, respiratory pump, gravity/posture
- Exercise - increases CO markedly (up to 25 L/min in trained athletes) via increased HR, contractility, and venous return
- Body size, metabolic rate, age, posture, pregnancy - all physiologically alter baseline CO
Summary structure for full LAQ marks
- Definition + formula + normal value + cardiac index (2 marks)
- Measurement: Fick principle with worked example, mention dye dilution/thermodilution/echo (4-5 marks)
- Regulation: heart rate control + stroke volume control (preload/Frank-Starling, afterload, contractility) with diagram (6-8 marks)
- Pressure-volume loop diagram and explanation (3-4 marks)
- Brief note on venous return/exercise physiology (1-2 marks)
Incorporate the diagram of ventricular pressure volume loop
An educational physiology diagram titled "Left Ventricular Pressure-Volume Loop" for exam study. X-axis labeled "Left Ventricular Volume (mL)" ranging from 0 to about 150, Y-axis labeled "Left Ventricular Pressure (mmHg)" ranging from 0 to about 130. The diagram shows a single closed loop with four labeled corner points forming a parallelogram-like shape: Point 1 at bottom right (volume ~140 mL, low pressure ~5 mmHg) labeled "1: End-Diastole (EDV)". A vertical line rising from Point 1 to Point 2 at the same volume but higher pressure (~80 mmHg), labeled "Isovolumetric Contraction" along this segment, with Point 2 labeled "Mitral valve closes". A curved line from Point 2 to Point 3 moving left and slightly up to peak pressure (~120 mmHg) at a lower volume (~70 mL), labeled "Ejection" along this segment, with Point 3 labeled "3: End-Systole (ESV)". A vertical line dropping from Point 3 to Point 4 at the same volume but lower pressure (~8 mmHg), labeled "Isovolumetric Relaxation" along this segment, with Point 4 labeled "Aortic valve closes". A curved line from Point 4 back to Point 1, moving right at low pressure, labeled "Ventricular Filling" along this segment. Show a dashed diagonal line touching point 3 representing the "End-Systolic Pressure-Volume Relationship (contractility line)". Show a dashed diagonal curved line touching point 1 and point 4 representing the "End-Diastolic Pressure-Volume Relationship (compliance curve)". Label the horizontal width of the loop between point 3 and point 1's volume as "Stroke Volume". Shade the interior area of the loop lightly and label it "Stroke Work". Add small dashed vertical reference lines from point 3 and point 1 down to the x-axis marking "ESV" and "EDV" respectively. Clean textbook medical diagram style, black and white line-art with light color accents, clearly labeled axes and arrows showing the clockwise direction of the loop, suitable for printing as a study reference.
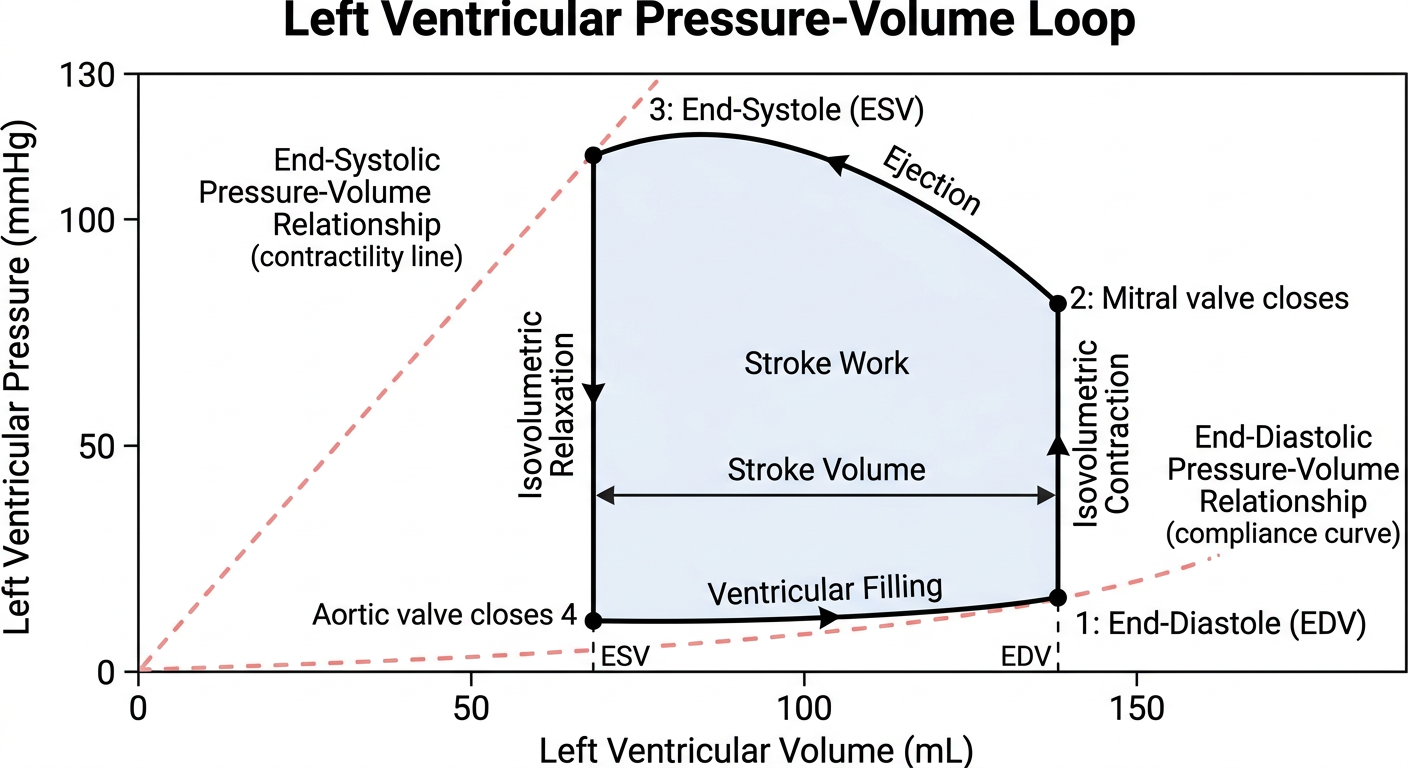
- Point 1 (end-diastole, ~140 mL, low pressure ~5 mmHg) -> isovolumetric contraction (vertical line up, volume constant, all valves closed) -> Point 2 (mitral valve closes, pressure rises to the point aortic valve is about to open)
- Point 2 -> 3: ejection phase (aortic valve open, volume falls as blood is ejected, pressure rises to its peak then starts to fall) -> Point 3 = end-systole, ~70 mL (this point touches the end-systolic pressure-volume relationship line - this line's slope defines contractility)
- Point 3 -> 4: isovolumetric relaxation (vertical line down, volume constant, aortic valve closes at point 3-4 transition)
- Point 4 -> 1: ventricular filling (mitral valve opens, volume rises back up to EDV along the compliance/end-diastolic pressure-volume curve)
- Width of the loop (horizontal distance between ESV and EDV) = Stroke Volume
- Area enclosed by the loop = Stroke Work (external mechanical work done by the ventricle in one beat)
- End-systolic pressure-volume relationship (ESPVR) - the dashed line touching point 3 - its slope represents contractility; a steeper line = higher contractility (shifts point 3 up and left, widening the loop and increasing stroke volume for the same EDV)
- End-diastolic pressure-volume relationship (EDPVR) - the dashed curve touching points 1 and 4 - represents ventricular compliance; a stiffer (less compliant) ventricle shifts this curve upward, raising filling pressure for the same EDV
- Increased preload (more venous return): loop shifts right, wider base, same ESPVR slope, larger stroke volume (Frank-Starling)
- Increased afterload (e.g., hypertension): point 2-3 segment shifts to a higher pressure, ejection stops earlier (higher ESV), loop narrows, stroke volume falls
- Increased contractility (e.g., catecholamines, digoxin): ESPVR slope steepens, point 3 moves left, loop widens, stroke volume and ejection fraction increase
- Decreased contractility (e.g., heart failure): ESPVR slope flattens, point 3 moves right, loop narrows, stroke volume falls
Continue with ECG - the electrical basis of the cardiac cycle
ELECTROCARDIOGRAM (ECG) - Electrical Basis of the Cardiac Cycle
1. Definition and Basic Principle
Depolarization waves vs Repolarization waves (core concept - always tested)
- During depolarization, the resting negative potential inside a fiber reverses to positive inside/negative outside
- As a wave of depolarization spreads along a fiber, one electrode sees an area of negativity while the other sees positivity, generating a net recorded potential
- Once the entire fiber is depolarized, both electrodes are equally negative again -> potential returns to zero (a complete "depolarization wave")
- During repolarization, the process reverses, producing a wave of opposite polarity to the depolarization wave (in ventricular muscle)
- P wave and QRS complex = depolarization waves (atrial and ventricular respectively); T wave = repolarization wave of the ventricles
2. Waveforms of the Normal ECG
| Wave/Complex | Represents | Normal duration |
|---|---|---|
| P wave | Atrial depolarization (spreads from SA node outward) | < 0.12 sec (120 msec) |
| PR interval | Time from onset of atrial depolarization to onset of ventricular depolarization (includes AV nodal delay) | 0.12-0.20 sec |
| QRS complex | Ventricular depolarization | 0.075-0.10 sec (up to 0.11 sec) |
| ST segment | Period between depolarization and start of repolarization of ventricles (isoelectric - whole ventricle depolarized) | - |
| T wave | Ventricular repolarization | occurs 0.25-0.35 sec after depolarization |
| QT interval | Total duration of ventricular depolarization + repolarization | Varies with heart rate; corrected as QTc |
| U wave (occasionally seen) | Slow repolarization of papillary muscles / Purkinje fibers | small, inconstant |
Genesis of the P wave (mechanism - write this in detail for marks)
- Depolarization begins at the SA node (near the SVC opening) and spreads in all directions through the atria
- Because this spread of the depolarization vector is generally aligned with the positive axes of leads I, II, III, the P wave is normally upright (positive) in these standard leads
QRS Complex - conventions
- Capital letters (Q, R, S) = large deflections (>=5mm/0.5mV); lowercase (q, r, s) = smaller deflections
- Q/q wave = first negative deflection; R/r wave = positive deflection; S/s wave = negative deflection following an R wave
- Pathological Q waves can indicate prior myocardial infarction - a clinically important correlate to mention
QT interval and correction
- QT reflects both depolarization (QRS) and repolarization (T) of the ventricles together
- Must be rate-corrected because QT shortens as heart rate increases
- Bazett's formula: QTc = QT / sqrt(RR interval)
- Prolonged QTc is clinically significant (risk of Torsades de Pointes) - worth one line for completeness
3. ECG Leads
A. Standard Bipolar Limb Leads (Einthoven's Leads)
- Lead I: Right arm (-) to Left arm (+) - records positive when RA is negative relative to LA
- Lead II: Right arm (-) to Left leg (+) - records positive when RA is negative relative to LL (most commonly used for rhythm monitoring)
- Lead III: Left arm (-) to Left leg (+) - records positive when LA is negative relative to LL
Einthoven's Triangle and Einthoven's Law
- Lead I = LA - RA = 0.3 - (-0.2) = +0.5 mV
- Lead III = LL - LA = 1.0 - 0.3 = +0.7 mV
- Lead II = RA to LL = 1.0 - (-0.2) = +1.2 mV, which indeed equals Lead I + Lead III (0.5 + 0.7 = 1.2) - confirming Einthoven's Law
B. Augmented Unipolar Limb Leads (mention briefly)
- aVR, aVL, aVF - record the potential at one limb relative to the average of the other two, "augmented" electronically to increase amplitude
C. Chest (Precordial) Leads
- V1-V6 - unipolar leads placed at specific points across the chest wall, giving views of the heart's electrical activity in the horizontal plane (useful for localizing anterior/lateral/septal events)
4. Vector Concept (brief, for higher-level understanding)
- At any instant, the electrical activity of the heart can be represented as a single resultant dipole vector (magnitude + direction) called the mean electrical axis
- As depolarization spreads through the heart, this vector continuously changes in magnitude and direction - plotting its tip over time generates the vectorcardiogram
- The normal mean QRS electrical axis lies between -30 degrees and +90 degrees (roughly the direction of lead II) - this is why the QRS is usually most positive/tallest in lead II
5. Summary Diagram to Draw
How to structure this LAQ for full marks
- Definition + basic principle of depolarization vs repolarization waves (2-3 marks)
- Waveforms: P, QRS, T with genesis and normal durations, table format (4-5 marks)
- Intervals: PR, QRS duration, QT/QTc with normal values (2-3 marks)
- Leads: bipolar limb leads, Einthoven's triangle and law with worked example, brief mention of augmented and chest leads (5-6 marks)
- Brief note on electrical axis/vector concept and one clinical correlate (Q waves in MI, prolonged QTc) (2 marks)
Do Coronary Circulation next
CORONARY CIRCULATION
1. Introduction and Importance
2. Physiological Anatomy of the Coronary Blood Supply
- The main coronary arteries lie on the surface (epicardial) of the heart; smaller branches penetrate inward through the muscle mass to supply nutrition. Only the innermost ~0.1 mm of endocardium gets direct nutrition from blood in the chambers - negligible.
- Left coronary artery (LCA): supplies mainly the anterior and left lateral portions of the left ventricle
- Right coronary artery (RCA): supplies most of the right ventricle, and (in 80-90% of people) the posterior part of the left ventricle too
- Venous drainage: ~75% of LV coronary venous blood returns via the coronary sinus into the right atrium; most RV venous blood drains via small anterior cardiac veins directly into the right atrium; a small amount returns via minute thebesian veins that empty directly into all chambers
- Epicardial coronary arteries (surface) -> intramuscular arteries (penetrating) -> subendocardial arterial plexus (innermost, just beneath endocardium)
3. Normal Coronary Blood Flow
- Resting coronary blood flow = ~70 mL/min/100g of heart weight = ~225 mL/min, about 4-5% of total cardiac output
- During strenuous exercise: cardiac output can increase 4-7 fold and cardiac work 6-9 fold, but coronary blood flow increases only 3-4 fold - meaning the heart becomes more efficient in energy utilization to compensate for this relative shortfall (an exam favorite point)
4. Phasic Changes in Coronary Blood Flow (systole vs diastole) - high-yield, unique feature of coronary circulation
- During systole: the contracting ventricular muscle mechanically compresses the intramuscular coronary vessels, especially in the subendocardial region (highest compressive force), causing blood flow to fall to a low value or even reverse briefly
- During diastole: the muscle relaxes, no longer obstructs the vessels, and blood flows rapidly throughout diastole
- This effect is much more pronounced in the left ventricle (high contractile force) than the right ventricle (weaker contraction, so only partial inverse phasic change)
- Clinical significance: because the subendocardium is compressed most and perfused mainly during diastole, it is the region most vulnerable to ischemia, especially when diastole is shortened (tachycardia) or when diastolic aortic pressure is low (e.g., aortic regurgitation, severe hypotension) - this is why the subendocardium is the first area to suffer in myocardial ischemia
5. Regulation of Coronary Blood Flow
A. Local Metabolic Regulation (dominant mechanism - "Local muscle metabolism is the primary controller")
- Increased cardiac work/contractility -> increased O2 consumption -> local tissue hypoxia and fall in local PO2
- This local hypoxia (and accumulation of vasodilator metabolites) causes vasodilation of coronary arterioles, increasing flow to match demand - called active hyperemia
- Normally about 70% of the O2 in coronary arterial blood is extracted by the myocardium (compared to ~25% extraction elsewhere in the body) - the heart already works close to its ceiling of O2 extraction at rest, so any extra demand must be met almost entirely by increased flow, not increased extraction. This is a crucial concept for explaining why coronary flow reserve matters clinically.
B. Adenosine Hypothesis (the leading proposed mediator)
- When coronary blood flow is inadequate, myocardial PO2 decreases
- ATP in myocardial cells breaks down partially to adenosine
- Adenosine diffuses out and causes marked vasodilation of coronary arterioles, restoring flow toward normal
- Once flow is restored, excess adenosine is washed away/metabolized, and vasodilation subsides - this is a classic local metabolic feedback loop
- Other vasodilator metabolites implicated: CO2, lactate, H+, K+, prostaglandins
C. Reactive Hyperemia
- The systolic compression of coronary vessels transiently reduces flow and creates a brief "oxygen debt"
- Once systole ends, flow increases above baseline for a short period (reactive hyperemia) to repay this debt and restore tissue oxygenation
D. Autoregulation
- Coronary blood flow remains relatively constant across a range of perfusion (arterial) pressures (roughly 60-180 mmHg) due to intrinsic myogenic and metabolic mechanisms - ensures stable myocardial perfusion despite fluctuations in aortic pressure
E. Nervous Control (secondary/minor role compared to metabolic control)
- Sympathetic stimulation: has both direct and indirect effects
- Direct effect on coronary vessels (alpha receptors) -> mild vasoconstriction
- But sympathetic stimulation also increases heart rate and contractility -> increases metabolic demand -> local metabolic vasodilation, which usually overrides the direct vasoconstrictor effect, producing a net increase in coronary flow
- Parasympathetic (vagal) stimulation: mild direct vasodilator effect, but by slowing heart rate and reducing contractility, it decreases metabolic demand and therefore indirectly decreases flow
- Net conclusion (important line to write): the indirect metabolic effects of autonomic stimulation on coronary vessels are generally more powerful than the direct nervous effects
F. Endothelial Factors
- Nitric oxide (NO), released by coronary endothelium, contributes to vasodilator tone
- Endothelin, released by damaged endothelium, is a potent vasoconstrictor implicated in coronary vasospasm
6. Coronary Reserve
- Coronary flow reserve = the capacity of the coronary circulation to increase flow above resting levels in response to increased demand (e.g., exercise) or pharmacological vasodilation
- In a normal coronary artery, flow can increase 4-5 fold above resting values
- In coronary artery disease (fixed atherosclerotic stenosis), the resting flow may be maintained (via distal arteriolar vasodilation) but the reserve capacity is used up, so flow cannot increase adequately during exertion -> angina on exertion is the clinical correlate of exhausted coronary reserve
7. Collateral Circulation (brief mention)
- Small anastomotic channels between branches of coronary arteries can enlarge over time (chronic ischemia) to provide alternate routes of blood flow, partially compensating for a gradually occluding artery - much less effective against sudden/acute occlusion
Summary structure for full LAQ marks
- Anatomy: LCA/RCA distribution, venous drainage, epicardial/subendocardial layers (3-4 marks)
- Normal values: resting flow, % of cardiac output, response to exercise (2 marks)
- Phasic flow diagram and explanation of systolic compression + subendocardial vulnerability (4-5 marks)
- Regulation: local metabolic control (dominant), adenosine hypothesis, reactive hyperemia, autoregulation, nervous control (secondary, net effect) (6-7 marks)
- Coronary reserve and clinical correlation to angina/ischemia (2 marks)
Do the final topic: Circulatory Shock with full LAQ depth
CIRCULATORY SHOCK
1. Definition
2. Classification / Etiology of Shock
A. Hypovolemic Shock (decreased blood volume -> decreased venous return -> decreased CO)
- Hemorrhage (most common cause) - external or internal blood loss
- Plasma loss - burns, intestinal obstruction (fluid sequestration into gut lumen/wall), peritonitis
- Fluid/electrolyte loss - severe vomiting, diarrhea, excessive sweating
B. Cardiogenic Shock (heart fails to pump adequately despite normal/adequate filling)
- Myocardial infarction (most common cause) - as much as 70% mortality
- Severe arrhythmias, myocarditis, severe valvular dysfunction, cardiac toxins
C. Obstructive Shock (mechanical obstruction to blood flow/filling)
- Cardiac tamponade, massive pulmonary embolism, tension pneumothorax
D. Distributive (Vasodilatory) Shock (normal or increased cardiac output, but severe fall in vascular tone/maldistribution of flow)
- Septic shock - most common cause of distributive shock and, along with cardiogenic shock, one of the most frequent causes of shock-related death in hospitals. Caused by gram-positive bacteria most commonly, followed by endotoxin-producing gram-negative bacteria; also fungal/viral. Sources: peritonitis, GI perforation, gas gangrene, urosepsis, pneumonia.
- Anaphylactic shock - antigen-antibody reaction -> basophils/mast cells release histamine -> (1) venodilation -> decreased venous return, (2) arteriolar dilation -> decreased arterial pressure, (3) increased capillary permeability -> fluid/protein loss into tissues. Can cause death within minutes. (Direct IV histamine produces an almost identical picture - "histamine shock.")
- Neurogenic shock - loss of sympathetic vasomotor tone (e.g., high spinal cord injury, deep general anesthesia, spinal anesthesia) -> widespread vasodilation -> pooling of blood, decreased venous return
3. Special Features of Septic Shock (worth a dedicated few lines - frequently asked)
- High fever (>38C), or hypothermia in rare cases
- Marked vasodilation, especially in infected tissues
- High cardiac output in ~half of patients (tachycardia + peripheral vasodilation + high metabolic rate from bacterial toxins/fever) - contrast this with hypovolemic/cardiogenic shock where CO is typically low - a key differentiating point
- Sludging of blood due to red cell agglutination
- Disseminated intravascular coagulation (DIC) in severe cases
4. Stages of Shock (classical 3-stage description - core of the answer)
Stage 1: Compensated (Non-progressive) Shock
- Mild reduction in cardiac output triggers powerful compensatory reflexes that are sufficient, on their own, to fully restore/maintain circulatory function without external therapy
- Compensatory mechanisms activated:
- Baroreceptor reflex - increased sympathetic outflow -> tachycardia, increased contractility, arteriolar vasoconstriction (sparing brain and heart), venoconstriction (increases venous return) - exactly the same mechanism as in your MAP/baroreceptor topic
- Chemoreceptor reflex - activated as BP falls further, reinforces sympathetic activation
- CNS ischemic response - activated if BP falls very low (<50 mmHg), producing massive sympathetic discharge
- Reabsorption of fluid - from interstitial spaces into capillaries (due to reduced capillary hydrostatic pressure) and reduced glomerular filtration - helps restore blood volume
- Renin-angiotensin-aldosterone activation - angiotensin II vasoconstriction + aldosterone-mediated salt/water retention
- ADH (vasopressin) release - water retention + vasoconstriction
- Stress-relaxation reversal of blood vessels and increased thirst
Stage 2: Progressive (Decompensated) Shock
- Compensatory mechanisms are overwhelmed; shock begins to feed on itself via positive feedback loops, becoming progressively worse. Key vicious cycles to enumerate (high-yield):
- Cardiac depression - falling arterial pressure reduces coronary blood flow -> weakens heart muscle -> further falls cardiac output -> further falls pressure (a self-reinforcing loop)
- Vasomotor center failure - prolonged cerebral ischemia eventually depresses the medullary vasomotor center itself, so sympathetic drive fails (occurs after ~10-15 minutes of severe ischemia)
- Sludged blood / microvascular blockage - sluggish flow -> local acidosis (lactic + carbonic acid accumulation) -> blood cell agglutination -> capillary plugging -> worsens tissue ischemia
- Increased capillary permeability - hypoxic capillary walls leak fluid and protein into tissues, further reducing blood volume
- Release of toxins/lysosomal enzymes from ischemic/damaged cells (e.g., from ischemic gut, liver) worsening vasodilation and cellular damage
- Generalized cellular deterioration - failure of cellular ion pumps (Na+/K+ ATPase), mitochondrial depression, lysosomal rupture, acidosis - across all organs including the heart itself
- Depression of the reticuloendothelial system allowing bacteria/toxins from the gut to enter circulation, contributing to septic complications
Stage 3: Irreversible Shock
- Beyond a critical point, no therapy, no matter how vigorous, can save the patient - even if transfusion transiently restores cardiac output and arterial pressure to normal, deterioration continues and death follows within minutes to hours
- Key mechanism: depletion of cellular high-energy phosphate reserves - creatine phosphate is exhausted, ATP degrades progressively to ADP -> AMP -> adenosine, which diffuses out of cells and is irreversibly converted to uric acid (cannot re-enter cells to regenerate the phosphate system). New adenosine synthesis occurs at only ~2% of normal cellular content per hour - meaning cellular energy stores, once depleted this severely, cannot be replenished in time
- Widespread mitochondrial and lysosomal damage, massive acidosis, and diffuse microvascular thrombosis complete the irreversible cascade
5. Summary Table
| Stage | Cardiac Output | Compensation | Reversibility |
|---|---|---|---|
| Compensated | Mildly reduced | Reflexes fully restore perfusion | Fully reversible, may need no treatment |
| Progressive | Falling further | Compensatory mechanisms overwhelmed, positive feedback loops begin | Reversible only with prompt aggressive treatment |
| Irreversible | Severely reduced, may transiently normalize with treatment | Mechanisms exhausted, cellular energy depletion | Death inevitable despite treatment |
6. Clinical Correlation (brief, ties everything together)
- Management principle: treat the underlying cause (fluids for hypovolemic, inotropes/revascularization for cardiogenic, antibiotics + fluids + vasopressors for septic, epinephrine + antihistamines for anaphylactic) as early as possible - ideally during the compensated stage, before the positive feedback loops of progressive shock take hold
- Early recognition matters more than late aggressive treatment, because once irreversible shock sets in, therapy cannot alter the outcome
How to structure this LAQ for full marks
- Definition + the "BP can be misleading" concept (2 marks)
- Classification: hypovolemic, cardiogenic, obstructive, distributive (septic, anaphylactic, neurogenic) with brief mechanism of each (5-6 marks)
- Stages of shock: compensated (list all reflex mechanisms), progressive (list all positive feedback loops), irreversible (energy depletion mechanism) - this is the bulk of the marks (8-10 marks)
- Diagram: cardiac output vs time curves in hemorrhagic shock (2 marks)
- Brief clinical correlation (1-2 marks)
Okay, so now I have eight, eight key topics for the same, uh, this cardiovascular physiology. And, uh, um, again, you have to explain it to me in detail. Mm-hmm. But consider them, like, uh, still a little less in length. Right. And, um, also include diagrams if the answer can have a diagram. Like, when you tell me to draw this or that diagram or graph, so you provide me with that diagram, including in that answer itself. Okay. Incorporate it in that only. So the topics are heart sounds. Uh, second is heart block. Then third is properties of cardiac muscle and why it can't be tetanized. Then, uh, ionic basis of autorhythmicity in SAN. Next is role of JGA in regulation of blood pressure. Next is renin-angiotensin mechanism. Next is angina pectoris. Next is myocardial infarction. Then we have ejection fraction. Then we have stroke volume, define and factors affecting. And lastly, cardiorespiratory changes during exercise. Uh... Yeah, that's it.
- Heart Sounds (S1-S4, mechanism, timing)
- Heart Block (types, ECG correlation)
- Properties of Cardiac Muscle & why it cannot be tetanized (refractory period)
- Ionic Basis of Autorhythmicity in SA Node (pacemaker potential)
- Role of JGA in Regulation of Blood Pressure
- Renin-Angiotensin-Aldosterone Mechanism
- Angina Pectoris
- Myocardial Infarction
- Ejection Fraction
- Stroke Volume - definition + factors affecting
- Cardiorespiratory Changes During Exercise
Which of these 11 topics should we start with?
- Cardiac Cycle - phases (systole/diastole), pressure-volume changes, heart sounds, Wiggers diagram
- Coronary Circulation - anatomy, phasic flow changes, regulation, coronary reserve
- Cardiac Output - definition, normal value, Fick principle, factors regulating (preload, afterload, contractility, heart rate), measurement methods
- Mean Arterial Pressure (MAP) - definition, determinants, and full regulation: baroreceptor reflex (short-term), plus chemoreceptors, CNS ischemic response, renal/hormonal (long-term - RAAS, ANP)
- Blood Pressure - definition, normal values, short-term vs long-term regulation mechanisms
- ECG - genesis, waves (P-QRS-T), intervals, leads, normal values, clinical correlation
- Circulatory Shock - definition, types (hypovolemic, cardiogenic, septic, anaphylactic, neurogenic), stages, compensatory mechanisms, decompensation
MEAN ARTERIAL PRESSURE (MAP) - Definition, Regulation, and Baroreceptor Mechanism
1. Definition
2. Enumeration of Mechanisms Regulating Arterial Pressure
A. Rapidly acting (seconds) - Nervous mechanisms
- Baroreceptor reflex (carotid sinus and aortic arch) - fastest, most important short-term regulator
- Chemoreceptor reflex (carotid and aortic bodies) - responds mainly to hypoxia, also to fall in BP below ~80 mmHg
- CNS ischemic response - activated only when brain blood flow falls severely (BP < 40-50 mmHg); causes massive sympathetic discharge ("last-ditch stand" mechanism)
- Atrial and pulmonary artery reflexes (low pressure receptors/volume receptors) - respond to blood volume changes, trigger reflex tachycardia and affect ADH/renal function
B. Intermediate acting (minutes)
- Renin-Angiotensin-Aldosterone System (RAAS) - angiotensin II causes vasoconstriction (minutes) and later aldosterone-mediated Na+/water retention (hours)
- Stress-relaxation of vasculature - vessels adjust their tone when overstretched or underfilled
- Capillary fluid shift mechanism - fluid moves between plasma and interstitium to correct blood volume
C. Long-term (hours to days) - the most powerful for chronic control
- Renal-body fluid (pressure diuresis/natriuresis) mechanism - Guyton's cornerstone concept: rising arterial pressure increases renal excretion of salt and water, reducing blood volume and bringing pressure back down. This is considered the dominant long-term controller of MAP.
- Antidiuretic hormone (ADH/vasopressin) - water retention, mild vasoconstriction
- Atrial natriuretic peptide (ANP) - released from stretched atria, promotes natriuresis and vasodilation, opposes RAAS
3. The Baroreceptor Mechanism (Baroreceptor Reflex) - Detailed
Definition
A. Receptors (Baroreceptors)
- Type: Spray-type / stretch receptors (mechanoreceptors) - NOT stimulated by pressure itself, but by the stretch/distension of the vessel wall that pressure produces.
- Location:
- Carotid sinus - slight dilatation of the internal carotid artery just above the bifurcation of the common carotid artery
- Aortic arch
- Carotid sinus baroreceptors respond to both rise AND fall in pressure; aortic arch baroreceptors are more sensitive to rises in pressure.
B. Afferent Pathway
- From carotid sinus -> Hering's nerve -> glossopharyngeal nerve (CN IX) -> Nucleus Tractus Solitarius (NTS) in the medulla
- From aortic arch -> vagus nerve (CN X) -> same NTS in medulla
C. Center
- Nucleus Tractus Solitarius (NTS) in the medulla receives and integrates the afferent signal, then connects to:
- Vasomotor/vasoconstrictor center (excitatory, in rostral ventrolateral medulla)
- Cardioinhibitory (vagal) center (nucleus ambiguus/dorsal motor nucleus of vagus)
D. Efferent Pathway
- Sympathetic fibers -> heart (SA node, myocardium) and blood vessels (arterioles, veins)
- Parasympathetic (vagal) fibers -> SA node of the heart
E. Mechanism of Action - Response to a RISE in Arterial Pressure
- Increased arterial pressure -> increased stretch of carotid sinus/aortic arch walls
- Increased firing rate of baroreceptor afferents -> NTS
- NTS response: increases parasympathetic (vagal) outflow to heart AND inhibits sympathetic outflow to heart and vessels
- Effects (all act to bring pressure back DOWN toward normal):
- Decreased heart rate (negative chronotropic, vagal)
- Decreased contractility -> decreased stroke volume -> decreased CO
- Vasodilation of arterioles -> decreased TPR
- Venodilation -> decreased venous return
F. Response to a FALL in Arterial Pressure (e.g., hemorrhage) - reverse pattern
| Parameter | Response to fall in MAP |
|---|---|
| Heart rate | Increased |
| Contractility | Increased |
| Total Peripheral Resistance | Increased (arteriolar constriction, sparing brain & heart) |
| Venous tone (unstressed volume) | Decreased -> increased venous return, increased stressed volume |
| Net effect | Cardiac output and TPR both rise -> MAP restored toward normal |
G. Response Characteristics (important for LAQ marks)
- Operating range: Carotid sinus baroreceptors are silent below ~50-60 mmHg, respond progressively up to about 180 mmHg
- Maximal sensitivity is at the normal operating point around 100 mmHg - i.e., the reflex is most sensitive exactly where it is needed most (a small change in pressure around normal produces a large change in reflex signal)
- Rate sensitivity: Baroreceptors respond more strongly to a rapidly changing pressure than to a sustained/stationary pressure at the same value
- Adaptation/Resetting: Baroreceptors adapt within 1-2 days to a sustained change in pressure (e.g., in chronic hypertension, the set-point resets to the new higher pressure). This is why the baroreceptor reflex is considered important only for short-term, not long-term, BP control - a key point examiners specifically test.
H. Physiological Significance
- Buffers transient changes in BP during postural change (e.g., standing up), exercise, and Valsalva maneuver
- Central compensatory mechanism in hemorrhage and shock (this links directly to your Circulatory Shock topic - same reflex, different context)
- Clinically relevant in carotid sinus massage/hypersensitivity, carotid sinus syncope, and baroreceptor stimulation devices used in resistant hypertension
How to structure this for full LAQ marks
- Define MAP + formula + normal value (2 marks)
- Enumerate all regulatory mechanisms, short vs long term (2-3 marks)
- Detailed baroreceptor mechanism: receptors -> afferents -> center -> efferents -> effects, with labeled diagram (6-8 marks - this is where most marks are)
- Special properties: operating range, rate sensitivity, resetting (2 marks)
- One line on clinical/physiological significance (1 mark)
1. Definition
2. The Seven Phases of the Cardiac Cycle (correlate with Wiggers diagram)
Phase A: Atrial Systole
- Triggered by the P wave (atrial depolarization) + PR interval
- Left atrium contracts, atrial pressure rises slightly, pushes final ~20-30% of blood into the already-filling ventricle (atrial kick)
- Mitral valve is open; aortic valve closed
- Produces the a wave of the venous/atrial pressure pulse
- S4 (fourth heart sound) may coincide here - not normally audible in healthy adults, heard in reduced ventricular compliance (e.g., ventricular hypertrophy)
Phase B: Isovolumetric Ventricular Contraction
- Begins with the QRS complex (ventricular depolarization)
- Ventricular pressure rises steeply, exceeds atrial pressure -> mitral valve closes
- Ventricular pressure is still less than aortic pressure, so the aortic valve remains closed too
- All 4 valves closed -> volume is constant while pressure rises rapidly (hence "isovolumetric" / isovolumic)
- Mitral valve closure produces the first heart sound (S1) - "lub"
Phase C: Rapid Ventricular Ejection
- ST segment on ECG
- Ventricular pressure exceeds aortic pressure -> aortic valve opens
- Blood ejected rapidly into the aorta; ventricular volume falls sharply
- Both ventricular and aortic pressures rise together and reach their peak/maximum in this phase
- No heart sound normally audible here (silent phase)
Phase D: Reduced Ventricular Ejection
- Coincides with the T wave (ventricular repolarization)
- Ejection continues but at a slower rate
- Ventricular volume reaches its minimum (= end-systolic volume, ~50 mL)
- Aortic pressure begins to fall as blood runs off into the peripheral arterial tree faster than it's being added
- Ventricular pressure actually falls slightly below aortic pressure toward the end, but forward momentum keeps blood flowing briefly
Phase E: Isovolumetric Ventricular Relaxation
- Ventricle relaxes, pressure falls rapidly
- Once ventricular pressure drops below aortic pressure -> aortic valve closes
- This closure produces the second heart sound (S2) - "dub" - and produces the characteristic small notch on the aortic pressure curve called the incisura (dicrotic notch)
- Mitral valve still closed (LV pressure still above LA pressure momentarily) -> again all 4 valves closed, volume constant while pressure falls steeply
Phase F: Rapid Ventricular Filling
- Ventricular pressure falls below atrial pressure -> mitral valve opens
- Blood that has been accumulating in the atria (venous return) rushes rapidly into the relaxed ventricle
- Ventricular volume rises quickly; pressure stays low
- May produce a third heart sound (S3) in this phase if audible - physiological in children/young adults, pathological (suggests volume overload/heart failure) in older adults
Phase G: Reduced Ventricular Filling (Diastasis)
- The longest but "quietest" phase - passive filling slows down as ventricular and atrial pressures equalize
- Ventricle continues to fill slowly until the next P wave initiates atrial systole again, closing the loop
3. Summary Table (write this - high yield for marks)
| Phase | Ventricular volume | Valves | ECG event | Heart sound |
|---|---|---|---|---|
| Atrial systole | Slight increase | Mitral open, Aortic closed | P wave | S4 (if present) |
| Isovolumetric contraction | Constant | All closed | QRS | S1 |
| Rapid ejection | Decreases sharply | Aortic open | ST segment | - |
| Reduced ejection | Decreases (to minimum) | Aortic open | T wave | - |
| Isovolumetric relaxation | Constant | All closed | - | S2 |
| Rapid filling | Increases sharply | Mitral open | - | S3 (if present) |
| Diastasis | Increases slowly | Mitral open | - | - |
4. Pressure and Volume Values to Quote
- Left ventricular pressure: rises from ~0-8 mmHg (diastole) to ~120 mmHg (peak systole)
- Aortic pressure: oscillates between ~80 mmHg (diastolic) and ~120 mmHg (systolic)
- Left atrial pressure: low throughout, ~2-10 mmHg, with three small waves: a wave (atrial contraction), c wave (bulging of AV valve into atrium during isovolumic contraction/early ventricular contraction), and v wave (atrial filling against closed mitral valve)
- End-diastolic volume (EDV): ~110-120 mL
- End-systolic volume (ESV): ~50 mL
- Stroke volume (EDV - ESV): ~70 mL
- Ejection fraction (SV/EDV): ~60-65% normally - this links directly into your Cardiac Output topic
5. Heart Sounds (mechanism - a common sub-question)
- S1 ("lub"): closure of mitral and tricuspid (AV) valves at start of systole; caused by vibration of the tensed valve leaflets and chordae tendineae when back-surging blood abruptly stops them; duration ~0.14 sec, lower pitch (AV valves less taut)
- S2 ("dub"): closure of aortic and pulmonary (semilunar) valves at end of systole; vibration of taut semilunar valves and elastic recoil of arterial walls; duration ~0.11 sec, higher pitch (semilunar valves are tauter)
- S3: rapid ventricular filling phase - physiological in youth, pathological if loud in adults (volume overload, heart failure, dilated ventricle)
- S4: atrial contraction against a stiff, non-compliant ventricle - always pathological in adults (hypertrophy, ischemia, hypertension)
6. Right Heart vs Left Heart (mention briefly)
- Develops much lower peak systolic pressure (~25 mmHg vs 120 mmHg)
- Isovolumetric contraction/relaxation periods are shorter
- Pulmonary valve opens slightly before and closes slightly after the aortic valve
How to score full marks on this LAQ
- Definition + duration of cycle, systole vs diastole (2 marks)
- Well-labeled Wiggers diagram with all 5 tracings (6-8 marks - this is the single biggest scoring element)
- Phase-by-phase description with valve status and pressure-volume correlation (6-8 marks)
- Heart sounds mechanism correlated to phases (3-4 marks)
- Normal values: EDV, ESV, SV, EF, pressures (2 marks)
- ECG (P, QRS, T waves)
- Aortic pressure with the dicrotic notch
- LV pressure with mitral/aortic valve open-close points marked
- LA pressure with a, c, v waves
- LV volume with end-diastolic and end-systolic volumes marked
- Heart sounds (S1-S4) at their correct time points
THE CARDIAC CYCLE
1. Definition
Wiggers Diagram (draw this - it's the highest-scoring element of this LAQ)
2. The Seven Phases of the Cardiac Cycle (correlate with the diagram above)
Phase A: Atrial Systole
- Triggered by the P wave (atrial depolarization) + PR interval
- Left atrium contracts, atrial pressure rises slightly, pushes final ~20-30% of blood into the already-filling ventricle (atrial kick)
- Mitral valve open; aortic valve closed
- Produces the a wave of the atrial/venous pressure pulse
- S4 may coincide here - not normally audible in healthy adults, heard in reduced ventricular compliance (e.g., ventricular hypertrophy)
Phase B: Isovolumetric Ventricular Contraction
- Begins with the QRS complex (ventricular depolarization)
- Ventricular pressure rises steeply, exceeds atrial pressure -> mitral valve closes
- Ventricular pressure still less than aortic pressure, so aortic valve remains closed too
- All 4 valves closed -> volume constant while pressure rises rapidly ("isovolumetric")
- Mitral valve closure produces the first heart sound (S1) - "lub"
Phase C: Rapid Ventricular Ejection
- ST segment on ECG
- Ventricular pressure exceeds aortic pressure -> aortic valve opens
- Blood ejected rapidly into the aorta; ventricular volume falls sharply
- Both ventricular and aortic pressures rise together and reach their peak/maximum here
- No heart sound normally audible in this phase
Phase D: Reduced Ventricular Ejection
- Coincides with the T wave (ventricular repolarization)
- Ejection continues but at a slower rate
- Ventricular volume reaches its minimum (= end-systolic volume, ~50 mL)
- Aortic pressure begins to fall as blood runs off into the peripheral arteries faster than it's being added
Phase E: Isovolumetric Ventricular Relaxation
- Ventricle relaxes, pressure falls rapidly
- Once ventricular pressure drops below aortic pressure -> aortic valve closes
- Produces the second heart sound (S2) - "dub" - and the dicrotic notch (incisura) on the aortic pressure curve
- Mitral valve still closed -> all 4 valves closed again, volume constant while pressure falls steeply
Phase F: Rapid Ventricular Filling
- Ventricular pressure falls below atrial pressure -> mitral valve opens
- Blood pooled in the atria rushes rapidly into the relaxed ventricle
- Ventricular volume rises quickly; pressure stays low
- May produce a third heart sound (S3) - physiological in children/young adults, pathological (volume overload/heart failure) in older adults
Phase G: Reduced Ventricular Filling (Diastasis)
- Longest but "quietest" phase - passive filling slows as ventricular and atrial pressures equalize
- Ventricle fills slowly until the next P wave restarts the cycle
3. Summary Table
| Phase | Ventricular volume | Valves | ECG event | Heart sound |
|---|---|---|---|---|
| Atrial systole | Slight increase | Mitral open, Aortic closed | P wave | S4 (if present) |
| Isovolumetric contraction | Constant | All closed | QRS | S1 |
| Rapid ejection | Decreases sharply | Aortic open | ST segment | - |
| Reduced ejection | Decreases (to minimum) | Aortic open | T wave | - |
| Isovolumetric relaxation | Constant | All closed | - | S2 |
| Rapid filling | Increases sharply | Mitral open | - | S3 (if present) |
| Diastasis | Increases slowly | Mitral open | - | - |
4. Pressure and Volume Values to Quote
- Left ventricular pressure: rises from ~0-8 mmHg (diastole) to ~120 mmHg (peak systole)
- Aortic pressure: oscillates between ~80 mmHg (diastolic) and ~120 mmHg (systolic)
- Left atrial pressure: low throughout, ~2-10 mmHg, with a, c, v waves (a = atrial contraction; c = AV valve bulging into atrium during isovolumic contraction; v = atrial filling against closed mitral valve)
- End-diastolic volume (EDV): ~110-120 mL
- End-systolic volume (ESV): ~50 mL
- Stroke volume (EDV - ESV): ~70 mL
- Ejection fraction (SV/EDV): ~60-65% (links directly to Cardiac Output)
5. Heart Sounds (mechanism)
- S1 ("lub"): closure of mitral and tricuspid valves at start of systole; vibration of tensed valve leaflets/chordae tendineae as back-surging blood abruptly stops them; duration ~0.14 sec, lower pitch
- S2 ("dub"): closure of aortic and pulmonary valves at end of systole; vibration of taut semilunar valves and elastic recoil of arterial walls; duration ~0.11 sec, higher pitch
- S3: rapid ventricular filling phase - physiological in youth, pathological if loud in adults
- S4: atrial contraction against a stiff, non-compliant ventricle - always pathological in adults
6. Right Heart vs Left Heart (brief mention)
How to score full marks on this LAQ
- Definition + duration of cycle, systole vs diastole (2 marks)
- Well-labeled Wiggers diagram, all 6 tracings (6-8 marks - biggest scoring element)
- Phase-by-phase description with valve status and pressure-volume correlation (6-8 marks)
- Heart sounds mechanism correlated to phases (3-4 marks)
- Normal values: EDV, ESV, SV, EF, pressures (2 marks)
1. Definition
- Stroke volume (SV) = ~70 mL/beat
- Heart rate (HR) = ~72 beats/min
- Stroke Volume = EDV - ESV = 140 - 70 = 70 mL
- Cardiac Output = SV x HR = 70 x 75 = 5250 mL/min
- Ejection Fraction = SV/EDV = 70/140 = 0.50 (50%)
2. Measurement of Cardiac Output
A. Fick Principle (Oxygen Fick Method) - most important, always asked
- Measure O2 consumption (VO2) - collect and analyze expired air over a timed interval
- Measure O2 content of arterial blood (peripheral artery puncture)
- Measure O2 content of mixed venous blood (pulmonary artery catheter - because right heart blood is not yet mixed with atrial/systemic differences until it reaches the pulmonary artery)
- Apply the formula
B. Indicator Dilution Method (Dye dilution / Thermodilution)
- A known quantity of indicator (dye, or cold saline in thermodilution) is injected into a vein
- Concentration of the indicator is measured downstream over time as it passes and recirculates
- CO is calculated from the amount injected and the area under the concentration-time curve
- Thermodilution using a Swan-Ganz (pulmonary artery) catheter is the clinically used bedside method today
C. Echocardiography
- Doppler measurement of blood flow velocity across the aortic valve combined with the cross-sectional area of the outflow tract gives stroke volume; multiplied by heart rate gives CO
- Non-invasive, widely used clinically
3. Factors Regulating Cardiac Output
A. Regulation of Heart Rate
- Autonomic nervous system: Sympathetic stimulation (via beta-1 receptors) increases HR (positive chronotropic); parasympathetic/vagal stimulation decreases HR (negative chronotropic) - this is the dominant control at rest (vagal tone predominates)
- Baroreceptor reflex (from your MAP topic) - directly adjusts HR to buffer BP changes
- Bainbridge reflex - stretch of right atrial receptors from increased venous return reflexively increases HR
- Chemical factors: hyperthermia, thyroid hormone, catecholamines increase HR; hypothermia, hyperkalemia can decrease it
- Intrinsic SA node properties: rate of phase 4 depolarization, maximum diastolic potential, threshold potential
B. Regulation of Stroke Volume - three classical determinants (write this as a dedicated sub-heading, high yield)
- Mechanism: increased venous return -> increased EDV -> increased stretch of myocardial fibers -> increased force of contraction (length-tension relationship of cardiac muscle, related to optimal actin-myosin overlap) -> increased stroke volume
- This intrinsic mechanism ensures that in the steady state, cardiac output = venous return - whatever comes into the heart is pumped back out, without requiring nervous control
- Factors increasing preload: increased blood volume, venoconstriction (sympathetic), skeletal muscle pump, respiratory pump, increased atrial contractility
- Afterload = the pressure/tension the ventricle must generate to eject blood = approximated clinically by aortic pressure / total peripheral resistance (for LV) and pulmonary artery pressure (for RV)
- Increased afterload (e.g., hypertension, aortic stenosis) -> for a given preload and contractility, stroke volume decreases because more of the contractile energy is used generating pressure rather than shortening/ejecting
- This is best demonstrated on the ventricular pressure-volume loop - increased afterload shifts the loop to a higher end-systolic pressure with reduced stroke volume width
- Contractility = the intrinsic strength of ventricular contraction at any given preload
- Positive inotropic agents (sympathetic stimulation/catecholamines, digoxin, increased Ca2+) shift the Frank-Starling curve upward and to the left - more stroke volume/CO for the same EDV, higher ejection fraction
- Negative inotropic agents (parasympathetic stimulation, myocardial ischemia/infarction, heart failure, many anesthetic/antiarrhythmic drugs, acidosis, hypoxia) shift the curve downward and to the right
- Mechanism: contractility changes reflect altered intracellular Ca2+ availability to the contractile machinery (independent of fiber length)
C. Ventricular Pressure-Volume Loop (excellent diagram for extra marks)
- Point 1 (end-diastole, ~140 mL, low pressure) -> isovolumetric contraction (vertical line up) -> Point 2 (mitral valve closes, aortic valve about to open)
- Point 2 -> 3: ejection phase (volume falls as aortic valve is open, pressure rises then falls slightly) -> Point 3 = end-systole (touches the systolic/maximal pressure-volume curve - this defines contractility)
- Point 3 -> 4: isovolumetric relaxation (vertical line down, aortic valve closes)
- Point 4 -> 1: ventricular filling (mitral valve open, volume rises back to EDV)
- Width of the loop = Stroke Volume
- Area of the loop = Stroke Work (external work done by the ventricle per beat)
- Increased contractility -> loop's upper-left corner (point 3) shifts left, and the whole loop widens (bigger SV) for the same EDV
- Increased afterload -> point 2-3 line shifts up, SV narrows
4. Other Physiological Factors Affecting Cardiac Output
- Venous return - determined by blood volume, venous tone, skeletal muscle pump, respiratory pump, gravity/posture
- Exercise - increases CO markedly (up to 25 L/min in trained athletes) via increased HR, contractility, and venous return
- Body size, metabolic rate, age, posture, pregnancy - all physiologically alter baseline CO
Summary structure for full LAQ marks
- Definition + formula + normal value + cardiac index (2 marks)
- Measurement: Fick principle with worked example, mention dye dilution/thermodilution/echo (4-5 marks)
- Regulation: heart rate control + stroke volume control (preload/Frank-Starling, afterload, contractility) with diagram (6-8 marks)
- Pressure-volume loop diagram and explanation (3-4 marks)
- Brief note on venous return/exercise physiology (1-2 marks)
- Point 1 (end-diastole, ~140 mL, low pressure ~5 mmHg) -> isovolumetric contraction (vertical line up, volume constant, all valves closed) -> Point 2 (mitral valve closes, pressure rises to the point aortic valve is about to open)
- Point 2 -> 3: ejection phase (aortic valve open, volume falls as blood is ejected, pressure rises to its peak then starts to fall) -> Point 3 = end-systole, ~70 mL (this point touches the end-systolic pressure-volume relationship line - this line's slope defines contractility)
- Point 3 -> 4: isovolumetric relaxation (vertical line down, volume constant, aortic valve closes at point 3-4 transition)
- Point 4 -> 1: ventricular filling (mitral valve opens, volume rises back up to EDV along the compliance/end-diastolic pressure-volume curve)
- Width of the loop (horizontal distance between ESV and EDV) = Stroke Volume
- Area enclosed by the loop = Stroke Work (external mechanical work done by the ventricle in one beat)
- End-systolic pressure-volume relationship (ESPVR) - the dashed line touching point 3 - its slope represents contractility; a steeper line = higher contractility (shifts point 3 up and left, widening the loop and increasing stroke volume for the same EDV)
- End-diastolic pressure-volume relationship (EDPVR) - the dashed curve touching points 1 and 4 - represents ventricular compliance; a stiffer (less compliant) ventricle shifts this curve upward, raising filling pressure for the same EDV
- Increased preload (more venous return): loop shifts right, wider base, same ESPVR slope, larger stroke volume (Frank-Starling)
- Increased afterload (e.g., hypertension): point 2-3 segment shifts to a higher pressure, ejection stops earlier (higher ESV), loop narrows, stroke volume falls
- Increased contractility (e.g., catecholamines, digoxin): ESPVR slope steepens, point 3 moves left, loop widens, stroke volume and ejection fraction increase
- Decreased contractility (e.g., heart failure): ESPVR slope flattens, point 3 moves right, loop narrows, stroke volume falls
1. Definition and Basic Principle
Depolarization waves vs Repolarization waves (core concept - always tested)
- During depolarization, the resting negative potential inside a fiber reverses to positive inside/negative outside
- As a wave of depolarization spreads along a fiber, one electrode sees an area of negativity while the other sees positivity, generating a net recorded potential
- Once the entire fiber is depolarized, both electrodes are equally negative again -> potential returns to zero (a complete "depolarization wave")
- During repolarization, the process reverses, producing a wave of opposite polarity to the depolarization wave (in ventricular muscle)
- P wave and QRS complex = depolarization waves (atrial and ventricular respectively); T wave = repolarization wave of the ventricles
2. Waveforms of the Normal ECG
| Wave/Complex | Represents | Normal duration |
|---|---|---|
| P wave | Atrial depolarization (spreads from SA node outward) | < 0.12 sec (120 msec) |
| PR interval | Time from onset of atrial depolarization to onset of ventricular depolarization (includes AV nodal delay) | 0.12-0.20 sec |
| QRS complex | Ventricular depolarization | 0.075-0.10 sec (up to 0.11 sec) |
| ST segment | Period between depolarization and start of repolarization of ventricles (isoelectric - whole ventricle depolarized) | - |
| T wave | Ventricular repolarization | occurs 0.25-0.35 sec after depolarization |
| QT interval | Total duration of ventricular depolarization + repolarization | Varies with heart rate; corrected as QTc |
| U wave (occasionally seen) | Slow repolarization of papillary muscles / Purkinje fibers | small, inconstant |
Genesis of the P wave (mechanism - write this in detail for marks)
- Depolarization begins at the SA node (near the SVC opening) and spreads in all directions through the atria
- Because this spread of the depolarization vector is generally aligned with the positive axes of leads I, II, III, the P wave is normally upright (positive) in these standard leads
QRS Complex - conventions
- Capital letters (Q, R, S) = large deflections (>=5mm/0.5mV); lowercase (q, r, s) = smaller deflections
- Q/q wave = first negative deflection; R/r wave = positive deflection; S/s wave = negative deflection following an R wave
- Pathological Q waves can indicate prior myocardial infarction - a clinically important correlate to mention
QT interval and correction
- QT reflects both depolarization (QRS) and repolarization (T) of the ventricles together
- Must be rate-corrected because QT shortens as heart rate increases
- Bazett's formula: QTc = QT / sqrt(RR interval)
- Prolonged QTc is clinically significant (risk of Torsades de Pointes) - worth one line for completeness
3. ECG Leads
A. Standard Bipolar Limb Leads (Einthoven's Leads)
- Lead I: Right arm (-) to Left arm (+) - records positive when RA is negative relative to LA
- Lead II: Right arm (-) to Left leg (+) - records positive when RA is negative relative to LL (most commonly used for rhythm monitoring)
- Lead III: Left arm (-) to Left leg (+) - records positive when LA is negative relative to LL
Einthoven's Triangle and Einthoven's Law
- Lead I = LA - RA = 0.3 - (-0.2) = +0.5 mV
- Lead III = LL - LA = 1.0 - 0.3 = +0.7 mV
- Lead II = RA to LL = 1.0 - (-0.2) = +1.2 mV, which indeed equals Lead I + Lead III (0.5 + 0.7 = 1.2) - confirming Einthoven's Law
B. Augmented Unipolar Limb Leads (mention briefly)
- aVR, aVL, aVF - record the potential at one limb relative to the average of the other two, "augmented" electronically to increase amplitude
C. Chest (Precordial) Leads
- V1-V6 - unipolar leads placed at specific points across the chest wall, giving views of the heart's electrical activity in the horizontal plane (useful for localizing anterior/lateral/septal events)
4. Vector Concept (brief, for higher-level understanding)
- At any instant, the electrical activity of the heart can be represented as a single resultant dipole vector (magnitude + direction) called the mean electrical axis
- As depolarization spreads through the heart, this vector continuously changes in magnitude and direction - plotting its tip over time generates the vectorcardiogram
- The normal mean QRS electrical axis lies between -30 degrees and +90 degrees (roughly the direction of lead II) - this is why the QRS is usually most positive/tallest in lead II
5. Summary Diagram to Draw
How to structure this LAQ for full marks
- Definition + basic principle of depolarization vs repolarization waves (2-3 marks)
- Waveforms: P, QRS, T with genesis and normal durations, table format (4-5 marks)
- Intervals: PR, QRS duration, QT/QTc with normal values (2-3 marks)
- Leads: bipolar limb leads, Einthoven's triangle and law with worked example, brief mention of augmented and chest leads (5-6 marks)
- Brief note on electrical axis/vector concept and one clinical correlate (Q waves in MI, prolonged QTc) (2 marks)
1. Introduction and Importance
2. Physiological Anatomy of the Coronary Blood Supply
- The main coronary arteries lie on the surface (epicardial) of the heart; smaller branches penetrate inward through the muscle mass to supply nutrition. Only the innermost ~0.1 mm of endocardium gets direct nutrition from blood in the chambers - negligible.
- Left coronary artery (LCA): supplies mainly the anterior and left lateral portions of the left ventricle
- Right coronary artery (RCA): supplies most of the right ventricle, and (in 80-90% of people) the posterior part of the left ventricle too
- Venous drainage: ~75% of LV coronary venous blood returns via the coronary sinus into the right atrium; most RV venous blood drains via small anterior cardiac veins directly into the right atrium; a small amount returns via minute thebesian veins that empty directly into all chambers
- Epicardial coronary arteries (surface) -> intramuscular arteries (penetrating) -> subendocardial arterial plexus (innermost, just beneath endocardium)
3. Normal Coronary Blood Flow
- Resting coronary blood flow = ~70 mL/min/100g of heart weight = ~225 mL/min, about 4-5% of total cardiac output
- During strenuous exercise: cardiac output can increase 4-7 fold and cardiac work 6-9 fold, but coronary blood flow increases only 3-4 fold - meaning the heart becomes more efficient in energy utilization to compensate for this relative shortfall (an exam favorite point)
4. Phasic Changes in Coronary Blood Flow (systole vs diastole) - high-yield, unique feature of coronary circulation
- During systole: the contracting ventricular muscle mechanically compresses the intramuscular coronary vessels, especially in the subendocardial region (highest compressive force), causing blood flow to fall to a low value or even reverse briefly
- During diastole: the muscle relaxes, no longer obstructs the vessels, and blood flows rapidly throughout diastole
- This effect is much more pronounced in the left ventricle (high contractile force) than the right ventricle (weaker contraction, so only partial inverse phasic change)
- Clinical significance: because the subendocardium is compressed most and perfused mainly during diastole, it is the region most vulnerable to ischemia, especially when diastole is shortened (tachycardia) or when diastolic aortic pressure is low (e.g., aortic regurgitation, severe hypotension) - this is why the subendocardium is the first area to suffer in myocardial ischemia
5. Regulation of Coronary Blood Flow
A. Local Metabolic Regulation (dominant mechanism - "Local muscle metabolism is the primary controller")
- Increased cardiac work/contractility -> increased O2 consumption -> local tissue hypoxia and fall in local PO2
- This local hypoxia (and accumulation of vasodilator metabolites) causes vasodilation of coronary arterioles, increasing flow to match demand - called active hyperemia
- Normally about 70% of the O2 in coronary arterial blood is extracted by the myocardium (compared to ~25% extraction elsewhere in the body) - the heart already works close to its ceiling of O2 extraction at rest, so any extra demand must be met almost entirely by increased flow, not increased extraction. This is a crucial concept for explaining why coronary flow reserve matters clinically.
B. Adenosine Hypothesis (the leading proposed mediator)
- When coronary blood flow is inadequate, myocardial PO2 decreases
- ATP in myocardial cells breaks down partially to adenosine
- Adenosine diffuses out and causes marked vasodilation of coronary arterioles, restoring flow toward normal
- Once flow is restored, excess adenosine is washed away/metabolized, and vasodilation subsides - this is a classic local metabolic feedback loop
- Other vasodilator metabolites implicated: CO2, lactate, H+, K+, prostaglandins
C. Reactive Hyperemia
- The systolic compression of coronary vessels transiently reduces flow and creates a brief "oxygen debt"
- Once systole ends, flow increases above baseline for a short period (reactive hyperemia) to repay this debt and restore tissue oxygenation
D. Autoregulation
- Coronary blood flow remains relatively constant across a range of perfusion (arterial) pressures (roughly 60-180 mmHg) due to intrinsic myogenic and metabolic mechanisms - ensures stable myocardial perfusion despite fluctuations in aortic pressure
E. Nervous Control (secondary/minor role compared to metabolic control)
- Sympathetic stimulation: has both direct and indirect effects
- Direct effect on coronary vessels (alpha receptors) -> mild vasoconstriction
- But sympathetic stimulation also increases heart rate and contractility -> increases metabolic demand -> local metabolic vasodilation, which usually overrides the direct vasoconstrictor effect, producing a net increase in coronary flow
- Parasympathetic (vagal) stimulation: mild direct vasodilator effect, but by slowing heart rate and reducing contractility, it decreases metabolic demand and therefore indirectly decreases flow
- Net conclusion (important line to write): the indirect metabolic effects of autonomic stimulation on coronary vessels are generally more powerful than the direct nervous effects
F. Endothelial Factors
- Nitric oxide (NO), released by coronary endothelium, contributes to vasodilator tone
- Endothelin, released by damaged endothelium, is a potent vasoconstrictor implicated in coronary vasospasm
6. Coronary Reserve
- Coronary flow reserve = the capacity of the coronary circulation to increase flow above resting levels in response to increased demand (e.g., exercise) or pharmacological vasodilation
- In a normal coronary artery, flow can increase 4-5 fold above resting values
- In coronary artery disease (fixed atherosclerotic stenosis), the resting flow may be maintained (via distal arteriolar vasodilation) but the reserve capacity is used up, so flow cannot increase adequately during exertion -> angina on exertion is the clinical correlate of exhausted coronary reserve
7. Collateral Circulation (brief mention)
- Small anastomotic channels between branches of coronary arteries can enlarge over time (chronic ischemia) to provide alternate routes of blood flow, partially compensating for a gradually occluding artery - much less effective against sudden/acute occlusion
Summary structure for full LAQ marks
- Anatomy: LCA/RCA distribution, venous drainage, epicardial/subendocardial layers (3-4 marks)
- Normal values: resting flow, % of cardiac output, response to exercise (2 marks)
- Phasic flow diagram and explanation of systolic compression + subendocardial vulnerability (4-5 marks)
- Regulation: local metabolic control (dominant), adenosine hypothesis, reactive hyperemia, autoregulation, nervous control (secondary, net effect) (6-7 marks)
- Coronary reserve and clinical correlation to angina/ischemia (2 marks)
1. Definition
2. Classification / Etiology of Shock
A. Hypovolemic Shock (decreased blood volume -> decreased venous return -> decreased CO)
- Hemorrhage (most common cause) - external or internal blood loss
- Plasma loss - burns, intestinal obstruction (fluid sequestration into gut lumen/wall), peritonitis
- Fluid/electrolyte loss - severe vomiting, diarrhea, excessive sweating
B. Cardiogenic Shock (heart fails to pump adequately despite normal/adequate filling)
- Myocardial infarction (most common cause) - as much as 70% mortality
- Severe arrhythmias, myocarditis, severe valvular dysfunction, cardiac toxins
C. Obstructive Shock (mechanical obstruction to blood flow/filling)
- Cardiac tamponade, massive pulmonary embolism, tension pneumothorax
D. Distributive (Vasodilatory) Shock (normal or increased cardiac output, but severe fall in vascular tone/maldistribution of flow)
- Septic shock - most common cause of distributive shock and, along with cardiogenic shock, one of the most frequent causes of shock-related death in hospitals. Caused by gram-positive bacteria most commonly, followed by endotoxin-producing gram-negative bacteria; also fungal/viral. Sources: peritonitis, GI perforation, gas gangrene, urosepsis, pneumonia.
- Anaphylactic shock - antigen-antibody reaction -> basophils/mast cells release histamine -> (1) venodilation -> decreased venous return, (2) arteriolar dilation -> decreased arterial pressure, (3) increased capillary permeability -> fluid/protein loss into tissues. Can cause death within minutes. (Direct IV histamine produces an almost identical picture - "histamine shock.")
- Neurogenic shock - loss of sympathetic vasomotor tone (e.g., high spinal cord injury, deep general anesthesia, spinal anesthesia) -> widespread vasodilation -> pooling of blood, decreased venous return
3. Special Features of Septic Shock (worth a dedicated few lines - frequently asked)
- High fever (>38C), or hypothermia in rare cases
- Marked vasodilation, especially in infected tissues
- High cardiac output in ~half of patients (tachycardia + peripheral vasodilation + high metabolic rate from bacterial toxins/fever) - contrast this with hypovolemic/cardiogenic shock where CO is typically low - a key differentiating point
- Sludging of blood due to red cell agglutination
- Disseminated intravascular coagulation (DIC) in severe cases
4. Stages of Shock (classical 3-stage description - core of the answer)
Stage 1: Compensated (Non-progressive) Shock
- Mild reduction in cardiac output triggers powerful compensatory reflexes that are sufficient, on their own, to fully restore/maintain circulatory function without external therapy
- Compensatory mechanisms activated:
- Baroreceptor reflex - increased sympathetic outflow -> tachycardia, increased contractility, arteriolar vasoconstriction (sparing brain and heart), venoconstriction (increases venous return) - exactly the same mechanism as in your MAP/baroreceptor topic
- Chemoreceptor reflex - activated as BP falls further, reinforces sympathetic activation
- CNS ischemic response - activated if BP falls very low (<50 mmHg), producing massive sympathetic discharge
- Reabsorption of fluid - from interstitial spaces into capillaries (due to reduced capillary hydrostatic pressure) and reduced glomerular filtration - helps restore blood volume
- Renin-angiotensin-aldosterone activation - angiotensin II vasoconstriction + aldosterone-mediated salt/water retention
- ADH (vasopressin) release - water retention + vasoconstriction
- Stress-relaxation reversal of blood vessels and increased thirst
Stage 2: Progressive (Decompensated) Shock
- Compensatory mechanisms are overwhelmed; shock begins to feed on itself via positive feedback loops, becoming progressively worse. Key vicious cycles to enumerate (high-yield):
- Cardiac depression - falling arterial pressure reduces coronary blood flow -> weakens heart muscle -> further falls cardiac output -> further falls pressure (a self-reinforcing loop)
- Vasomotor center failure - prolonged cerebral ischemia eventually depresses the medullary vasomotor center itself, so sympathetic drive fails (occurs after ~10-15 minutes of severe ischemia)
- Sludged blood / microvascular blockage - sluggish flow -> local acidosis (lactic + carbonic acid accumulation) -> blood cell agglutination -> capillary plugging -> worsens tissue ischemia
- Increased capillary permeability - hypoxic capillary walls leak fluid and protein into tissues, further reducing blood volume
- Release of toxins/lysosomal enzymes from ischemic/damaged cells (e.g., from ischemic gut, liver) worsening vasodilation and cellular damage
- Generalized cellular deterioration - failure of cellular ion pumps (Na+/K+ ATPase), mitochondrial depression, lysosomal rupture, acidosis - across all organs including the heart itself
- Depression of the reticuloendothelial system allowing bacteria/toxins from the gut to enter circulation, contributing to septic complications
Stage 3: Irreversible Shock
- Beyond a critical point, no therapy, no matter how vigorous, can save the patient - even if transfusion transiently restores cardiac output and arterial pressure to normal, deterioration continues and death follows within minutes to hours
- Key mechanism: depletion of cellular high-energy phosphate reserves - creatine phosphate is exhausted, ATP degrades progressively to ADP -> AMP -> adenosine, which diffuses out of cells and is irreversibly converted to uric acid (cannot re-enter cells to regenerate the phosphate system). New adenosine synthesis occurs at only ~2% of normal cellular content per hour - meaning cellular energy stores, once depleted this severely, cannot be replenished in time
- Widespread mitochondrial and lysosomal damage, massive acidosis, and diffuse microvascular thrombosis complete the irreversible cascade
5. Summary Table
| Stage | Cardiac Output | Compensation | Reversibility |
|---|---|---|---|
| Compensated | Mildly reduced | Reflexes fully restore perfusion | Fully reversible, may need no treatment |
| Progressive | Falling further | Compensatory mechanisms overwhelmed, positive feedback loops begin | Reversible only with prompt aggressive treatment |
| Irreversible | Severely reduced, may transiently normalize with treatment | Mechanisms exhausted, cellular energy depletion | Death inevitable despite treatment |
6. Clinical Correlation (brief, ties everything together)
- Management principle: treat the underlying cause (fluids for hypovolemic, inotropes/revascularization for cardiogenic, antibiotics + fluids + vasopressors for septic, epinephrine + antihistamines for anaphylactic) as early as possible - ideally during the compensated stage, before the positive feedback loops of progressive shock take hold
- Early recognition matters more than late aggressive treatment, because once irreversible shock sets in, therapy cannot alter the outcome
How to structure this LAQ for full marks
- Definition + the "BP can be misleading" concept (2 marks)
- Classification: hypovolemic, cardiogenic, obstructive, distributive (septic, anaphylactic, neurogenic) with brief mechanism of each (5-6 marks)
- Stages of shock: compensated (list all reflex mechanisms), progressive (list all positive feedback loops), irreversible (energy depletion mechanism) - this is the bulk of the marks (8-10 marks)
- Diagram: cardiac output vs time curves in hemorrhagic shock (2 marks)
- Brief clinical correlation (1-2 marks)
- Heart Sounds (S1-S4, mechanism, timing)
- Heart Block (types, ECG correlation)
- Properties of Cardiac Muscle & why it cannot be tetanized (refractory period)
- Ionic Basis of Autorhythmicity in SA Node (pacemaker potential)
- Role of JGA in Regulation of Blood Pressure
- Renin-Angiotensin-Aldosterone Mechanism
- Angina Pectoris
- Myocardial Infarction
- Ejection Fraction
- Stroke Volume - definition + factors affecting
- Cardiorespiratory Changes During Exercise
A medical educational diagram titled "Heart Sounds and the Cardiac Cycle" for exam study. It shows a horizontal time axis representing one cardiac cycle, with two aligned tracings stacked vertically: on top, an ECG waveform showing P wave, QRS complex, and T wave; below it, a phonocardiogram tracing (sound amplitude vs time) showing four labeled heart sound markers at their correct timing: "S1" positioned right after the QRS complex (mitral and tricuspid valve closure, start of systole), "S2" positioned right after the T wave (aortic and pulmonary valve closure, end of systole), a small optional "S3" shortly after S2 in early diastole (rapid ventricular filling), and a small optional "S4" just before the next QRS complex (atrial contraction, late diastole). Include brief text labels near each sound describing its cause: S1 = "Mitral + Tricuspid valve closure", S2 = "Aortic + Pulmonary valve closure", S3 = "Rapid ventricular filling (early diastole)", S4 = "Atrial contraction against stiff ventricle". Clean black and white textbook line-art diagram style with light color accents, clearly labeled axes, suitable for printing as a compact study reference.
HEART SOUNDS
Definition
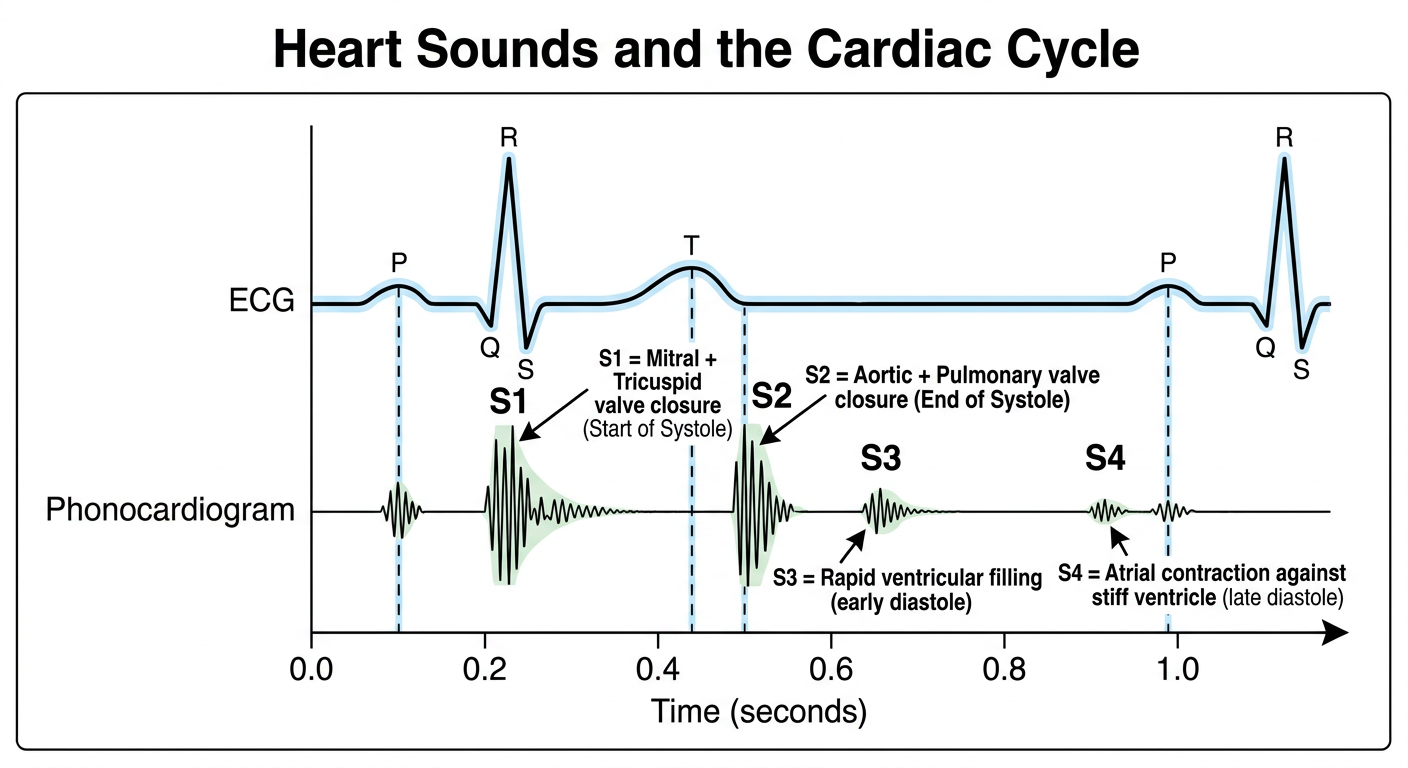
The Four Heart Sounds
- Caused by closure of the mitral and tricuspid (AV) valves at the start of ventricular systole (isovolumetric contraction)
- Mechanism: sudden back-flow of blood against the closing AV valves causes them to bulge toward the atria until the chordae tendineae abruptly stop them, producing vibration of the valves, blood, and adjacent heart walls
- Duration ~0.14 sec, lower pitch (AV valves less taut)
- Best heard at the mitral (apex) and tricuspid areas
- Caused by closure of the aortic and pulmonary (semilunar) valves at the end of systole
- Mechanism: sudden cessation of forward flow causes the semilunar valves to snap shut, with elastic recoil of blood against the taut valves and arterial walls
- Duration ~0.11 sec, higher pitch (semilunar valves are tauter, arterial walls more elastic) than S1
- Physiological splitting occurs with inspiration (pulmonary valve closes slightly later)
- Occurs 100-150 msec after S2, in early diastole, during the phase of rapid ventricular filling
- Caused by tensing of the chordae tendineae as the ventricle rapidly expands with inflowing blood
- Low-pitched; physiological in children/young adults; in older adults it usually indicates volume overload or reduced ventricular compliance (e.g., heart failure, mitral regurgitation) - called a "ventricular gallop"
- Occurs in late diastole (presystole), coinciding with atrial contraction
- Caused by forceful atrial contraction pumping blood into a stiff, non-compliant ventricle
- Never present in atrial fibrillation (needs organized atrial contraction)
- Low-pitched, heard best at the apex; always abnormal in adults - seen in ventricular hypertrophy (hypertension, aortic stenosis, hypertrophic cardiomyopathy) and ischemia - called an "atrial gallop"
Summary Table
| Sound | Cause | Timing | Normal/Abnormal |
|---|---|---|---|
| S1 | Mitral + tricuspid valve closure | Start of systole (after QRS) | Normal |
| S2 | Aortic + pulmonary valve closure | End of systole (after T wave) | Normal |
| S3 | Rapid ventricular filling | Early diastole | Normal in youth; abnormal in adults (volume overload) |
| S4 | Atrial contraction vs. stiff ventricle | Late diastole (presystole) | Always abnormal in adults (hypertrophy/stiffness) |
Continue with Heart Block (SAQ #2)
A medical educational diagram titled "Types of Heart Block - ECG Patterns" for exam study, showing four stacked ECG strip examples labeled clearly: 1) "Normal Sinus Rhythm" - a regular ECG strip with evenly spaced P waves each followed by a QRS complex, normal PR interval. 2) "First-Degree AV Block" - an ECG strip with P wave before every QRS complex but with a visibly prolonged PR interval (labeled with an arrow showing the lengthened PR segment, greater than 0.20 seconds). 3) "Second-Degree AV Block (Mobitz Type I / Wenckebach)" - an ECG strip showing progressively lengthening PR intervals across several beats until one P wave fails to conduct and a QRS is dropped, then the cycle repeats. Label the dropped beat. 4) "Second-Degree AV Block (Mobitz Type II)" - an ECG strip showing constant PR intervals with occasional sudden dropped QRS complexes without progressive lengthening beforehand. 5) "Third-Degree AV Block (Complete Heart Block)" - an ECG strip showing P waves marching regularly at a faster rate, completely independent of QRS complexes which occur at their own slower regular rate, with dashed vertical lines showing dissociation between P waves and QRS complexes. Clean black and white textbook line-art ECG diagram style with light color accents distinguishing P waves and QRS complexes, clear labels for each strip, suitable for printing as a compact study reference.
HEART BLOCK (Atrioventricular Block)
Definition
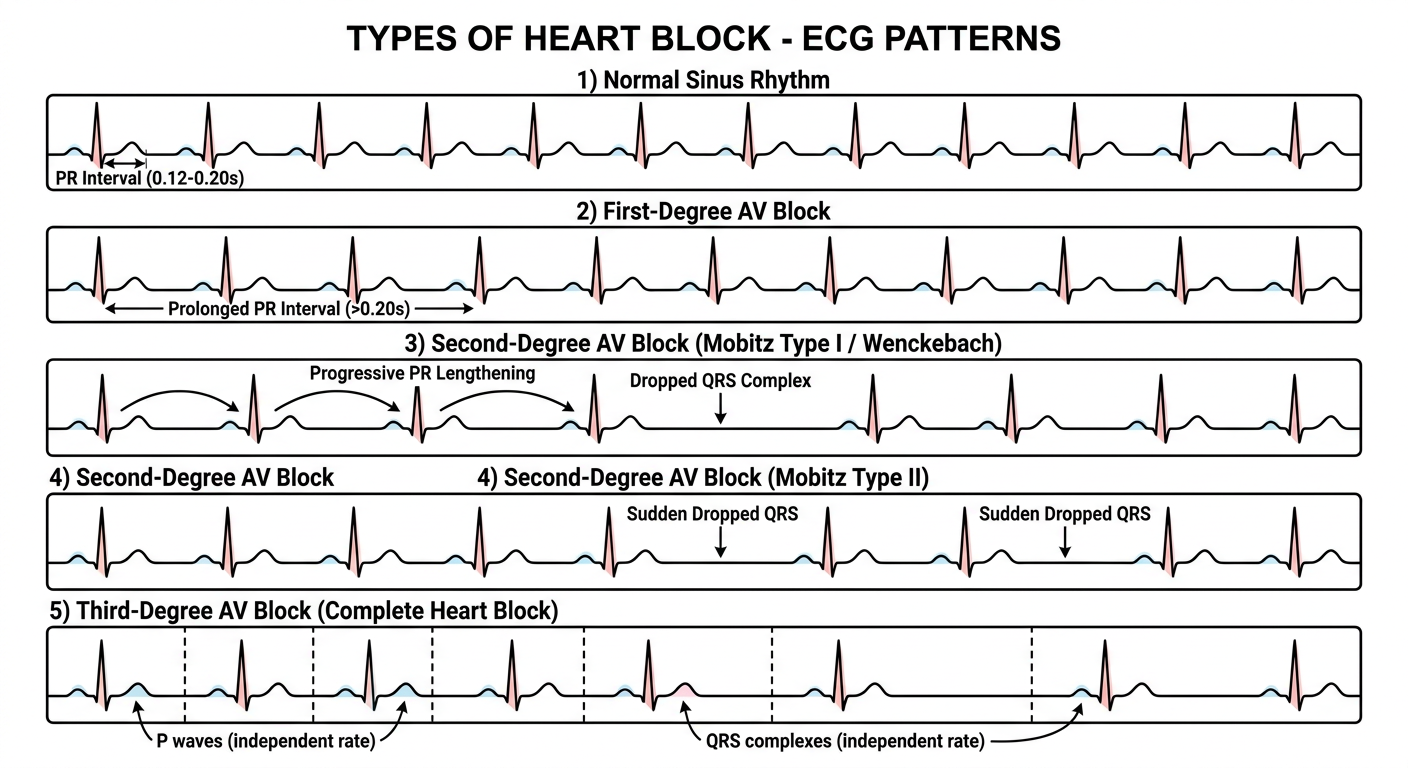
Causes (enumerate briefly)
- Ischemia of the AV node/bundle (coronary insufficiency)
- Compression by scar tissue or calcification
- Inflammation (myocarditis/endocarditis - diphtheria, rheumatic fever)
- Excessive vagal stimulation (e.g., carotid sinus syndrome)
- Degeneration of the conduction system in elderly
- Drugs - digitalis, beta-blockers
Classification
First-Degree Block - Prolonged PR interval
- Normal PR interval is ~0.16 sec (up to 0.20 sec)
- In first-degree block, PR interval is prolonged beyond 0.20 sec (may reach 0.35-0.45 sec)
- Every P wave is still followed by a QRS - this is a delay, not an actual dropped beat
- Used clinically to gauge severity of conditions like acute rheumatic heart disease
Second-Degree Block - Some impulses fail to conduct
- PR interval progressively lengthens over successive beats until one P wave completely fails to conduct (a QRS is "dropped")
- The cycle then resets and repeats
- Usually due to conduction delay within the AV node itself; generally more benign
- PR interval stays constant, but QRS complexes are dropped suddenly and unpredictably (e.g., every 3rd or 4th beat - "3:1 or 4:1 block")
- Usually reflects disease lower in the conduction system (bundle of His/Purkinje); more likely to progress to complete block
Third-Degree (Complete) Heart Block
- Complete failure of impulse conduction from atria to ventricles
- Atria and ventricles beat completely independently ("AV dissociation") - P waves march at their own (usually normal, ~100/min) rate, while the ventricles establish their own spontaneous rhythm from a focus in the AV node/bundle distal to the block, beating slowly at 15-40 beats/min
- No relationship between P wave timing and QRS-T timing on the ECG
Stokes-Adams Syndrome (Ventricular Escape) - important physiological point
- When complete block suddenly occurs, the ventricles do not immediately start beating on their own - there is a delay of 5-30 seconds due to overdrive suppression (ventricular pacemaker tissue was being driven faster than its own natural rate by the atria, so it takes time to "wake up" and discharge independently)
- Since the brain cannot stay conscious without blood flow for more than 4-7 seconds, this delay causes fainting (syncope) - repeated fainting episodes from intermittent complete block are called Stokes-Adams attacks
- Once a Purkinje/AV bundle focus distal to the block "escapes" and begins pacing the ventricles (ventricular escape rhythm), cardiac output resumes and the patient recovers
- If the pause is too prolonged, it can be fatal - hence such patients are treated with an artificial pacemaker
Summary Table
| Type | PR Interval | Dropped beats | Key feature |
|---|---|---|---|
| First-degree | Prolonged (>0.20 sec) | None | Delay only |
| Second-degree Mobitz I | Progressively lengthens | Yes, cyclical | Wenckebach pattern |
| Second-degree Mobitz II | Constant | Yes, sudden | Fixed ratio dropped beats |
| Third-degree (complete) | No relation (AV dissociation) | All atrial impulses blocked | Independent atrial and ventricular rates |
Continue with Cardiac Muscle Properties & Tetanization (SAQ #3)
A medical physiology diagram titled "Why Cardiac Muscle Cannot Be Tetanized" for exam study, showing two graphs stacked vertically sharing the same time axis for one cardiac contraction cycle: Top graph: a ventricular muscle action potential curve showing the characteristic long plateau shape (rapid depolarization, brief spike, then a long plateau phase, then repolarization), lasting about 250-300 milliseconds, with the "Absolute Refractory Period" shaded as a wide band covering almost the entire depolarization and plateau phase, and a small "Relative Refractory Period" band shown just after it during late repolarization. Bottom graph, aligned on the same time axis: a mechanical twitch/tension curve (contraction curve) showing tension rising and falling, timed so that the peak of contraction occurs during the plateau/refractory period and the muscle has almost finished relaxing by the time the refractory period ends. Add an annotation with an arrow pointing to the overlap showing "Refractory period nearly equals duration of contraction - no new stimulus can trigger summation before relaxation is complete, so tetanus (sustained fused contraction) is impossible." For comparison, include a small inset panel showing a skeletal muscle action potential (very brief spike, only 1-2 milliseconds) next to a much longer muscle twitch, with a note "Skeletal muscle: short refractory period allows summation and tetanus." Clean black and white textbook line-art diagram style with light color accents, clear axis labels (Membrane potential mV, Tension, Time in milliseconds), suitable for printing as a compact study reference.
PROPERTIES OF CARDIAC MUSCLE & WHY IT CANNOT BE TETANIZED
Physiological Properties of Cardiac Muscle (enumerate briefly)
- Excitability - ability to respond to a stimulus with an action potential
- Autorhythmicity - ability to generate its own rhythmic impulses spontaneously (SA node, AV node, Purkinje fibers)
- Conductivity - ability to conduct the impulse from cell to cell via gap junctions (functional syncytium)
- Contractility - ability to shorten/develop tension in response to the action potential
- Long refractory period - the property most relevant to this question (detailed below)
- All-or-none response / functional syncytium - because cardiac cells are electrically connected by gap junctions, an impulse spreads through the entire atrial or ventricular mass as a single unit - the heart contracts as a whole or not at all, never partially
- Rate-dependent duration of systole - unique to cardiac muscle: as heart rate increases, the duration of systole shortens much less than diastole (systole ~0.27 sec at 65 bpm vs ~0.16 sec at 200 bpm) - protects filling time but has limits at very high rates
Why Cardiac Muscle Cannot Be Tetanized
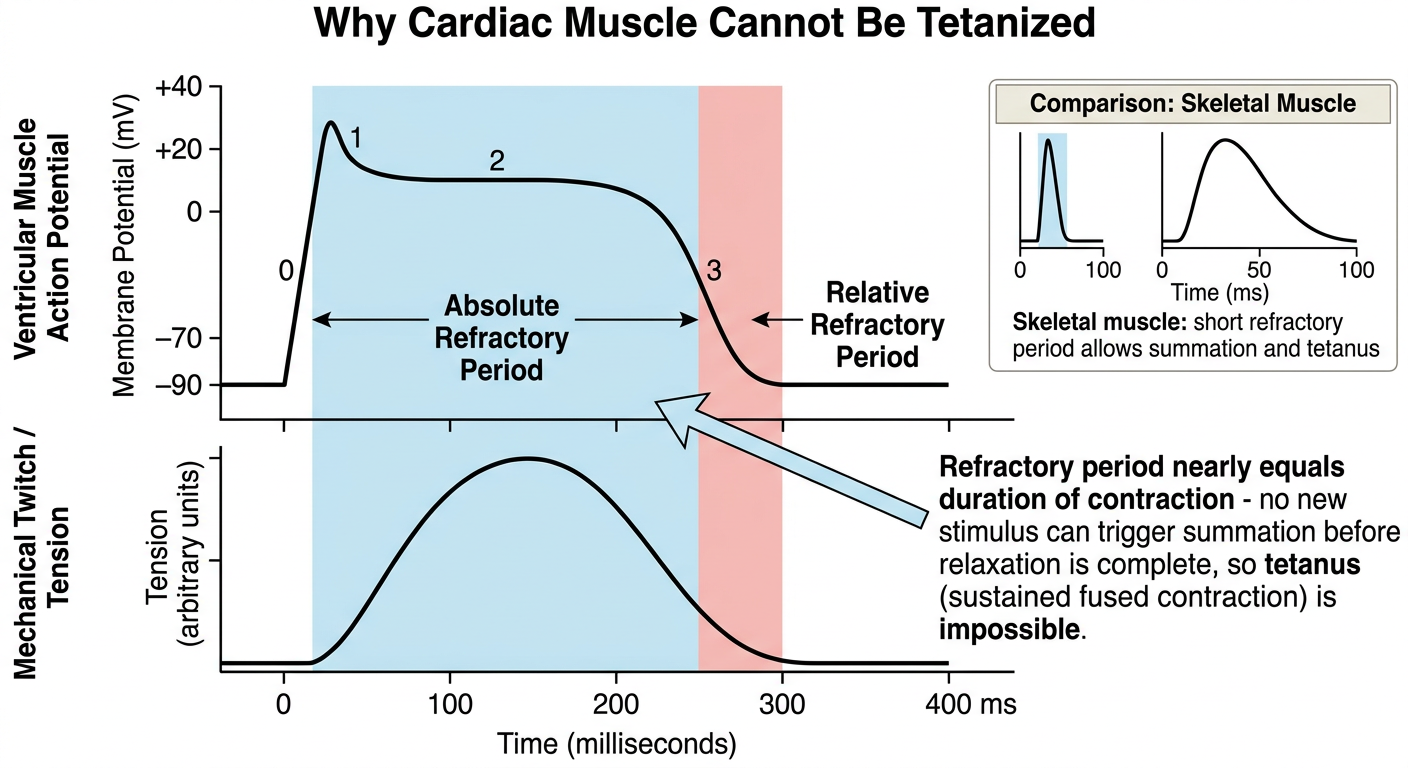
The core mechanism: prolonged action potential -> prolonged refractory period
- Cardiac muscle action potential has a characteristic plateau phase (phase 2), maintained by slow Ca2+ influx through L-type calcium channels, making the total action potential duration ~250-300 milliseconds - vastly longer than a skeletal muscle or nerve action potential (~1-2 msec)
- During the absolute refractory period, the Na+ (and Ca2+) channel inactivation gates remain closed, and no stimulus, however strong, can generate a new action potential until the membrane repolarizes back toward resting potential
- Because the cardiac action potential's plateau lasts almost as long as the mechanical contraction (twitch) itself, the muscle remains refractory to a new stimulus until it has nearly finished relaxing
- This means a second stimulus arriving during or immediately after a contraction cannot produce summation of contractions - there is no way to "stack" twitches on top of each other the way skeletal muscle can, because by the time the muscle becomes excitable again, the previous contraction is already over
Contrast with skeletal muscle (the comparison examiners want you to draw)
- Skeletal muscle action potential is very brief (1-2 msec) compared to its twitch duration (which can last 20-100 msec)
- This means the refractory period ends long before the mechanical twitch is complete
- A second stimulus can therefore arrive while the first twitch is still ongoing, causing summation, and with repeated rapid stimuli, a smooth, sustained tetanic contraction
- In cardiac muscle, the near-equal duration of the refractory period and the twitch makes this summation/tetanus physiologically impossible
Physiological significance (why this matters - always include this)
- This built-in protection ensures the heart always has adequate time to relax and fill with blood between beats - if cardiac muscle could be tetanized, the ventricles would remain permanently contracted and could never fill with venous return, causing circulatory arrest
- It sets a theoretical ceiling on heart rate - ventricles could theoretically contract up to ~400/min, but the AV node's own longer refractory period limits conduction to ~230 impulses/min in adults; sustained ventricular rates above this occur only pathologically (e.g., paroxysmal ventricular tachycardia)
Summary Table
| Feature | Skeletal Muscle | Cardiac Muscle |
|---|---|---|
| Action potential duration | ~1-2 msec | ~250-300 msec |
| Refractory period vs twitch duration | Much shorter than twitch | Nearly equal to twitch |
| Summation of contractions | Possible | Not possible |
| Tetanus | Possible with rapid stimulation | Impossible |
| Functional consequence | Sustained tension for posture/movement | Guaranteed relaxation/filling time each cycle |
Continue with SA Node Autorhythmicity (ionic basis of pacemaker potential)
A medical physiology diagram titled "Ionic Basis of SA Node Pacemaker Potential" for exam study. Show a single graph with membrane potential (mV) on the Y-axis (ranging from about -65 mV to +10 mV) plotted against time on the X-axis, depicting three consecutive spontaneous action potentials of a sinoatrial node cell with a smoothly curving, unstable baseline (no flat resting potential). Label the following phases clearly on the upstroke of one action potential: - "Maximum diastolic potential (~-65 mV)" at the lowest point of the curve. - "Phase 4: Slow spontaneous depolarization (pacemaker potential)" along the slowly rising diagonal portion, with an arrow noting "caused by If (funny current, inward Na+), and T-type Ca2+ channels". - "Threshold" marked with a dashed horizontal line where the slope steepens. - "Phase 0: Upstroke" at the rising spike, labeled "due to opening of L-type Ca2+ channels (inward Ca2+ current), not fast Na+ channels". - "Phase 3: Repolarization" on the downstroke, labeled "due to increased K+ conductance (outward K+ current)". Add two small side annotation arrows near the pacemaker potential phase showing how sympathetic stimulation (labeled "Sympathetic: increases slope of Phase 4, steeper line, reaches threshold sooner, increased heart rate") steepens the slope of phase 4, and parasympathetic/vagal stimulation (labeled "Vagal: hyperpolarizes and flattens Phase 4 slope, decreased heart rate") flattens it and lowers the starting point, shown as two faint alternative dashed curves overlaid on the main curve. Clean black and white textbook line-art diagram style with light color accents, clear axis labels, suitable for printing as a compact study reference.
SA NODE AUTORHYTHMICITY - Ionic Basis of the Pacemaker Potential
Why the SA Node is Different
- Automaticity - it spontaneously generates action potentials without any external (neural) trigger
- Unstable resting membrane potential - unlike atrial/ventricular fibers which sit quietly at a stable resting potential (-85 to -90 mV) until stimulated, SA nodal fibers never truly "rest"
- No sustained plateau - phases 1 and 2 (present in ventricular muscle) are absent
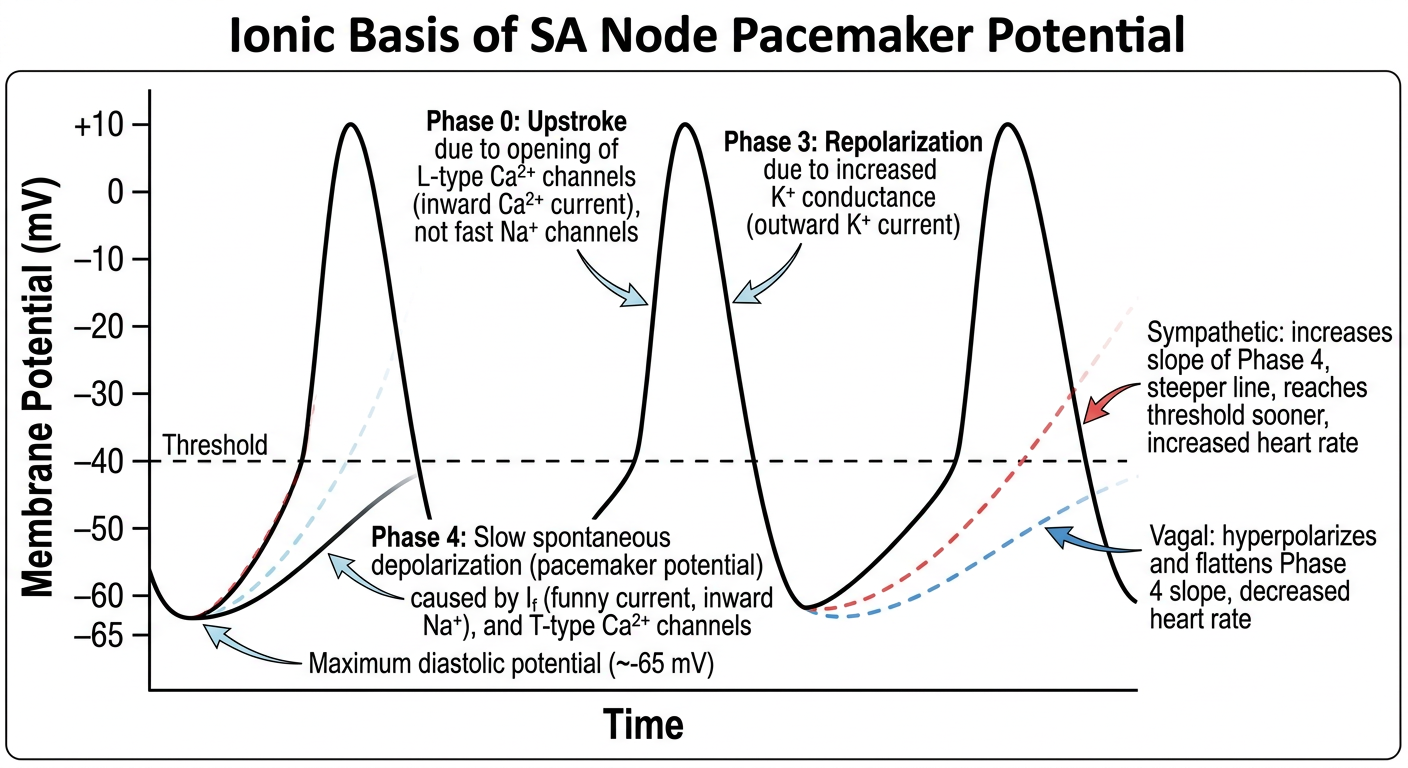
The Phases and Their Ionic Basis (core of this answer)
Phase 4 - Spontaneous (Pacemaker) Depolarization - the key to autorhythmicity
- This is the longest portion of the SA node action potential and is directly responsible for automaticity
- Starting from the maximum diastolic potential (~-65 mV), the membrane does not stay at rest - it slowly and spontaneously depolarizes toward threshold
- Ionic basis: opening of special Na+ channels producing a slow inward Na+ current called I_f ("funny current")
- Called "funny" because, unusually, it is activated by repolarization/hyperpolarization from the preceding action potential (most channels are activated by depolarization) - this ensures every action potential is automatically followed by another
- T-type ("transient") Ca2+ channels also open during this phase and contribute additional inward current that helps complete the approach to threshold
- Once this slow depolarization brings the membrane to threshold, the next phase begins
Phase 0 - Upstroke
- Unlike ventricular muscle (where the fast upstroke is due to fast Na+ channels), the SA node upstroke is generated by opening of L-type ("long-lasting") Ca2+ channels, producing a slow inward Ca2+ current
- This is why the SA node upstroke is less steep and slower than the ventricular action potential upstroke
Phases 1 and 2 - Absent
- There is no rapid initial repolarization or plateau in SA nodal cells, unlike ventricular muscle
Phase 3 - Repolarization
- Due to increased K+ conductance (gK), producing an outward K+ current that brings the membrane back down toward the maximum diastolic potential
- Once repolarization occurs, I_f is switched back on, and the entire cycle (Phase 4 -> 0 -> 3) repeats automatically - this is the basis of continuous rhythmicity
Determinant of Heart Rate (very important, high-yield line)
- Steeper Phase 4 slope -> threshold reached faster -> more action potentials per minute -> increased heart rate
- Flatter Phase 4 slope (or more negative starting point) -> threshold reached slower -> decreased heart rate
Autonomic Modulation (ties this topic to your MAP/baroreceptor answer)
- Sympathetic stimulation (norepinephrine, beta-1 receptors): increases I_f and Ca2+ currents -> steepens the Phase 4 slope -> threshold reached sooner -> positive chronotropic effect (increased HR)
- Parasympathetic/vagal stimulation (acetylcholine, muscarinic receptors): increases K+ conductance (hyperpolarizes the maximum diastolic potential, making it more negative) and decreases I_f -> flattens the Phase 4 slope and increases the distance to threshold -> negative chronotropic effect (decreased HR) - vagal tone dominates at rest, which is why resting HR is well below the SA node's intrinsic firing rate
Latent Pacemakers (brief mention)
Summary Table
| Phase | Event | Ionic basis |
|---|---|---|
| 4 | Spontaneous (pacemaker) depolarization | I_f (funny Na+ current) + T-type Ca2+ current |
| 0 | Upstroke | L-type Ca2+ current (inward) |
| 1, 2 | Absent | - |
| 3 | Repolarization | Increased K+ conductance (outward K+ current) |
Let's do JGA and BP regulation
A medical physiology diagram titled "Juxtaglomerular Apparatus (JGA)" for exam study, showing a cross-sectional anatomical illustration of a renal glomerulus with the following structures clearly labeled: the afferent arteriole entering the glomerulus, the efferent arteriole leaving it, the glomerular capillary tuft, the distal convoluted tubule passing close to the arterioles, and at the point of contact between the afferent arteriole and the distal tubule, three labeled components: "Juxtaglomerular (granular) cells" in the wall of the afferent arteriole shown containing small granules representing stored renin, "Macula Densa" as a modified patch of tubular epithelial cells touching the arterioles, and "Extraglomerular mesangial (lacis) cells" filling the space between the afferent and efferent arterioles. Add small labeled arrows showing three inputs converging on the juxtaglomerular cells to trigger renin release: an arrow from the macula densa labeled "Decreased NaCl delivery", an arrow from the afferent arteriole wall labeled "Decreased stretch/pressure (renal baroreceptor)", and an arrow from a sympathetic nerve fiber labeled "Sympathetic stimulation (beta-1)". Clean black and white textbook line-art histology/anatomy diagram style with light color accents, clear labels, suitable for printing as a compact study reference.
ROLE OF JGA IN REGULATION OF BLOOD PRESSURE
What is the JGA?
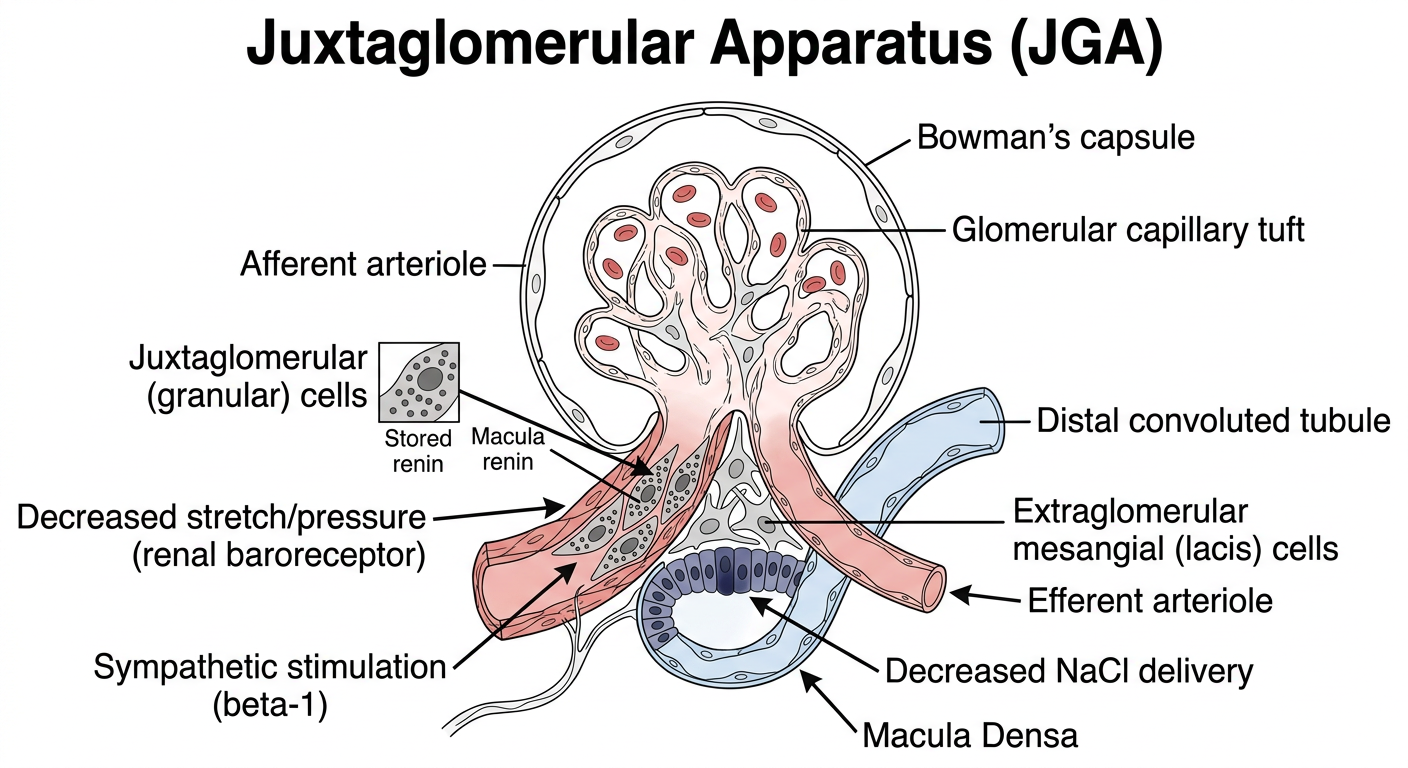
Three Components of the JGA (structure)
- Juxtaglomerular (Granular) Cells - modified smooth muscle cells in the wall (media) of the afferent arteriole; contain secretory granules packed with renin - the actual site of renin synthesis, storage, and release
- Macula Densa - a specialized patch of tubular epithelial cells at the start of the distal convoluted tubule, positioned in close contact with the afferent arteriole; acts as a chemosensor, detecting NaCl concentration/delivery in the tubular fluid
- Extraglomerular Mesangial (Lacis) Cells - agranular cells filling the space between the afferent and efferent arterioles; thought to help relay signals between the macula densa and the granular cells
The Three Mechanisms Triggering Renin Release (core of "role in BP regulation")
1. Macula Densa Mechanism (tubular NaCl sensing)
- The macula densa detects NaCl concentration/delivery to the distal tubule (via the Na+/K+/2Cl- cotransporter)
- There is an inverse relationship: decreased NaCl delivery (as occurs with reduced GFR/reduced renal perfusion in hypovolemia or hypotension) -> stimulates renin release
- Signal mediators: PGE2 and nitric oxide stimulate renin release; adenosine inhibits it
- This is the same mechanism underlying tubuloglomerular feedback, which also locally adjusts afferent arteriolar tone to maintain a stable GFR
2. Renal (Intrarenal) Baroreceptor Mechanism
- The juxtaglomerular cells themselves act as stretch receptors in the afferent arteriole wall
- Inverse relationship between renal artery/afferent arteriolar pressure and renin release: decreased stretch (i.e., falling renal perfusion pressure/hypotension) -> increased renin release; increased stretch -> decreased renin release
- At normal BP, this baroreceptor-driven renin secretion is low; it rises sharply in hypotensive states - directly linking JGA function to your MAP regulation topic
3. Sympathetic Nervous System Mechanism
- Renal sympathetic nerves release norepinephrine, acting on beta-1 adrenoceptors on the juxtaglomerular cells to directly stimulate renin release
- Also acts indirectly by enhancing the baroreceptor and macula densa mechanisms
- This means that baroreceptor reflex-driven sympathetic activation (from your MAP/baroreceptor answer) during hypotension or hemorrhage directly recruits the JGA to release renin - beautifully linking the fast neural (baroreceptor) and slow hormonal (RAAS) blood pressure control systems together
Overall Physiological Role in BP Regulation
- Decreased NaCl delivery to macula densa + decreased afferent arteriolar stretch + increased renal sympathetic activity all converge on the JG cells
- This triggers renin release into the blood, initiating the Renin-Angiotensin-Aldosterone cascade (angiotensin II -> vasoconstriction; aldosterone -> Na+/water retention), which raises blood pressure and restores volume over minutes to hours - the JGA is therefore the initiating step of one of the body's most powerful long-term blood pressure regulators (as listed in your MAP/regulation answer)
Summary Table
| Component | Location | Function |
|---|---|---|
| Juxtaglomerular (granular) cells | Wall of afferent arteriole | Synthesize, store, and release renin; act as intrarenal baroreceptor |
| Macula densa | Distal tubule touching arterioles | Senses NaCl delivery; triggers renin release and tubuloglomerular feedback |
| Lacis (mesangial) cells | Between afferent/efferent arterioles | Structural/signal relay support |
Yes
A medical physiology flowchart diagram titled "Renin-Angiotensin-Aldosterone System (RAAS)" for exam study, showing a top-to-bottom cascade with labeled boxes connected by downward arrows: Box 1 (top): "Decreased Arterial Pressure / Blood Volume" with three small arrows feeding into it from the left labeled "Decreased renal perfusion (baroreceptor)", "Decreased NaCl delivery (macula densa)", and "Increased renal sympathetic activity". Arrow down to Box 2: "Juxtaglomerular cells release RENIN". Arrow down to Box 3: "Angiotensinogen (from liver) --> Angiotensin I" with small text "catalyzed by renin". Arrow down to Box 4: "Angiotensin I --> Angiotensin II" with small text "catalyzed by Angiotensin-Converting Enzyme (ACE) in lungs". From Box 4, branch into four parallel arrows leading to four side boxes: - "Adrenal cortex (zona glomerulosa): stimulates Aldosterone secretion --> increased Na+ and water reabsorption in distal tubule/collecting duct --> increased blood volume" - "Arterioles: direct vasoconstriction via AT1 receptors --> increased Total Peripheral Resistance" - "Hypothalamus: increased thirst and ADH secretion --> increased water reabsorption" - "Kidney proximal tubule: increased Na+-H+ exchange --> increased Na+ and HCO3- reabsorption" All four side boxes have arrows converging back down into a final box: "Increased Blood Volume + Increased Total Peripheral Resistance --> Increased Arterial Pressure restored toward normal". Clean black and white textbook flowchart style with light color accents, clear labeled boxes and arrows, suitable for printing as a compact study reference.
RENIN-ANGIOTENSIN-ALDOSTERONE MECHANISM (RAAS)
Overview
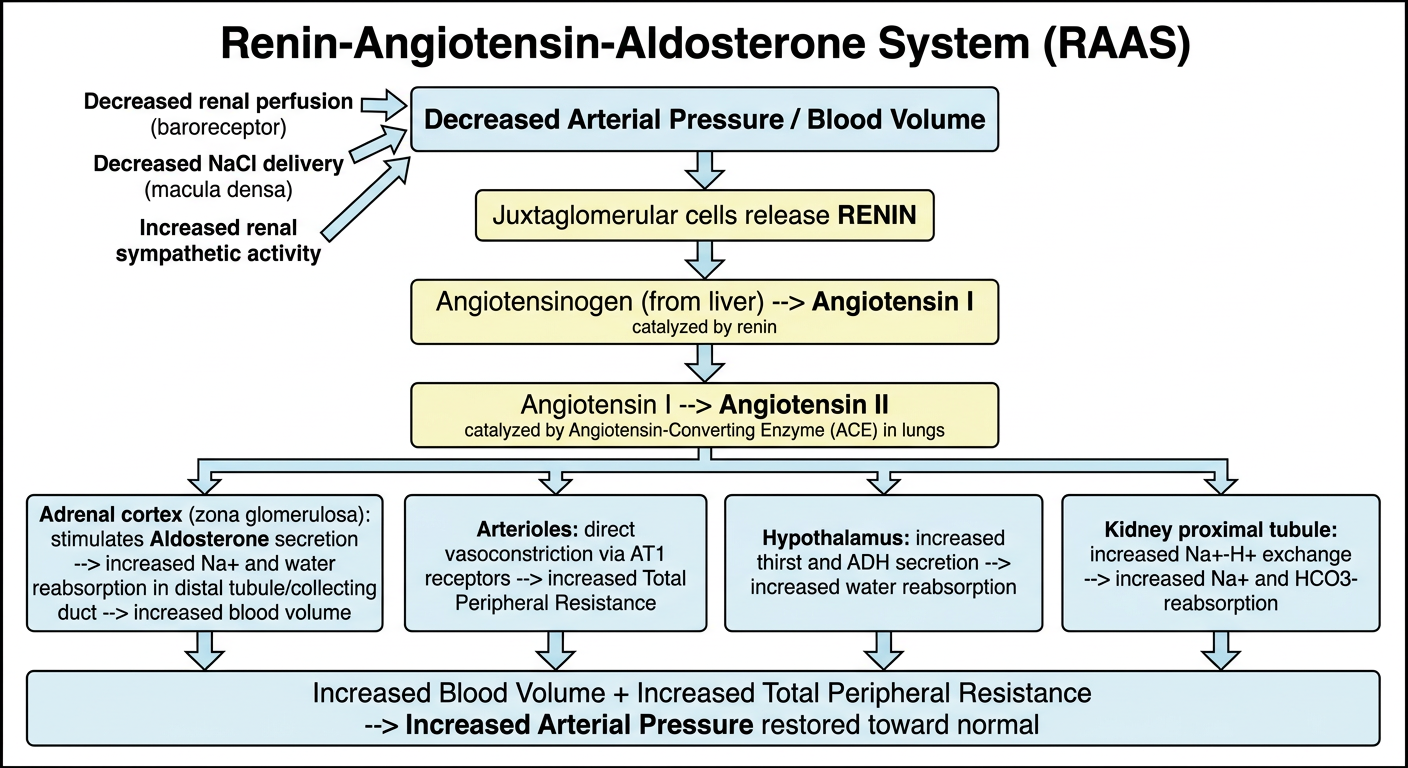
Step-by-Step Mechanism
Step 1: Renin Release
- A fall in arterial pressure (Pa) decreases renal perfusion pressure, sensed by the JGA via three converging inputs (from your last answer): renal baroreceptor (decreased afferent arteriolar stretch), macula densa (decreased NaCl delivery), and increased renal sympathetic activity (beta-1 stimulation)
- This causes prorenin to be converted to renin and released from the juxtaglomerular cells into the blood
Step 2: Angiotensin I Formation
- Renin is an enzyme, not a hormone itself - it acts on angiotensinogen (a plasma protein/glycoprotein synthesized by the liver, "renin substrate")
- Renin cleaves angiotensinogen to form Angiotensin I, a biologically near-inactive decapeptide (10 amino acids) that serves mainly as a precursor
Step 3: Angiotensin II Formation
- Angiotensin I is converted to Angiotensin II (an active octapeptide, 8 amino acids) by Angiotensin-Converting Enzyme (ACE), found predominantly in the pulmonary and renal vascular endothelium
- Pharmacology link (write this - always asked): ACE inhibitors (e.g., captopril) block this step; AT1 receptor blockers/ARBs (e.g., losartan) block angiotensin II action at the target tissue level
Step 4: Actions of Angiotensin II (the effector arm - biggest scoring section)
- Stimulates synthesis and secretion of aldosterone (via phospholipase C -> protein kinase C -> facilitates conversion of cholesterol to pregnenolone and aldosterone synthase activity)
- Aldosterone acts on principal cells of the distal tubule and collecting duct to increase Na+ reabsorption (and K+ secretion) -> increases ECF volume and blood volume
- This action requires gene transcription/new protein synthesis, taking hours to days - explains the slow onset of this arm of RAAS
- Direct vasoconstriction via AT1 receptors activating the IP3/Ca2+ second messenger system
- Increases Total Peripheral Resistance (TPR) -> increases arterial pressure directly and rapidly (angiotensin II is one of the most potent vasoconstrictors in the body)
- Stimulates Na+-H+ exchange in the proximal tubule -> increases reabsorption of Na+ and HCO3-
- Increases thirst and water intake
- Stimulates ADH (vasopressin) secretion -> increases water reabsorption in collecting ducts
- These effects complement the Na+-retaining actions above by increasing total body water
Net Result
Summary Flow (write as a chain for quick recall)
Clinical Correlation (brief, for extra marks)
- Chronic overactivity of RAAS contributes to essential hypertension and heart failure progression - the pharmacological basis for using ACE inhibitors, ARBs, and aldosterone antagonists (spironolactone) in these conditions
- Renin-secreting tumors or renal artery stenosis can cause secondary hypertension through excess renin production
Summary Table
| Step | Substance | Enzyme/Site |
|---|---|---|
| 1 | Angiotensinogen -> Angiotensin I | Renin (from JG cells) |
| 2 | Angiotensin I -> Angiotensin II | ACE (lungs/kidney) |
| 3 | Angiotensin II -> 4 effector actions | AT1 receptors (adrenal, vessels, kidney, brain) |
| 4 | Aldosterone -> Na+ reabsorption | Zona glomerulosa, distal tubule/collecting duct |
Continue with the remaining 5 topics: Angina, MI, Ejection Fraction, Stroke Volume, Exercise physiology
Continue with angina pectoris