
Explain these topics Blood Pressure Regulation & Shock Cardiac Output (Regulation & Measurement) ECG (Normal waves, leads, blocks) Cardiac Cycle & Heart Sounds Hypoxia (Types & Distinguishing features) Surfactant & Respiratory Distress Syndrome O2-Hb Dissociation Curve & Shift Factors Neural/Chemical Regulation of Respiration Acclimatization at High Altitude Counter-Current Mechanism GFR & its Regulation Juxtaglomerular Apparatus (JGA) Micturition Reflex Renal Clearance (Inulin/Creatinine) Jaundice (Types & Pathophysiology) Coagulation Cascade & Hemophilia Blood Groups & Mismatched Transfusion Immunity (T/B cells & applied) Erythropoiesis Gastric HCI Secretion & Peptic Ulcer Pancreatic Juice Composition & Regulation Bile & Enterohepatic Circulation Deglutition
cardiac cycle heart sounds pressure volume ECG diagram
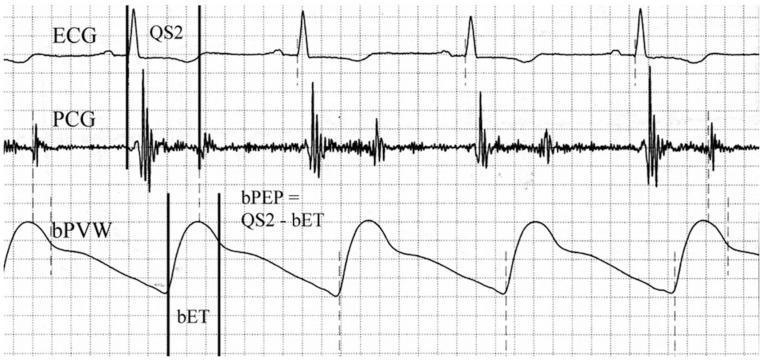
This physiological waveform diagram displays a simultaneous recording of three cardiac parameters used for assessing cardiovascular hemodynamics. The top trace is an Electrocardiogram (ECG) showing standard QRS complexes representing ventricular depolarization. The middle trace is a Phonocardiogram (PCG) capturing acoustic vibrations of heart sounds, specifically the S1 and S2 sounds. The bottom trace is a Brachial Pulse Volume Waveform (bPVW) illustrating the peripheral arterial pressure pulse. Vertical markers indicate temporal relationships between these signals to calculate systolic time intervals. The 'QS2' interval is marked from the onset of the QRS complex on the ECG to the aortic component of the second heart sound on the PCG, representing the total electromechanical systolic interval. The 'bET' (Brachial Ejection Time) is delineated on the bPVW from the waveform foot to the dicrotic notch. An annotated formula shows the calculation of the Brachial Pre-ejection Period (bPEP) as the difference between QS2 and bET (bPEP = QS2 - bET). This diagram is an educational tool for understanding the non-invasive assessment of cardiac systolic function and arterial stiffness.
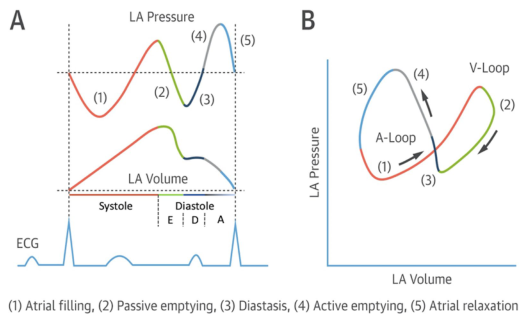
Summary : This figure illustrates the left atrial (LA) pressure-volume relationship during the cardiac cycle, showing both time-course traces and a pressure-volume loop, with key phases of atrial function annotated and correlated with the ECG. line plot and loop diagram: # Panel A: LA Pressure and Volume Traces • Top trace: LA Pressure (y-axis, arbitrary units) over time. • Middle trace: LA Volume (y-axis, arbitrary units) over time. • Bottom trace: ECG waveform for temporal reference. • X-axis: Cardiac cycle phases, with systole and diastole labeled; diastole further subdivided into E, D, and A phases. • Five phases are color-coded and numbered: – (1) Atrial filling (red) – (2) Passive emptying (green) – (3) Diastasis (black) – (4) Active emptying (blue) – (5) Atrial relaxation (gray) • Vertical dashed lines demarcate transitions between phases. # Panel B: LA Pressure-Volume Loop • X-axis: LA Volume (arbitrary units). • Y-axis: LA Pressure (arbitrary units). • The loop is traced in a counterclockwise direction, with arrows indicating the sequence. • The same five phases (1–5) are color-coded as in Panel A. • The loop is divided into two segments: A-Loop (phases 1, 3, 4, 5) and V-Loop (phase 2). # Design Encodings : • Distinct colors for each phase (red, green, black, blue, gray). • Arrows on the loop indicate the direction of the cardiac cycle. • ECG trace provides timing reference for the pressure and volume changes. # Analysis : • The LA pressure and volume traces show cyclical changes corresponding to atrial filling, emptying, and relaxation. • The pressure-volume loop visually summarizes the dynamic relationship between LA pressure and volume, with distinct segments for passive and active phases. • The figure highlights the temporal coordination between atrial events and the ECG, emphasizing the mechanical and electrical coupling in the cardiac cycle.
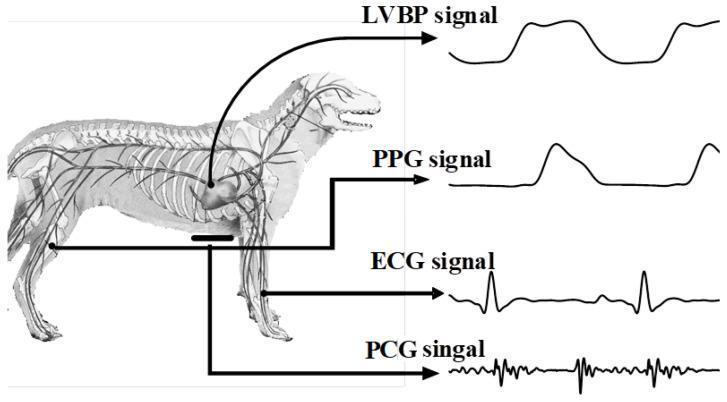
An educational anatomical and physiological diagram illustrating the synchronous collection of multiple cardiovascular biosignals in a canine model. The left side features a lateral-view anatomical illustration of a canine, highlighting the skeletal system, the heart, and major peripheral arteries. Four distinct biosignal waveforms are displayed on the right, with arrows tracing each to its anatomical point of acquisition: 1) LVBP (Left Ventricular Blood Pressure) signal, showing a rhythmic pressure waveform originating from the heart. 2) PPG (Photoplethysmogram) signal, a pulsatile volume waveform traced to the femoral artery. 3) ECG (Electrocardiogram) signal, showing characteristic P-QRS-T complexes with a prominent R-wave, traced to the forelimbs (Lead I configuration). 4) PCG (Phonocardiogram) signal, depicting high-frequency oscillations representing heart sounds, recorded from the cardiac apex. The diagram demonstrates the integration of invasive and non-invasive hemodynamic monitoring, useful for teaching comparative physiology and cardiovascular signal processing.
oxygen hemoglobin dissociation curve shift factors
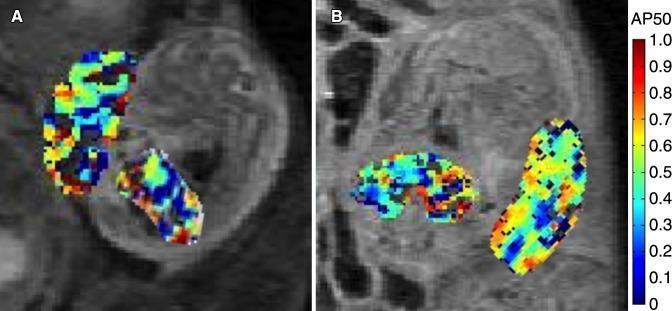
This diagnostic image set displays two functional MR images (A and B) showing maternal-fetal units in a mouse model at embryonic days 14.5 and 17.5. The images feature overlaid color-coded AP50 maps, which represent fetal and placental oxygen-hemoglobin dissociation parameters. In both panels, the placenta and fetal liver are isolated as regions of interest. A vertical color bar on the right side indicates AP50 values scaled from 0 to 1.0, with cool colors (dark blue) representing lower values and warm colors (red/orange) representing higher values. Panel A (day 14.5) demonstrates a heterogeneous distribution of oxygenation parameters within the tissues, showing a mix of green, yellow, and blue pixels. Panel B (day 17.5) illustrates the progression of these physiological markers over time, with the placental AP50 values showing a significant spatial shift toward warmer colors, reflecting changes in oxygen transfer efficiency. These maps provide a non-invasive visual method for studying fetal oxygenation and placental function during gestation.
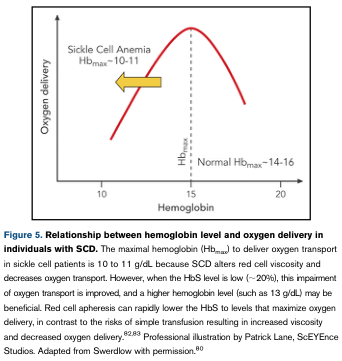
Summary : This figure illustrates the relationship between hemoglobin (Hb) level and oxygen delivery in individuals with sickle cell disease (SCD), highlighting the optimal Hb range for oxygen transport in SCD compared to normal individuals. line plot: # Title & Axes : • No explicit title on the plot, but the context is "Relationship between hemoglobin level and oxygen delivery in individuals with SCD." • X-axis: "Hemoglobin" (units not specified, but contextually g/dL). • Y-axis: "Oxygen delivery" (units not specified). • X-axis tick labels: 10, 15, 20. • Y-axis: No tick labels, only qualitative trend. # Data Points & Series : • Single red curve showing oxygen delivery as a function of hemoglobin level. • The curve rises from Hb = 10, peaks near Hb = 14–16, then declines toward Hb = 20. • Arrow and annotation for "Sickle Cell Anemia Hb_max ~10–11" indicating the optimal Hb range for SCD. • Dashed vertical line at "Normal Hb_max ~14–16" indicating the optimal Hb range for normal individuals. # Design Encodings : • Red solid line for the main curve. • Yellow arrow highlighting the SCD optimal Hb range. • Dashed vertical line for normal Hb_max. • Text annotations for "Sickle Cell Anemia Hb_max ~10–11" and "Normal Hb_max ~14–16". # Distribution & Trends : • The curve is unimodal, peaking at intermediate Hb levels. • Oxygen delivery increases with Hb up to a point, then decreases at higher Hb levels. • The optimal Hb for SCD is lower (~10–11 g/dL) than for normal individuals (~14–16 g/dL). # Analysis : • The figure visually demonstrates that the maximal oxygen delivery in SCD occurs at a lower hemoglobin level than in normal individuals, due to altered red cell viscosity and oxygen transport in SCD. • Increasing Hb above the SCD optimal range may decrease oxygen delivery, while lowering Hb to the optimal range can improve oxygen transport. • The curve supports clinical recommendations for transfusion targets in SCD patients to avoid excessive Hb levels that could impair oxygen delivery.
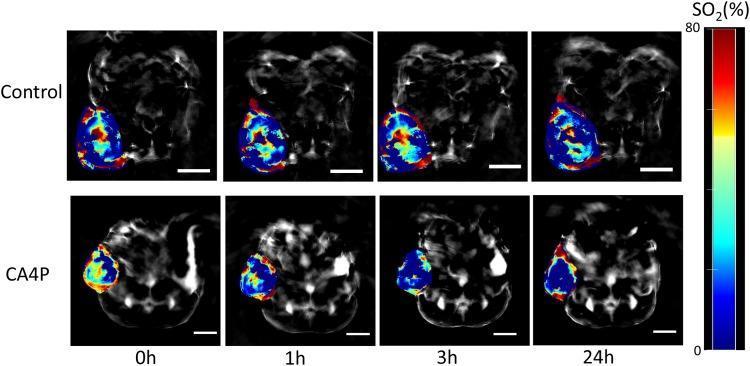
This composite diagnostic image displays Multispectral Optoacoustic Tomography (MSOT) scans of a lung xenograft tumor model in a mouse. The panel compares a control group (top row) with a CA4P-treated group (bottom row) at four time points: 0h, 1h, 3h, and 24h. The pseudocolor overlay represents hemoglobin oxygen saturation (%SO2) on a scale from 0% (dark blue/black) to 80% (bright red). Red indicates high oxyhemoglobin levels, while blue represents deoxyhemoglobin or blood-deficient areas. In the control group, the tumor exhibits persistent heterogeneous oxygenation (mixed red and blue) throughout the 24-hour period. In the CA4P group, the tumor undergoes a dramatic shift from high baseline oxygenation at 0h to a predominantly blue signal at 1h, 3h, and 24h. This visual transition demonstrates the pharmacodynamic effect of Combretastatin A-4 phosphate (CA4P) as a vascular disrupting agent (VDA), illustrating immediate and sustained vascular shutdown, resulting in acute tumor hypoxia and reduced perfusion. Scale bars represent 5 mm.
coagulation cascade intrinsic extrinsic pathway factors
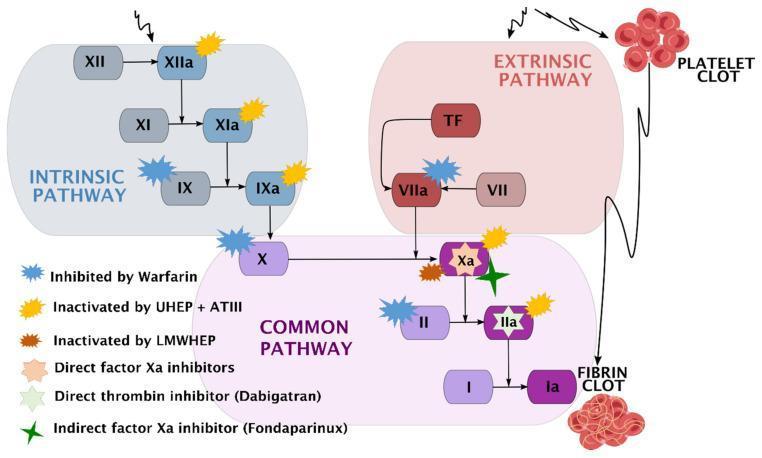
A comprehensive pathophysiology diagram illustrating the human coagulation cascade and the specific pharmacodynamic sites of action for various anticoagulants. The diagram is divided into three functional zones: the Intrinsic Pathway (blue), starting with Factor XII; the Extrinsic Pathway (red), initiated by Tissue Factor (TF) and Factor VII; and the Common Pathway (purple), where the pathways converge at Factor X. The cascade terminates in the conversion of Fibrinogen (I) to Fibrin (Ia), forming a fibrin clot. A secondary visual element depicts a platelet clot associated with the extrinsic pathway. Key clinical pharmacotherapeutic targets are marked with color-coded symbols: Warfarin inhibits Factors IX, VII, X, and II; Unfractionated Heparin (UHEP) + Antithrombin III (ATIII) inactivates Factors XIIa, XIa, IXa, Xa, and IIa; Low-Molecular-Weight Heparin (LMWHEP) and Fondaparinux target Factor Xa; Direct Factor Xa inhibitors act on Factor Xa; and Dabigatran acts as a direct thrombin inhibitor (Factor IIa). This schematic is designed for medical education regarding hemostasis and thromboprophylaxis.
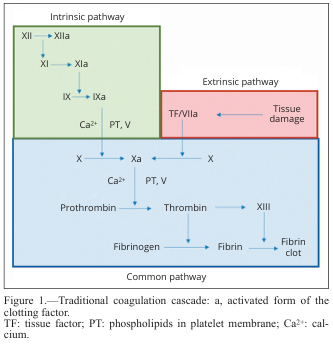
Summary : This diagram illustrates the traditional coagulation cascade, detailing the sequence of events and factors involved in blood clotting via the intrinsic, extrinsic, and common pathways. flowchart: # Pathways : • Intrinsic pathway (green box): Initiated by factor XII, proceeds through XI, IX, and VIII, with activation steps indicated by "a" (e.g., XIIa, XIa, IXa). • Extrinsic pathway (red box): Initiated by tissue damage, which activates tissue factor (TF) and factor VIIa. • Common pathway (blue box): Both intrinsic and extrinsic pathways converge at factor X, leading to the activation of prothrombin to thrombin, which then converts fibrinogen to fibrin, forming a fibrin clot. # Nodes : • XII → XIIa (Intrinsic) • XI → XIa (Intrinsic) • IX → IXa (Intrinsic) • Ca²⁺, PT, V (Intrinsic, Common) • TF/VIIa (Extrinsic) • Tissue damage (Extrinsic) • X → Xa (Common) • Prothrombin → Thrombin (Common) • Fibrinogen → Fibrin (Common) • XIII (Common) • Fibrin clot (Common) # Connectors : • Arrows indicate the direction of activation or conversion between factors. • Intrinsic and extrinsic pathways both feed into the activation of factor X in the common pathway. • Ca²⁺ and PT, V are required cofactors at specific steps. # Layout : • Three main colored sections: green (intrinsic, top left), red (extrinsic, top right), blue (common, bottom). • Flow proceeds from top (initiation) to bottom (clot formation). • Arrows show sequential activation and convergence of pathways. # Analysis : • The diagram clearly separates the intrinsic and extrinsic initiation mechanisms, both converging on the common pathway at factor X. • The cascade is highly sequential, with each activated factor catalyzing the next step. • Calcium ions (Ca²⁺) and phospholipids (PT) are essential cofactors at multiple steps. • The final outcome is the formation of a stable fibrin clot, highlighting the coordinated nature of the coagulation process.
ECG normal waves P QRS T leads
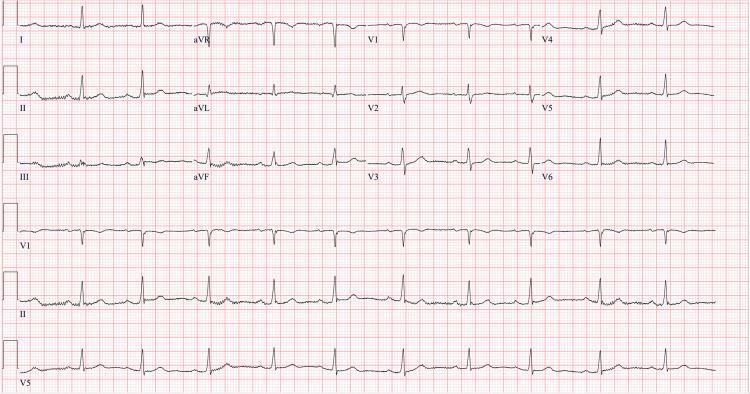
A standard 12-lead electrocardiogram (ECG) displayed on a red grid background, demonstrating a normal sinus rhythm at approximately 64 beats per minute. The tracing shows clearly visible, upright P waves preceding every QRS complex in leads I, II, and aVF, confirming sinus origin. The QRS complexes exhibit a normal duration and morphology with appropriate R-wave progression across the precordial leads (V1-V6). The ST segments are isoelectric throughout all leads, with no evidence of acute ST-elevation or depression. T waves are upright and symmetrical, appearing most prominent in leads V3 through V6. This diagnostic image represents the resolution of hyperkalemia-induced ECG changes (such as peaked T waves or bradyarrhythmias) following medical treatment and intracellular potassium shifting. The tracing is organized into four columns representing limb leads (I, II, III), augmented limb leads (aVR, aVL, aVF), and precordial leads (V1-V3, V4-V6), with rhythm strips for leads V1, II, and V5 provided at the bottom.
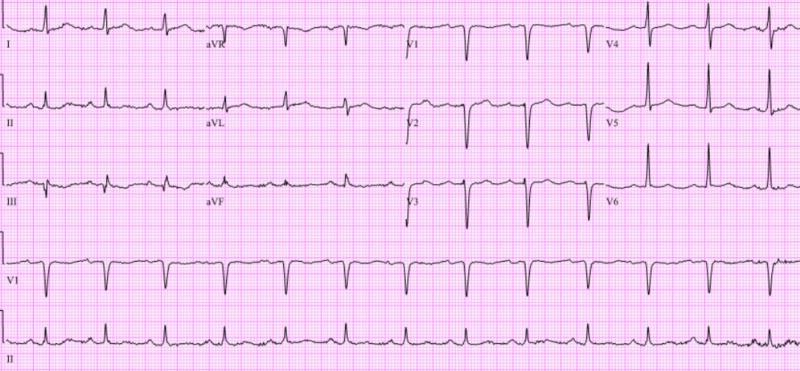
A standard twelve-lead electrocardiogram (ECG) printed on pink grid paper. The tracing displays a regular sinus rhythm with a visible P wave preceding every QRS complex. In the limb leads (I, II, III, aVR, aVL, aVF), the axis appears normal with upright T waves in leads I and II. The precordial leads (V1-V6) show a characteristic progression of QRS morphology; however, there is a notable presence of Q waves in leads V1, V2, and V3, which is consistent with an old or age-undetermined septal infarction. The R-wave progression is somewhat delayed. ST segments are generally isoelectric across most leads without evidence of acute ST-elevation myocardial infarction (STEMI) at this time. T waves are primarily upright and symmetric in the lateral precordial leads (V5-V6). The rhythm strip at the bottom (Lead II and V1) confirms a stable, regular rate and rhythm post-cardiac arrest. This diagnostic image serves as a baseline clinical tool for evaluating ischemic changes and conduction disturbances in patients with a history of cardiac events.
jaundice types bilirubin metabolism pathway
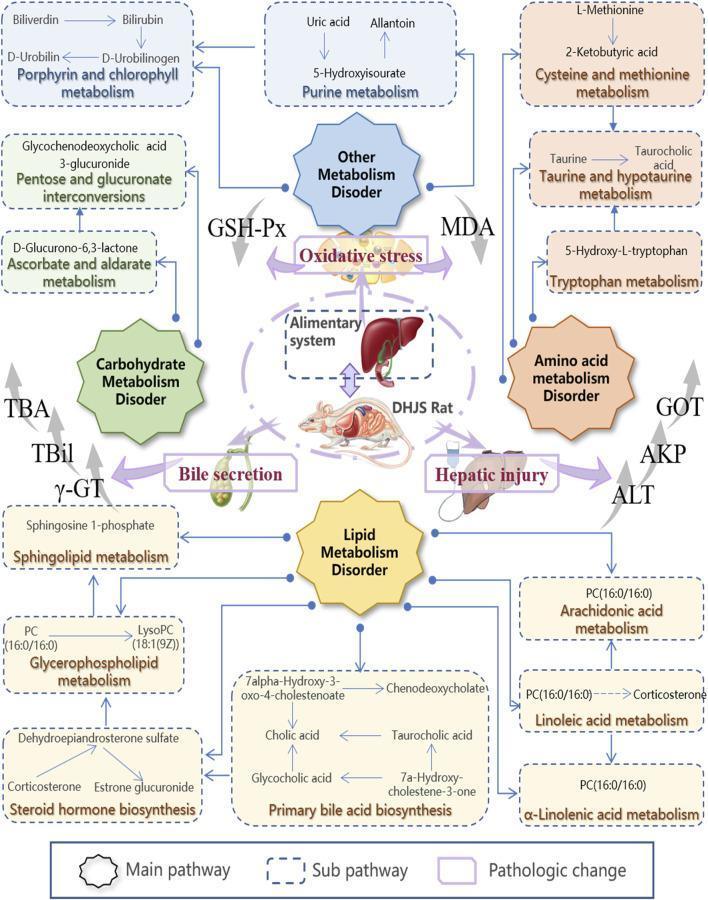
A metabolic network diagram illustrating the pathophysiological pathways of the Dampness-Heat Jaundice Syndrome (DHJS) model. The illustration is centered on a 'DHJS Rat' and the 'Alimentary system' (liver and gallbladder), with four octagonal 'Main pathway' boxes representing Carbohydrate, Lipid, Amino Acid, and Other Metabolism Disorders. Radiating from these nodes are numerous 'Sub-pathway' dashed boxes containing specific KEGG-based metabolic pathways, including Steroid Hormone Biosynthesis, Primary Bile Acid Biosynthesis, and Glycerophospholipid Metabolism. Key metabolites mentioned include bilirubin, cholic acid, corticosterone, and LysoPC. The diagram highlights 'Pathologic changes' such as Oxidative Stress and Hepatic Injury, indicated by thick purple arrows. Clinical biomarkers including TBil, TBA, ̳̳γ-GT, ALT, and MDA are shown with upward gray arrows, signifying elevation in the diseased state. This integrative map demonstrates the complex biochemical dysregulation across multiple systems associated with hepatic injury and bile secretion disorders.
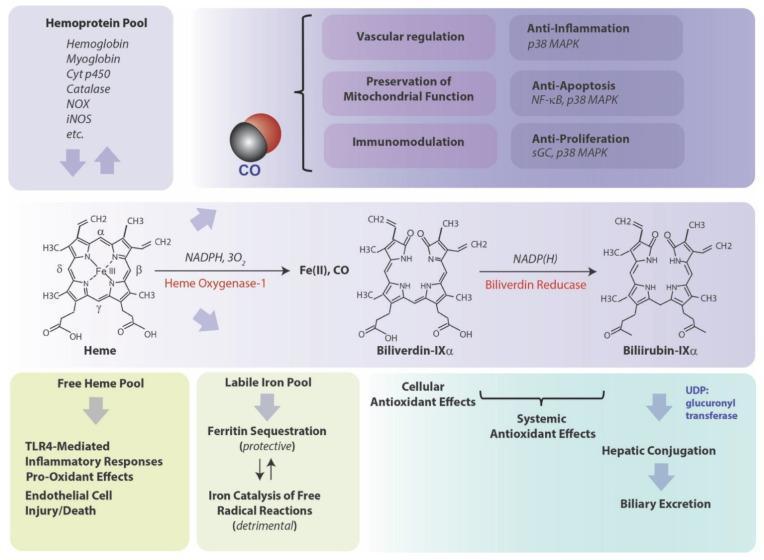
A detailed pathophysiology diagram illustrating the metabolic pathway of heme degradation and its systemic physiological implications. The central panel displays the biochemical conversion of Heme to Biliverdin-IXα by the rate-limiting enzyme Heme Oxygenase-1 (requiring NADPH and 3O2), which releases carbon monoxide (CO) and ferrous iron (Fe II). Subsequently, Biliverdin-IXα is reduced to Bilirubin-IXα by Biliverdin Reductase using NADP(H). The diagram maps the downstream outcomes of these byproducts: CO is linked to vascular regulation, mitochondrial preservation, and immunomodulation through signaling molecules like p38 MAPK, NF-κB, and sGC. The 'Labile Iron Pool' is shown bifurcating into protective Ferritin sequestration or detrimental free radical catalysis. Bilirubin is associated with cellular and systemic antioxidant effects before undergoing hepatic conjugation via UDP-glucuronyl transferase for biliary excretion. Additionally, a 'Free Heme Pool' is noted for its role in TLR4-mediated inflammatory responses and endothelial injury. This clinical illustration serves as a comprehensive guide for medical students and researchers studying oxidative stress, heme metabolism, and cytoprotective mechanisms.
Complete Physiology Notes: 23 High-Yield Topics
CARDIOVASCULAR SYSTEM
1. Blood Pressure Regulation & Shock
- Baroreceptor reflex (most important): Stretch receptors in the carotid sinus and aortic arch detect pressure changes. A fall in BP → decreased baroreceptor firing → increased sympathetic output + decreased parasympathetic output → increased HR, contractility, vasoconstriction → BP restored.
- Chemoreceptor reflex: Peripheral (carotid/aortic bodies) respond to low PO₂, high PCO₂, low pH. Central chemoreceptors respond to CO₂/H⁺ in CSF. Both cause reflex increase in BP.
- CNS ischemic response (Cushing reflex): When cerebral perfusion falls critically, intense sympathetic discharge causes extreme hypertension + bradycardia (widened pulse pressure) - a last-ditch emergency response.
- Renin-Angiotensin-Aldosterone System (RAAS): Low BP → renin (from JGA) → Angiotensin I → ACE → Ang II → vasoconstriction + aldosterone → Na⁺/H₂O retention → volume expansion.
- ADH (Vasopressin): Released from posterior pituitary when plasma osmolarity rises or BP falls → water reabsorption in collecting duct.
- Atrial Natriuretic Peptide (ANP): Released by atria when stretched → promotes Na⁺ excretion, reduces volume.
| Type | Mechanism | Example | Key Feature |
|---|---|---|---|
| Hypovolemic | ↓ preload (blood/fluid loss) | Hemorrhage, burns | ↑ TPR, ↓ CO |
| Cardiogenic | Pump failure | MI, tamponade | ↑ TPR, ↓ CO, ↑ CVP |
| Distributive | Vasodilation/maldistribution | Septic, anaphylactic, neurogenic | ↓ TPR, warm skin |
| Obstructive | Obstruction to flow | Pulmonary embolism, tension pneumothorax | ↑ TPR, ↓ CO |
- Class I: <750 mL, <15% blood volume - compensated
- Class II: 750-1500 mL, tachycardia, anxiety
- Class III: 1500-2000 mL, confusion, hypotension
- Class IV: >2000 mL, lethargy, life-threatening
2. Cardiac Output: Regulation & Measurement
- Normal: ~5 L/min (70 mL × 72 bpm)
- Cardiac Index = CO ÷ Body Surface Area = 2.5-4.0 L/min/m²
- Ejection Fraction (EF) = SV ÷ End-Diastolic Volume (EDV) × 100 = normally 55-70%
-
Preload (end-diastolic volume/filling pressure): ↑ venous return → ↑ EDV → ↑ SV (Frank-Starling law). The greater the myocardial fiber stretch at end-diastole, the greater the force of contraction and SV ejected.
-
Afterload (aortic pressure / TPR): ↑ afterload → more energy spent in isovolumetric contraction → ↓ SV, ↑ end-systolic volume. Chronic afterload increase (hypertension) → concentric hypertrophy.
-
Contractility (inotropy): The intrinsic ability of the myocardium to develop force at a given preload/afterload.
- Positive inotropes: catecholamines (β₁), digoxin, Ca²⁺, increased HR (Bowditch staircase/treppe)
- Negative inotropes: hypoxia, acidosis, heart failure, β-blockers, most anesthetic agents
-
Fick Principle (gold standard): CO = O₂ consumption ÷ (arterial O₂ content - venous O₂ content). Requires pulmonary artery catheter.
-
Thermodilution (most common clinically): Cold saline injected into right atrium; thermistor in pulmonary artery measures temperature change. CO calculated from Stewart-Hamilton equation.
-
Echocardiography (Doppler): Non-invasive; measures velocity of flow × cross-sectional area of aorta.
-
Indicator dilution (dye dilution): Indocyanine green injected; concentration-time curve analyzed.
3. ECG: Normal Waves, Leads, and Blocks
- P wave: Atrial depolarization (SA node → atria). Duration <0.12s, amplitude <0.25 mV in lead II.
- PR interval: AV nodal delay (time from atrial to ventricular depolarization). Normal 0.12-0.20s.
- QRS complex: Ventricular depolarization. Duration <0.12s (narrow). Q = initial septal depolarization (left→right); R = main ventricular depolarization; S = basal depolarization.
- ST segment: Ventricular plateau phase (no net current). Should be isoelectric. Elevation = injury (STEMI); depression = ischemia.
- T wave: Ventricular repolarization. Normally concordant with QRS. Peaked/tall T = hyperkalemia, early ischemia.
- QT interval: Total ventricular electrical systole. Corrected QTc = QT ÷ √RR. Prolonged QTc (>440ms men, >460ms women) → risk of torsades de pointes.
- Standard bipolar: I (left arm - right arm), II (left leg - right arm), III (left leg - left arm) → Einthoven's triangle
- Augmented unipolar: aVR (right arm), aVL (left arm), aVF (left foot)
- V1-V2: Right ventricle/septum (V1 over 4th ICS, right sternal border)
- V3-V4: Anterior wall
- V5-V6: Lateral wall
| Block | PR Interval | QRS | Clinical |
|---|---|---|---|
| 1st degree AV | >0.20s, constant | Normal | Benign, no treatment |
| 2nd degree Mobitz I (Wenckebach) | Progressive prolongation then dropped beat | Normal | AV node disease, generally benign |
| 2nd degree Mobitz II | Constant PR, sudden dropped beat | Often wide | His-Purkinje disease, may need pacemaker |
| 3rd degree (complete) | No relationship P-QRS | Wide escape rhythm | Complete AV dissociation, pacemaker required |
| RBBB | Normal PR | Wide QRS, rSR' in V1 ("rabbit ears"), wide S in I, V6 | Right bundle lesion |
| LBBB | Normal PR | Wide QRS, broad R in I/V6, deep S in V1 | Left bundle lesion; makes ECG uninterpretable for ischemia |
4. Cardiac Cycle & Heart Sounds
-
Isovolumetric Contraction: Mitral valve closes (S1), aortic valve still closed. Pressure rises rapidly with no change in volume. Starts at end of QRS.
-
Rapid Ejection: LV pressure exceeds aortic pressure → aortic valve opens → blood ejected rapidly. ~70% of SV ejected.
-
Reduced Ejection: Slower ejection as pressure begins to equalize.
-
Isovolumetric Relaxation: Aortic valve closes (S2), mitral still closed. Pressure falls rapidly with no volume change. Represents end-systole.
-
Rapid Ventricular Filling: LV pressure falls below LA pressure → mitral valve opens → rapid passive filling (~75% of total filling). S3 (if present) occurs here - normal in children/athletes, pathological if heard in adults (indicates poor compliance/CHF).
-
Reduced Filling (Diastasis): Slow passive filling phase.
-
Atrial Contraction ("Atrial Kick"): Contributes last 25% of filling. S4 occurs here if atrium contracts against a stiff/non-compliant ventricle (e.g., hypertensive heart disease, hypertrophic CMP).
- Aorta: 120/80 mmHg
- LV systole/diastole: ~120/8 mmHg
- LA: 5-12 mmHg (mean ~8)
- RV: 25/5 mmHg
- PA: 25/10 mmHg (mean ~15)
- S1 (lub): Closure of mitral (M1) and tricuspid (T1) valves at onset of systole. M1 precedes T1. Loud in mitral stenosis, soft in mitral regurgitation.
- S2 (dub): Closure of aortic (A2) and pulmonic (P2) valves at end of systole. A2 precedes P2. Physiological splitting: A2-P2 gap widens on inspiration (RV fills more, delayed P2). Fixed splitting = ASD. Paradoxical splitting (P2 before A2) = LBBB, severe AS.
- S3 (ventricular gallop): Early diastole during rapid filling. Pathological in adults → LV failure, dilated CMP.
- S4 (atrial gallop): Late diastole during atrial contraction against stiff ventricle. → LVH, aortic stenosis, hypertensive heart disease.
RESPIRATORY SYSTEM
5. Hypoxia: Types & Distinguishing Features
| Type | PaO₂ | SaO₂ | CaO₂ | A-a gradient | Description | Example |
|---|---|---|---|---|---|---|
| Hypoxic hypoxia | ↓ | ↓ | ↓ | Normal or ↑ | Low O₂ in blood due to low PaO₂ | High altitude, hypoventilation, V/Q mismatch, diffusion defect |
| Anemic hypoxia | Normal | Normal | ↓ | Normal | Reduced Hb to carry O₂ | Anemia, CO poisoning (Hb saturated but can't release O₂) |
| Stagnant (circulatory) hypoxia | Normal | Normal | Normal | Normal | Poor perfusion/delivery | Heart failure, shock, local ischemia |
| Histotoxic hypoxia | Normal | Normal | Normal | Normal | Cells cannot use O₂ | Cyanide poisoning (blocks cytochrome c oxidase) |
- CO poisoning (type of anemic hypoxia): PaO₂ normal, but pulse oximeter reads falsely normal. Cherry-red skin. Carboxyhemoglobin (COHb) measured only by co-oximetry.
- Cyanide (histotoxic): Venous PO₂ is HIGH (tissues can't extract O₂), no cyanosis.
- Hypoxic hypoxia: responsive to supplemental O₂ (except shunt, which doesn't respond well).
- Cyanosis appears when deoxyhemoglobin >5 g/dL in capillaries.
6. Surfactant & Respiratory Distress Syndrome
- Produced by Type II pneumocytes (also called great alveolar cells or granular pneumocytes)
- Composition: ~80% phospholipids (predominantly dipalmitoylphosphatidylcholine, DPPC), 10% proteins (SP-A, SP-B, SP-C, SP-D), 10% neutral lipids
- SP-B and SP-C: critical for surface tension lowering
- SP-A and SP-D: immune defense (opsonization)
- Cause: Deficiency of surfactant in premature neonates
- Mechanism: Low surfactant → high surface tension → alveolar collapse (atelectasis) → diffuse microatelectasis → V/Q mismatch → hypoxia → pulmonary vasoconstriction → plasma leaks into alveoli → hyaline membrane formation (fibrin + plasma proteins)
- Features: Presents within hours of birth; tachypnea, grunting, nasal flaring, intercostal retractions, cyanosis
- CXR: "Ground glass" opacity, air bronchograms, reticulogranular pattern
- Treatment: Antenatal corticosteroids (betamethasone), exogenous surfactant replacement (beractant, poractant), CPAP/mechanical ventilation, O₂
7. O₂-Hb Dissociation Curve & Shift Factors
- P₅₀ = PO₂ at which Hb is 50% saturated. Normal = ~26 mmHg.
- Arterial blood: PO₂ ~100 mmHg → ~97-98% saturation
- Mixed venous blood: PO₂ ~40 mmHg → ~75% saturation
- Physiological significance: At the flat upper part, large changes in PO₂ produce minimal change in saturation (protects loading). At the steep middle section, small falls in PO₂ cause large O₂ unloading (facilitates tissue delivery).
- ↑ PCO₂
- ↓ pH (acidosis)
- ↑ Temperature
- ↑ 2,3-DPG (2,3-bisphosphoglycerate - binds β-chains, stabilizes deoxy form)
- Occurs at tissues (high CO₂, low pH) - adaptive: promotes O₂ unloading where needed
- ↓ PCO₂
- ↑ pH (alkalosis)
- ↓ Temperature
- ↓ 2,3-DPG
- Fetal Hb (HbF) has γ-chains instead of β-chains; γ-chains bind 2,3-DPG poorly → HbF has higher O₂ affinity than HbA → facilitates O₂ transfer from maternal to fetal blood
- CO poisoning (COHb shifts curve left AND reduces Hb available)
8. Neural & Chemical Regulation of Respiration
- Pre-Bötzinger complex (ventral respiratory group, VRG): Respiratory rhythm generator - generates automatic breathing rhythm. Contains inspiratory and expiratory neurons.
- Dorsal respiratory group (DRG): Integrates sensory input; drives inspiration.
- Ventral respiratory group (VRG): Active expiration and high-demand breathing.
- Pneumotaxic center (pontine respiratory group): Limits inspiration, promotes switch to expiration. Lesion → apneusis.
- Apneustic center: Prolongs inspiration. Normally inhibited by pneumotaxic center.
- Respond to PCO₂/H⁺ in CSF (CO₂ crosses BBB freely, forms H⁺ locally)
- Most important in day-to-day regulation
- Do NOT respond directly to O₂
- Respond primarily to PaO₂ (<60 mmHg stimulates strongly - hypoxic drive)
- Also respond to ↑PCO₂, ↓pH (synergistic with central)
- In COPD patients with chronic hypercapnia: central chemoreceptors adapt → hypoxic drive becomes dominant ("hypoxic drive" - be cautious with high-flow O₂)
- Hering-Breuer reflex: Pulmonary stretch receptors (slowly adapting) → when lungs inflate → inhibit inspiration (via vagus). Prevents over-inflation. Important in infants.
- J receptors (juxtacapillary receptors): In alveolar walls, stimulated by pulmonary congestion/edema → rapid shallow breathing, dyspnea.
- Irritant receptors (rapidly adapting): Bronchoconstriction, hyperpnea with irritants, cough.
9. Acclimatization at High Altitude
- ↑ Ventilation (hypoxic stimulation of peripheral chemoreceptors) → respiratory alkalosis (↓PCO₂)
- ↑ HR and CO (sympathetic stimulation)
- Renal compensation: Kidneys excrete HCO₃⁻ to compensate respiratory alkalosis → pH normalizes → removes alkalotic braking on ventilation → ventilation increases further (most important step in acclimatization)
- ↑ 2,3-DPG in RBCs → rightward shift of O₂-Hb curve → facilitates O₂ unloading at tissues
- ↑ Erythropoietin (EPO) from peritubular cells of kidney (in response to hypoxia via HIF-1α) → ↑ erythropoiesis → ↑ Hb and hematocrit → ↑ O₂ carrying capacity (polycythemia)
- ↑ Pulmonary vascular resistance (hypoxic vasoconstriction is generalized at altitude) → RVH in some
- ↑ Capillary density in muscles
- ↑ Mitochondrial density and oxidative enzyme activity
- Shift in Hb back to near normal (2,3-DPG effect partially offset by increased HbF synthesis)
RENAL SYSTEM
10. Counter-Current Mechanism
- Descending limb (thin): Permeable to water, impermeable to solutes → water leaves by osmosis into the hypertonic medulla → tubular fluid becomes concentrated.
- Ascending limb (thick): Impermeable to water, actively transports NaCl out → tubular fluid becomes dilute (hypotonic ~100 mOsm at macula densa).
11. GFR & Its Regulation
- Net filtration pressure = (PGC - PBS) - (πGC - πBS)
- PGC = glomerular capillary hydrostatic pressure (~60 mmHg) → favors filtration
- PBS = Bowman space hydrostatic pressure (~15 mmHg) → opposes filtration
- πGC = glomerular capillary oncotic pressure (~28 mmHg) → opposes filtration
- πBS = Bowman space oncotic pressure (~0 mmHg) → favors filtration
- Net = 60 - 15 - 28 = ~17 mmHg favoring filtration
-
Renal autoregulation (intrinsic, works between MAP 80-180 mmHg):
- Myogenic mechanism: ↑ BP → stretch → afferent arteriole contracts → maintains GFR
- Tubuloglomerular feedback (TGF): ↑ NaCl delivery to macula densa → ATP/adenosine released → afferent arteriole constricts → ↓ GFR (negative feedback)
-
Sympathetic nervous system: Renal vasoconstriction → ↓ GFR (shock, exercise, pain)
-
RAAS: Ang II → constricts efferent arteriole preferentially → maintains GFR when renal perfusion falls (ACE inhibitors block this → drop in GFR in renal artery stenosis)
-
Prostaglandins (PGE₂, PGI₂): Dilate afferent arteriole → maintain GFR when vasoconstricted. NSAIDs block this → ↓ GFR in volume-depleted patients.
-
ANP: Dilates afferent, constricts efferent → ↑ GFR.
12. Juxtaglomerular Apparatus (JGA)
-
Juxtaglomerular (granular) cells: Modified smooth muscle cells in the wall of the afferent arteriole. Contain secretory granules of renin. Mechanoreceptors: ↓ renal arterial pressure → renin release. Also receive sympathetic input (β₁ → renin release).
-
Macula densa: Specialized epithelial cells at the end of the thick ascending limb of the loop of Henle. Act as chemoreceptors: detect NaCl concentration in tubular fluid. ↓ NaCl delivery → stimulates renin release from granular cells (via prostaglandins, NO). Also mediate TGF.
-
Extraglomerular mesangial cells (Lacis cells): Between the arterioles and macula densa; communication and structural support; may relay signals.
- ↓ Renal perfusion pressure (mechanical stretch of granular cells)
- ↓ NaCl at macula densa
- ↑ Sympathetic tone (β₁ adrenergic)
- ↑ BP, ↑ NaCl delivery
- Ang II (negative feedback)
- ADH
13. Micturition Reflex
- Sympathetic (T10-L2, hypogastric nerve): Relaxes detrusor (β₃) + contracts internal sphincter (α₁). Allows storage.
- Somatic (pudendal nerve, S2-4): Voluntarily contracts external sphincter. Storage.
- Sensory: As bladder fills (~150 mL first urge; ~400-500 mL strong urge), stretch receptors activate afferent signals (pelvic nerve → S2-S4).
- Bladder fills → stretch receptors in detrusor → afferent via pelvic nerve → spinal cord (S2-S4).
- If socially appropriate: signal relayed to pontine micturition center (PMC, Barrington's nucleus) → descending pathway activates:
- Parasympathetic (pelvic nerve, S2-4): Contracts detrusor (M3 receptors)
- Relaxes internal sphincter
- Inhibition of pudendal nerve → external sphincter relaxes
- Voiding occurs. Once started, voiding reinforced by additional stretch receptor activity (positive feedback until bladder empty).
- PMC (pons): Coordinates sphincter relaxation with detrusor contraction (synergic voiding)
- Periaqueductal gray (PAG): Relays bladder fullness to cortex
- Frontal cortex: Voluntary suppression or initiation
14. Renal Clearance: Inulin & Creatinine
- Inulin is freely filtered, not secreted, not reabsorbed, not metabolized
- Clearance = GFR = ~125 mL/min
- If C > 125 → substance is secreted (e.g., PAH, creatinine)
- If C < 125 → substance is reabsorbed (e.g., glucose, urea, Na⁺)
- Freely filtered + small amount tubular secretion → slightly overestimates GFR (~10-20%)
- Used clinically because endogenous (no infusion needed)
- Formula: CrCl = (U_Cr × V) ÷ P_Cr ≈ 125-130 mL/min
- Cockcroft-Gault formula: Estimates GFR from serum creatinine, age, weight, sex
- CKD-EPI / MDRD equations: More accurate estimation of eGFR in clinical practice
- Filtered + maximally secreted → all PAH extracted in one pass (if plasma level low)
- PAH clearance (~625 mL/min) = Effective Renal Plasma Flow (ERPF)
- Renal Blood Flow (RBF) = RPF ÷ (1 - hematocrit) ≈ 1200 mL/min
- Filtration fraction = GFR ÷ RPF = 125/625 = 0.20 (20%)
| Substance | Filtered | Secreted | Reabsorbed | Clearance vs GFR |
|---|---|---|---|---|
| Inulin | Yes | No | No | = GFR (125) |
| Glucose (normal) | Yes | No | Completely | = 0 |
| Urea | Yes | No | ~50% | < GFR (~70) |
| Creatinine | Yes | Small | No | > GFR (~130) |
| PAH | Yes | Yes | No | >> GFR (~625) |
GASTROINTESTINAL SYSTEM
15. Jaundice: Types & Pathophysiology
- Heme (from RBC breakdown, 80%) → biliverdin → unconjugated (indirect) bilirubin (lipid-soluble, bound to albumin)
- Liver: bilirubin taken up, conjugated with glucuronic acid by UDP-glucuronosyltransferase (UGT) → conjugated (direct) bilirubin (water-soluble)
- Secreted in bile → intestine → bacteria convert to urobilinogen → some absorbed (enterohepatic circulation) → urobilin in urine; rest → stercobilin (brown stool color)
| Feature | Pre-hepatic (Hemolytic) | Hepatic (Hepatocellular) | Post-hepatic (Obstructive) |
|---|---|---|---|
| Cause | Excess RBC breakdown | Liver cell damage | Bile duct obstruction |
| Examples | G6PD deficiency, sickle cell, ABO incompatibility | Viral hepatitis, cirrhosis, drug-induced | Gallstones, cholangiocarcinoma, pancreatic head cancer |
| Bilirubin type | ↑↑ Unconjugated | ↑ Both (predominantly conjugated) | ↑↑ Conjugated |
| Urine bilirubin | Absent (unconjugated doesn't pass glomerulus) | Present | Present (bilirubinuria - "tea-colored urine") |
| Urobilinogen | ↑↑ (excess production) | ↓ or absent | Absent (no bile in intestine) |
| Stool color | Normal/dark | Pale | Pale/clay-colored (acholic) |
| AST/ALT | Normal | ↑↑ | Normal or mildly ↑ |
| ALP/GGT | Normal | ↑ | ↑↑ |
| PT | Normal | Prolonged (liver can't synthesize factors) | Prolonged (corrects with Vit K - fat malabsorption) |
| Pruritus | Absent | Variable | Severe (bile salts deposited in skin) |
- Appears day 2-3, resolves by day 7-10 (term)
- Due to: immature UGT, ↑ RBC breakdown (fetal → adult Hb transition), increased enterohepatic circulation
- Pathological if: <24h, >15 mg/dL, direct bilirubin >2 mg/dL, persists >2 weeks
- Treatment: Phototherapy (blue light 460 nm converts unconjugated bilirubin to water-soluble isomers → excreted in urine/bile without conjugation)
16. Coagulation Cascade & Hemophilia
- Tissue factor (TF) exposed at injury site → binds Factor VII → TF-VIIa complex → activates Factor X (and IX)
- Rapid but limited (inhibited by TFPI)
- PT (prothrombin time) tests this pathway (factors VII, X, V, II, fibrinogen)
- Factor XII + contact activation → XIIa → XIa → IXa + VIIIa → activates Factor X
- PTT (partial thromboplastin time) tests this pathway (factors XII, XI, IX, VIII, X, V, II, fibrinogen)
- Factor Xa + Va (on phospholipid surface + Ca²⁺) = prothrombinase complex → Prothrombin (II) → Thrombin (IIa)
- Thrombin:
- Fibrinogen → fibrin monomer → polymerizes
- Factor XIII → XIIIa → cross-links fibrin (stable clot)
- Activates V, VIII (positive feedback)
- Activates Protein C (anticoagulant)
- Activates platelets
- Antithrombin III (ATIII): Inhibits thrombin and Xa (potentiated 1000x by heparin)
- Protein C + Protein S: Vitamin K-dependent; degrade Va and VIIIa (thrombomodulin + thrombin complex activates Protein C)
- TFPI: Inhibits TF-VIIa and Xa
- Prostacyclin (PGI₂) + NO from endothelium: Inhibit platelet aggregation
| Feature | Hemophilia A | Hemophilia B | Hemophilia C |
|---|---|---|---|
| Deficient factor | VIII | IX | XI |
| Inheritance | X-linked recessive | X-linked recessive | Autosomal recessive |
| Prevalence | 1:5,000-10,000 males | 1:30,000 males | Rare |
| Lab: PT | Normal | Normal | Normal |
| Lab: PTT | Prolonged ↑↑ | Prolonged ↑↑ | Prolonged ↑ |
| Treatment | Factor VIII concentrate / recombinant FVIII / DDAVP (mild) | Factor IX concentrate | FFP / Factor XI |
| Clinical | Hemarthrosis (joints), deep tissue bleeds, spontaneous bleeding | Same as A | Mild, after surgery/trauma |
- Deficiency/dysfunction of vWF (carries FVIII, mediates platelet adhesion to collagen)
- Mucocutaneous bleeding (epistaxis, menorrhagia)
- Prolonged bleeding time, ↑ PTT (FVIII reduced), normal PT
- Treated with DDAVP (desmopressin) - releases vWF from endothelium
17. Blood Groups & Mismatched Transfusion
| Blood Group | Antigen on RBC | Antibody in Plasma | Can donate to | Can receive from |
|---|---|---|---|---|
| A | A | Anti-B | A, AB | A, O |
| B | B | Anti-A | B, AB | B, O |
| AB | A and B | None (universal recipient) | AB only | All groups |
| O | None | Anti-A and Anti-B (universal donor for pRBCs) | All groups | O only |
- Rh(D) antigen most clinically significant
- Rh+: has D antigen (85% of population). Rh-: no D antigen.
- Rh- individuals do NOT have anti-D antibodies naturally; they must be sensitized (exposure to Rh+ blood)
- After sensitization: IgG anti-D produced → can cross placenta
- Rh- mother + Rh+ father → Rh+ fetus
- First pregnancy: sensitization (small feto-maternal hemorrhage at delivery). No disease.
- Second pregnancy: Memory B cells → rapid IgG anti-D production → crosses placenta → hemolysis of fetal RBCs → fetal anemia, hydrops fetalis, kernicterus
- Prevention: Anti-D immunoglobulin (RhoGAM) given to Rh- mother at 28 weeks and within 72h of delivery → destroys fetal RBCs before sensitization can occur
- Fever, chills, back/flank pain (most common early symptoms)
- Hemoglobinuria (dark urine), jaundice
- Hypotension, DIC, acute renal failure (hemoglobin precipitates in tubules)
- Immediate management: Stop transfusion, IV fluids, monitor urine output, check labs (direct Coombs, LDH, haptoglobin, bilirubin)
18. Immunity: T/B Cells & Applied
- Mature in bone marrow, express surface immunoglobulin (BCR = IgM or IgD)
- Antigen binding → proliferation → differentiation into:
- Plasma cells: Secrete antibodies (IgM, IgG, IgA, IgE, IgD)
- Memory B cells: Rapid response to re-exposure
- T-dependent antigens: Require T helper cell (CD4+) cooperation → isotype switching, affinity maturation (in germinal centers)
- T-independent antigens (polysaccharides): Direct B cell activation; mainly IgM, poor memory (reason why polysaccharide vaccines poorly immunogenic in <2 years)
- IgM: First produced in primary response; pentameric; good complement activator; ABO blood group antibodies
- IgG: Most abundant; crosses placenta; secondary response; opsonization; most versatile
- IgA: Secretory (dimer in secretions via J chain); mucosal immunity (tears, saliva, breast milk, GI/respiratory mucosa)
- IgE: Binds mast cells/basophils; type I hypersensitivity (allergy), anti-parasitic
- IgD: On naive B cell surface; role unclear
- Mature in thymus (positive selection on MHC, negative selection to remove self-reactive)
- Require antigen presented with MHC (two signals needed to avoid anergy)
- Th1: IL-12 induced; secrete IFN-γ, IL-2 → activate macrophages → intracellular pathogens (TB, fungi), delayed hypersensitivity (Type IV)
- Th2: IL-4 induced; secrete IL-4, IL-5, IL-13 → B cell class switching to IgE, eosinophil activation → allergy, parasites
- Th17: IL-6 + TGF-β; secrete IL-17 → neutrophil recruitment → extracellular bacteria/fungi
- T regulatory (Treg): IL-10, TGF-β → suppress immune responses → prevent autoimmunity
- Kill virus-infected cells and tumor cells via perforin/granzymes and Fas-FasL pathway
- Require CD4+ help for full activation (CD40L-CD40 interaction)
- DiGeorge syndrome: Thymic aplasia → no T cells → recurrent infections, hypocalcemia (parathyroid aplasia), cardiac defects. 22q11 deletion.
- Bruton's agammaglobulinemia: X-linked; Btk gene mutation → no mature B cells; recurrent bacterial infections after 6 months.
- SCID (Severe Combined Immunodeficiency): No T or B cells; ADA deficiency (most common AR form), RAG mutations. Presents with PCP, candidiasis, recurrent infections.
- HIV: Destroys CD4+ T cells → falls <200/μL → AIDS → opportunistic infections.
- MHC restriction: T cells only recognize peptide in context of self-MHC (discovered by Zinkernagel and Doherty).
19. Erythropoiesis
- Fetus: Yolk sac (0-2 months) → Liver/Spleen (2-7 months) → Bone marrow (5-9 months)
- Birth to 5 years: All bones
- Adults: Red marrow of axial skeleton (sternum, vertebrae, ribs, pelvis) + proximal long bone epiphyses
- Extramedullary hematopoiesis (liver, spleen) resumes in pathological states (myelofibrosis, thalassemia)
- Reticulocyte: Stains with brilliant cresyl blue (residual RNA). Normal 1-2% of RBCs. Elevated in hemolysis or response to treatment = good bone marrow response.
- Maturation time: ~5 days in marrow, 1-2 days as reticulocyte in blood.
- Erythropoietin (EPO): Produced by peritubular interstitial cells (fibroblasts) of renal cortex (>90%); small amount by liver. Stimulated by hypoxia (via HIF-1α). Acts on CFU-E → promotes proliferation, differentiation, inhibits apoptosis.
- Iron: Essential for heme synthesis. Absorbed as Fe²⁺ (ferrous) in duodenum (facilitated by vitamin C, decreased by tea/phytates). Transported by transferrin, stored as ferritin (or hemosiderin).
- Vitamin B12 (cobalamin): Essential for DNA synthesis (thymidine synthesis via folate pathway). Absorbed in terminal ileum with intrinsic factor (IF) from gastric parietal cells.
- Folic acid: Essential for purine and thymidine synthesis. Absorbed in jejunum.
- Embryo: Hb Gower (ζ₂ε₂), Portland (ζ₂γ₂)
- Fetus: HbF (α₂γ₂) - high O₂ affinity
- Adult: HbA (α₂β₂) - 97%; HbA₂ (α₂δ₂) - 2.5%; HbF <1%
20. Gastric HCl Secretion & Peptic Ulcer
- Acetylcholine (ACh) (vagal, M₃ receptors) → ↑ intracellular Ca²⁺ → H⁺-K⁺-ATPase activation
- Gastrin (from G cells of antrum/duodenum, via blood, CCK₂ receptors) → ↑ Ca²⁺ → H⁺-K⁺-ATPase
- Histamine (from ECL cells via paracrine, H₂ receptors) → ↑ cAMP → PKA → H⁺-K⁺-ATPase
- Cephalic phase (~30% of total): Sight, smell, taste, thought of food → vagal stimulation → ACh → gastric acid and pepsinogen
- Gastric phase (~60% of total): Food enters stomach → gastric distension → antral G cell stimulation → gastrin → acid secretion
- Intestinal phase (~10%): Initial stimulation by entry of food into duodenum, then inhibition by secretin, CCK, GIP (when acid enters duodenum)
- Imbalance between aggressive factors (acid, pepsin, H. pylori, NSAIDs) and defensive factors (mucus-bicarbonate layer, prostaglandins, mucosal blood flow, tight junctions)
- H. pylori: Gram-negative spiral bacillus. Urease produces NH₃ → neutralizes local acid → survives. VacA toxin + CagA → mucosal damage, inflammation. Found in 90% of duodenal ulcers, 70% of gastric ulcers.
- NSAIDs: Inhibit COX-1 → ↓ PGE₂ and PGI₂ → ↓ mucus/HCO₃⁻ secretion, ↓ mucosal blood flow, ↑ acid secretion
- Duodenal ulcer (DU): Excess acid; associated with H. pylori, blood group O; pain relieved by food
- Gastric ulcer (GU): Mucosal barrier defect; pain worsened by food; must biopsy to rule out malignancy
- Treatment: PPI + clarithromycin + amoxicillin (triple therapy for H. pylori); sucralfate; misoprostol (PGE₁ analogue for NSAID prophylaxis)
21. Pancreatic Juice: Composition & Regulation
- Volume: ~1-2 L/day
- pH: 7.6-8.2 (alkaline, due to HCO₃⁻)
- Enzymes (from acinar cells):
- Proteases (secreted as INACTIVE zymogens): Trypsinogen (activated by enterokinase/enteropeptidase on duodenal brush border → trypsin → activates all other zymogens), Chymotrypsinogen, Proelastase, Procarboxypeptidases
- Lipases (active when secreted): Pancreatic lipase (requires colipase), phospholipase A₂ (secreted as zymogen), cholesterol esterase
- Amylase (active when secreted): Cleaves starch → maltose + oligosaccharides
- DNase, RNase
- HCO₃⁻ (from ductal cells): Neutralizes gastric acid, optimizes pH for enzyme activity
| Stimulus | Hormone | Source | Effect on Pancreas |
|---|---|---|---|
| Acid in duodenum | Secretin | S cells of duodenum | ↑↑ HCO₃⁻ and water (mainly ductal) |
| Fat + protein in duodenum | CCK (cholecystokinin) | I cells of duodenum | ↑↑ Enzyme secretion (acinar cells) + gallbladder contraction |
| Vagal (cephalic phase) | ACh | - | ↑ Enzyme secretion |
| Gastrin | G cells | - | Mild ↑ in enzyme secretion |
22. Bile & Enterohepatic Circulation
- Bile acids (primary: cholic acid, chenodeoxycholic acid - synthesized from cholesterol in liver; conjugated with glycine/taurine = bile salts)
- Phospholipids (mainly lecithin/phosphatidylcholine)
- Cholesterol (unconjugated)
- Bilirubin (conjugated glucuronide)
- Water + electrolytes
- Emulsification of fats → increases surface area for pancreatic lipase
- Micelle formation with fatty acids → facilitates absorption (mixed micelles)
- Excretion of bilirubin, cholesterol, drugs, heavy metals
- Conjugated bile salts secreted into bile → stored in gallbladder → released into duodenum after eating (CCK trigger)
- Travel with chyme → terminal ileum: active reabsorption (Na⁺-coupled cotransporter, IBAT/ASBT) → portal blood → liver → re-secreted into bile
- Only ~5% lost in stool (fecal excretion) → replenished by de novo synthesis
- Pool recycled 6-10 times per day; total pool ~3-5g but 15-30g secreted/day
- Interruption (ileal resection, Crohn's) → bile acid deficiency → fat malabsorption + steatorrhea + fat-soluble vitamin deficiency (A, D, E, K)
- Cholestyramine: Binds bile acids in intestine → interrupts EHC → ↓ cholesterol (used in hypercholesterolemia)
- Cholesterol stones (80%): Supersaturation of cholesterol (excess cholesterol secretion, deficient bile acids/lecithin, gallbladder stasis)
- Pigment stones (20%): Hemolysis → excess unconjugated bilirubin → precipitates with Ca²⁺
23. Deglutition (Swallowing)
- Food formed into bolus; tongue pushes bolus posteriorly against palate
- Voluntary initiation; cerebral cortex control
- Lips sealed, teeth together, soft palate rises to close nasopharynx
- Bolus touches posterior pharyngeal wall → triggers involuntary swallowing reflex
- Coordinated by swallowing center in medullary reticular formation (via CN V, VII, IX, X, XII)
- Sequence:
- Soft palate elevates → closes nasopharynx (prevents nasal regurgitation)
- Vocal cords approximate, epiglottis folds over larynx → airway protected
- Breathing is inhibited (swallowing apnea)
- Upper esophageal sphincter (UES) relaxes → bolus enters esophagus
- This phase takes <2 seconds
- Primary peristalsis: Continues wave from pharynx; propels bolus down esophagus (~8-10 cm/s for liquids, slower for solids)
- Secondary peristalsis: Triggered by esophageal distension (if residue remains); clears remaining bolus
- Lower esophageal sphincter (LES): Relaxes ahead of the peristaltic wave (mediated by VIP and NO) → allows bolus into stomach
- After bolus passes: LES contracts (cholinergic, substance P, motilin) → prevents reflux
- Striated muscle (upper 1/3 esophagus): Somatic control via vagus (nucleus ambiguus)
- Smooth muscle (lower 2/3 esophagus): Autonomic via vagus (dorsal motor nucleus) + enteric nervous system (myenteric/Auerbach plexus)
- Achalasia: Failure of LES to relax + loss of peristalsis (degeneration of myenteric plexus Auerbach neurons, e.g., Trypanosoma cruzi in Chagas). Dysphagia to both solids and liquids.
- GERD: Inappropriate LES relaxation → acid reflux. Risk increased by fatty foods, alcohol, nicotine, pregnancy, obesity. Treated by PPIs, H₂ blockers, antacids.
- Dysphagia to solids only → mechanical obstruction (cancer, stricture, Schatzki ring)
- Dysphagia to both solids and liquids from outset → motility disorder