
Why fibula violet law of occifi cation
fibula law of ossification violet anatomy
https://www.quora.com/How-does-the-fibula-violate-the-laws-o…
Why the Fibula "Violates" the Law of Ossification
The Law of Ossification (for long bones)
The end (epiphysis) where the secondary ossification center appears FIRST will be the one that fuses LAST with the diaphysis (shaft).
- Upper end ossification center appears first → upper end fuses last
- Lower end ossification center appears first in the lower group → lower end components fuse earlier
How the Fibula Violates This Law
| Center | Appearance | Fusion |
|---|---|---|
| Primary (shaft/diaphysis) | 8th fetal week | - |
| Lower (distal) epiphysis | ~1st year of life (appears FIRST) | ~15-17 years (fuses EARLIER) |
| Upper (proximal) epiphysis | ~3rd-4th year (appears SECOND/LATER) | ~17-19 years (fuses LATER) |
Memory Trick
- Most bones: first ossify = last fuse
- Fibula: first ossify = first fuse (lower end)
Clinical Relevance
- On pediatric X-rays, the unfused distal fibular epiphysis in young children can be mistaken for an avulsion fracture of the lateral malleolus.
- The proximal fibular epiphysis fuses late (~17-19 years), so it can similarly mimic a fracture in adolescents.
- Understanding this atypical pattern helps avoid over-diagnosis of fractures in growing patients.
Triangle of koch is formed by
Triangle of Koch right atrium anatomy AV node
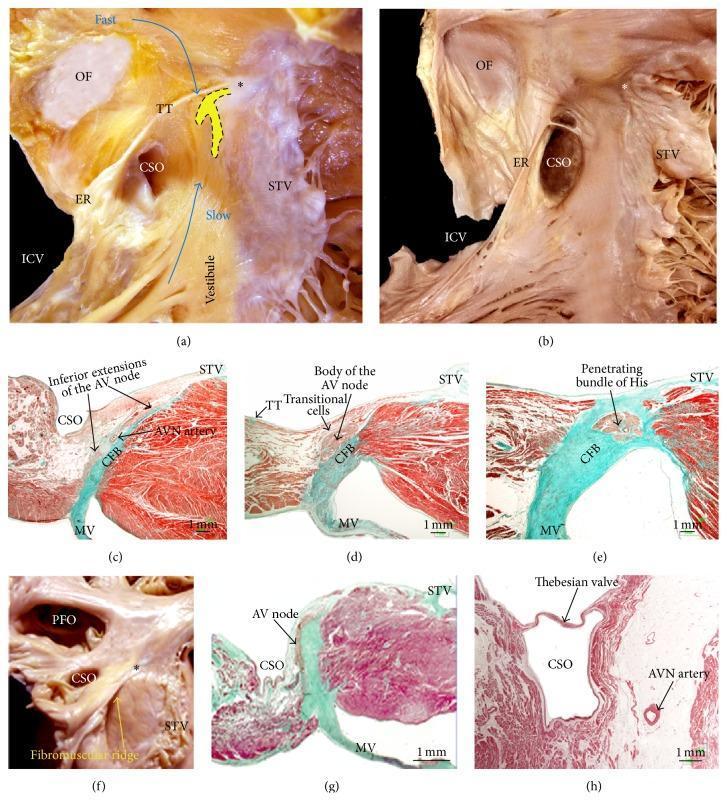
This composite figure illustrates the cardiac anatomy of the right atrium, specifically focusing on the triangle of Koch and the atrioventricular (AV) conduction system through gross dissections and histological sections. (a, b) Gross dissections of the right atrium in a right anterior oblique view show the anatomical borders of the triangle of Koch: the tendon of Todaro (TT) posteriorly, the hinge of the septal leaflet of the tricuspid valve (STV) anteriorly, and the coronary sinus ostium (CSO) inferiorly. Annotations highlight the putative fast and slow electrical pathways. (c, d, e) Histological sections (Masson's trichrome stain) demonstrate the transition from the inferior extensions of the AV node to the compact AV node body and the penetrating bundle of His through the central fibrous body (CFB). (f, g) Specimens showing Ebstein's anomaly, characterized by a smaller triangle of Koch and a displaced AV node. (h) Sagittal section showing the proximity of the AV nodal artery to the endocardium near the CSO. Other visible landmarks include the oval fossa (OF), inferior vena cava (ICV), and Eustachian ridge (ER).
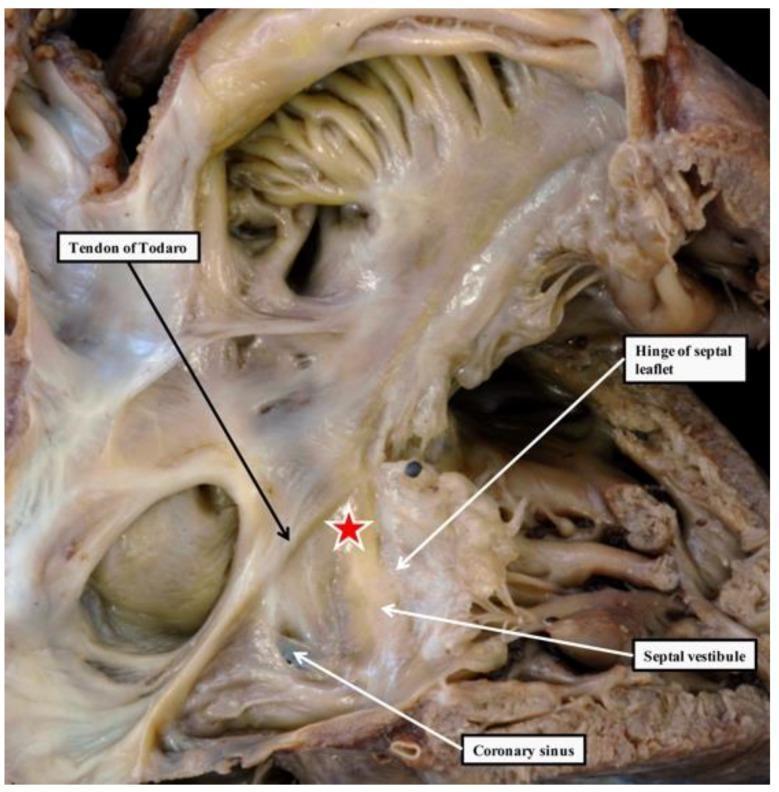
This clinical photograph displays a gross anatomical dissection of an opened human right atrium, focusing on the surgical and electrophysiological landmarks of the triangle of Koch. Key structures are labeled to demonstrate the anatomical boundaries relevant to the cardiac conduction system. The Tendon of Todaro is identified as a fibrous band forming the superior border, while the hinge of the septal leaflet of the tricuspid valve forms the inferior-lateral boundary. The coronary sinus ostium is visible at the base. A red star marks the apex of the triangle, indicating the precise location of the atrioventricular (AV) node. The septal vestibule is also highlighted, showing its relationship to the AV node and the surrounding myocardial tissue. This visual serves as a critical educational resource for understanding cardiac anatomy, specifically for procedures involving the AV node, such as catheter ablation or pacemaker lead placement. The image illustrates the transition from atrial tissue to the penetrating bundle of His within the central fibrous body.
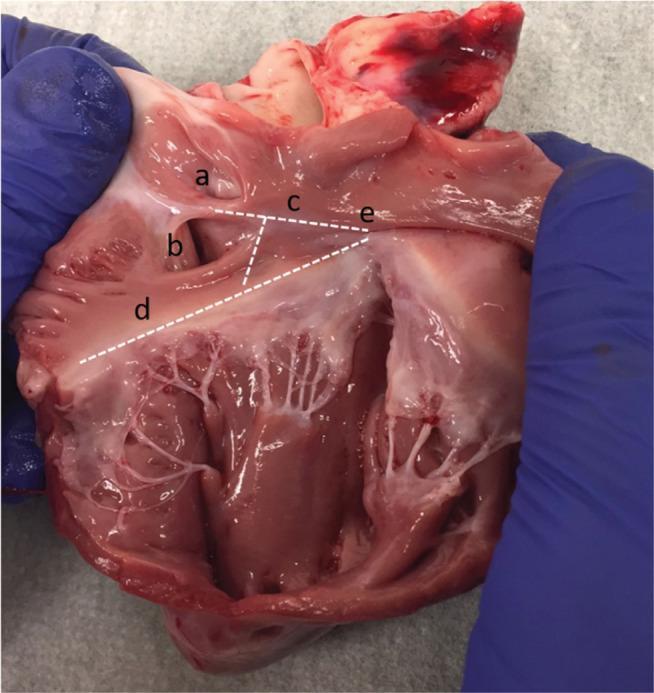
This clinical photograph displays a dissected human heart, specifically focusing on the internal anatomy of the right atrium and the right ventricular inflow tract. White dotted lines delineate the Triangle of Koch, a critical anatomical landmark for cardiac electrophysiology. The primary boundaries and related structures are labeled: (a) the fossa ovalis, shown as a shallow depression; (b) the ostium of the coronary sinus; (c) the tendon of Todaro, appearing as a subendocardial fibrous band; (d) the septal leaflet of the tricuspid valve annulus; and (e) the central fibrous body near the apex of the triangle. The inferior portion of the image reveals the complex architecture of the right ventricle, including the delicate chordae tendineae and papillary muscles associated with the tricuspid valve. This image serves as an educational reference for identifying the site of the atrioventricular (AV) node, which resides within the Triangle of Koch, and is essential for understanding cardiac conduction system localization during surgical or catheter-based interventions.
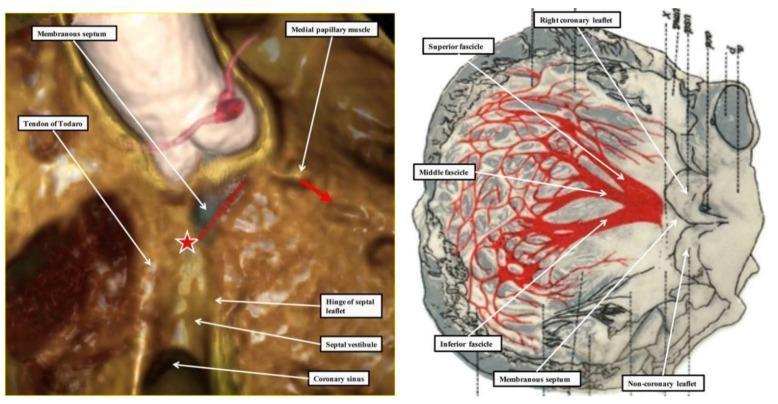
This dual-panel image compares modern 3D clinical imaging with historical anatomical illustrations to demonstrate the atrioventricular (AV) conduction system. The left panel is a 3D-reconstructed CT image of the right atrium and ventricular septal surface. Key landmarks of the triangle of Koch are labeled, including the tendon of Todaro, the coronary sinus, and the hinge of the septal leaflet of the tricuspid valve. A red star marks the location of the AV node, while a red dotted line traces the conduction axis along the muscular ventricular septal crest. A red arrow indicates the emergence of the right bundle branch near the medial papillary muscle. The right panel is a historical illustration by Tawara, showing the left ventricular septal surface. It highlights the trifascicular distribution of the left bundle branch, specifically labeling the superior fascicle (extending toward the supero-lateral papillary muscle), the inferior fascicle (extending toward the infero-septal muscle), and the middle fascicle forming a mesh-like network.
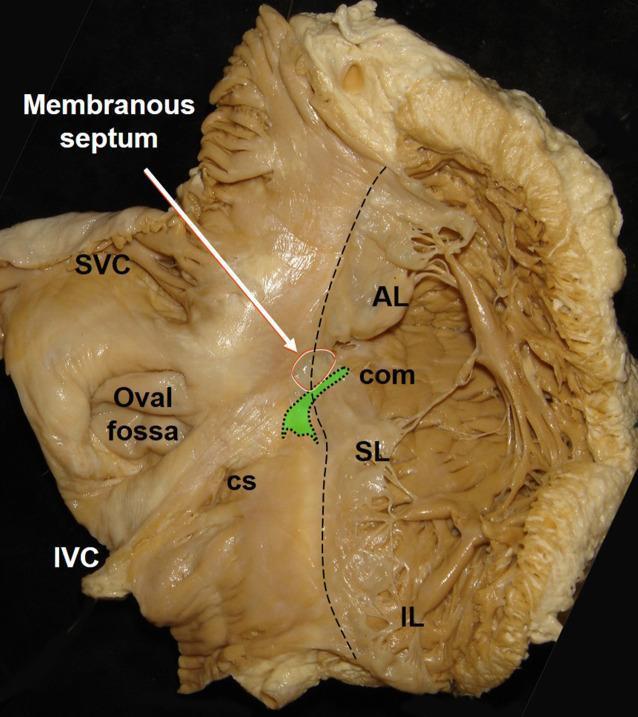
An anatomical gross specimen photograph of a human heart interior, viewed from the right atrium to illustrate the cardiac conduction system landmarks and the tricuspid valve. The atrioventricular (AV) node is highlighted in green, positioned on the atrial side of the septum within the triangle of Koch. It is located anterior to the coronary sinus (CS) ostium and superior to the insertion of the tricuspid valve's septal leaflet (SL). The distal portion of the AV node transitions into the His bundle, pointing toward the commissure (com) between the septal and anterior leaflets (AL). The membranous septum is indicated by a white arrow and circle, marking the region where the His bundle perforates the fibrous skeleton. Other visible structures include the inferior vena cava (IVC), superior vena cava (SVC), oval fossa, and the inferior leaflet (IL) of the tricuspid valve. This clinical anatomical view is essential for understanding electrophysiology and guiding lead placement in His bundle pacing.
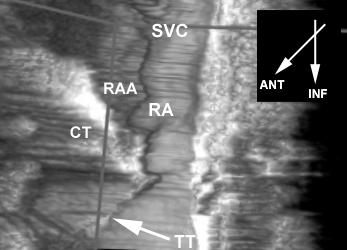
**Imaging Modality:** Three-dimensional (3D) grayscale anatomical reconstruction derived from a volumetric data-set. **Anatomical Region:** Internal view of the right atrium (RA) of the heart, focusing on the sub-eustachian and septal regions. **Key Landmarks & Structural Features:** - **Superior Vena Cava (SVC):** Positioned superiorly, marking the venous inflow. - **Right Atrial Appendage (RAA):** Visible as a muscular pouch. - **Crista Terminalis (CT):** A prominent muscular ridge separating the smooth sinus venarum from the pectinate muscles. - **Tendon of Todaro (TT):** Labeled and indicated by an arrow, this fibrous structure runs from the Eustachian valve toward the central fibrous body. It forms the superior border of the Triangle of Koch. **Visual Findings:** The reconstruction displays the spatial orientation of the right atrial endocardial surface. An orientation inset indicates the anterior (ANT) and inferior (INF) axes. The Tendon of Todaro is visualized as a discrete linear band, essential for identifying the Triangle of Koch—a critical surgical and electrophysiological landmark containing the atrioventricular (AV) node. **Diagnostic Significance:** This anatomical mapping is used to localize the AV node and conduct cardiac mapping for ablation procedures.
Triangle of Koch
Boundaries (3 sides + 1 apex)
| Border | Structure |
|---|---|
| Posterosuperior | Tendon of Todaro (fibrous band - free border of the Eustachian valve continuing into the Eustachian ridge) |
| Anteroinferior | Hinge of the septal leaflet of the tricuspid valve |
| Base (inferior) | Ostium of the coronary sinus |
| Apex | Central fibrous body (where Tendon of Todaro inserts) |
Key Contents
- AV node - located at the apex of the triangle (compact node ~5 mm in size)
- Slow pathway - runs along the base near the coronary sinus ostium (target for ablation in AVNRT)
- Fast pathway - corresponds to tissue immediately posterior to the apex
Clinical Importance
- AVNRT (AV Nodal Reentrant Tachycardia) - the reentry circuit runs within the Triangle of Koch using slow and fast pathways; slow pathway ablation targets the paraseptal isthmus (between coronary sinus ostium and tricuspid valve)
- His bundle pacing - electrode placement guided by Koch's triangle landmarks
- Surgical risk - procedures near the tricuspid valve or AV septum risk AV node damage if this triangle is not respected
Anatomical Image
The space of disse lie between
space of Disse liver sinusoid hepatocyte anatomy diagram
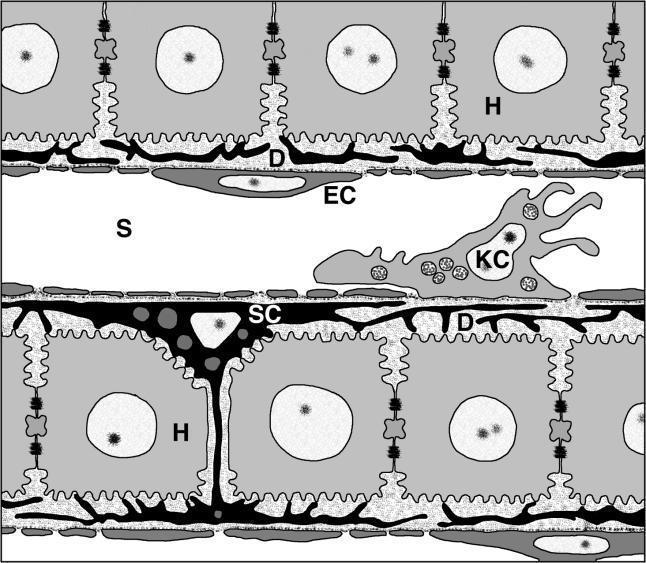
This medical anatomical diagram illustrates the microarchitecture of a liver sinusoid and its surrounding cellular environment. The central feature is the sinusoidal lumen (S), which is lined by a thin layer of fenestrated endothelial cells (EC). Interspersed along this endothelial lining within the lumen is a Kupffer cell (KC), identifiable by its irregular, stellate morphology and cytoplasmic extensions characteristic of resident macrophages. Between the endothelial layer and the neighboring hepatocytes (H) lies the narrow space of Disse (D). Within this space, a hepatic stellate cell (SC) is visible, exhibiting a dark, compact appearance with cytoplasmic projections that contribute to the extracellular matrix. The hepatocytes (H) are arranged in cords, featuring large nuclei and specialized borders facing the space of Disse. This diagram serves as an educational tool for understanding hepatic histology, specifically the relationship between blood flow in the sinusoids and the various specialized cells responsible for immune surveillance, metabolic processing, and structural support within the liver lobule.
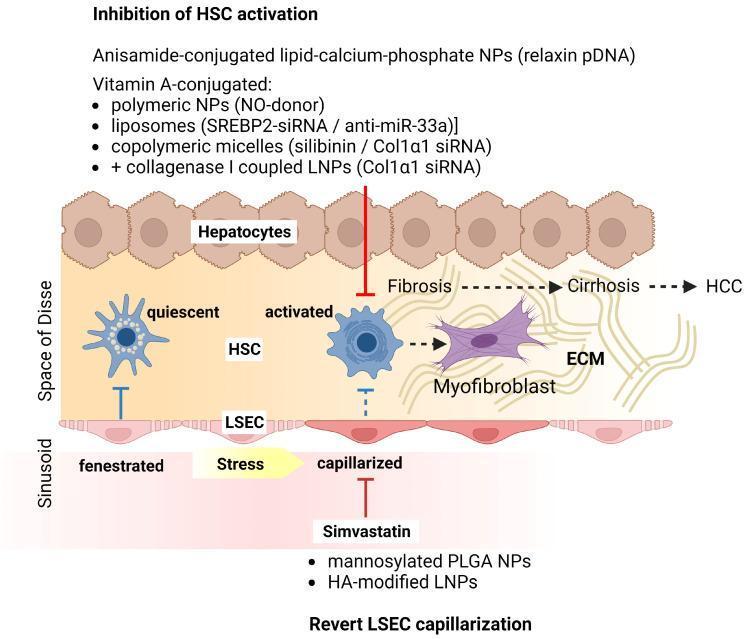
This pathophysiology diagram illustrates the cellular and molecular progression of liver disease from a healthy state to hepatocellular carcinoma (HCC), focusing on therapeutic nanoformulation targets. The visual represents the liver sinusoid microenvironment, featuring hepatocytes, the Space of Disse, and liver sinusoidal endothelial cells (LSECs). The progression begins with quiescent hepatic stellate cells (HSCs) and fenestrated LSECs. Following physiological stress, LSECs undergo 'capillarization' (loss of fenestrae), leading to HSC activation. These activated HSCs transdifferentiate into myofibroblasts, which secrete excessive extracellular matrix (ECM), culminating in fibrosis, cirrhosis, and HCC. The diagram highlights two primary therapeutic strategies using nanoparticles: 1) Inhibition of HSC activation via Vitamin A-conjugated or anisamide-conjugated nanoformulations (delivering relaxin pDNA, NO-donors, or siRNA against SREBP2 and Col1̡1) to stop myofibroblast transformation; and 2) Reversion of LSEC capillarization using Simvastatin or targeted nanoformulations (mannosylated PLGA NPs or HA-modified LNPs). This educational graphic is intended to explain the role of the hepatic microenvironment in fibrogenesis and the application of nanomedicine in chronic liver disease.
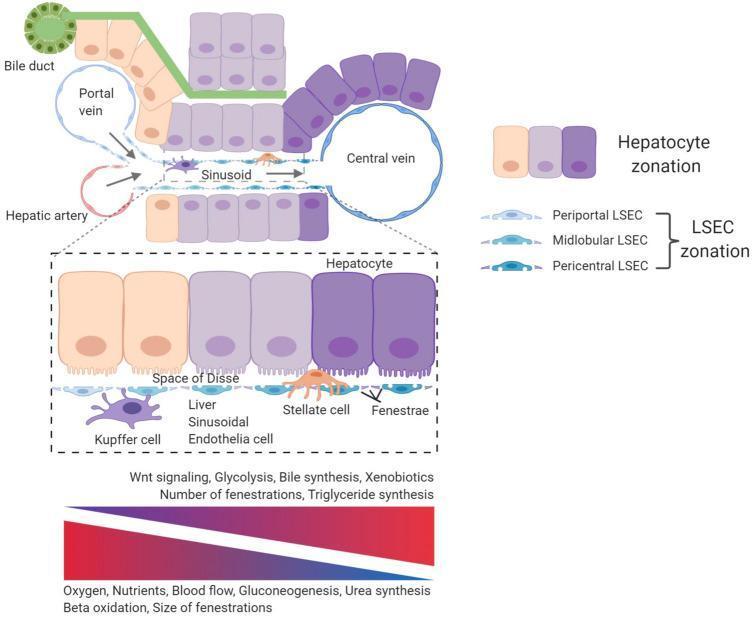
This pathophysiology diagram illustrates the vascular architecture and cellular zonation of a human liver lobule. The schematic depicts blood flow entering peripherally from the portal triad (Portal vein and Hepatic artery) and moving through the liver sinusoids toward the Central vein. Key cellular components include cords of hepatocytes, liver sinusoidal endothelial cells (LSEC), Kupffer cells (within the sinusoid), and Stellate cells (located in the Space of Disse). The diagram emphasizes the concept of metabolic zonation across the periportal, midlobular, and pericentral regions. A gradient scale correlates spatial location with physiological processes: periportal zones show high oxygen, nutrients, gluconeogenesis, and urea synthesis, while pericentral zones exhibit increased Wnt signaling, glycolysis, and bile synthesis. An enlarged inset details the LSEC lining, highlighting the presence of fenestrae (pores). Labels further distinguish LSEC zonation based on the size and frequency of these fenestrations along the portal-to-central axis, illustrating the functional angiodiversity of the hepatic microenvironment.
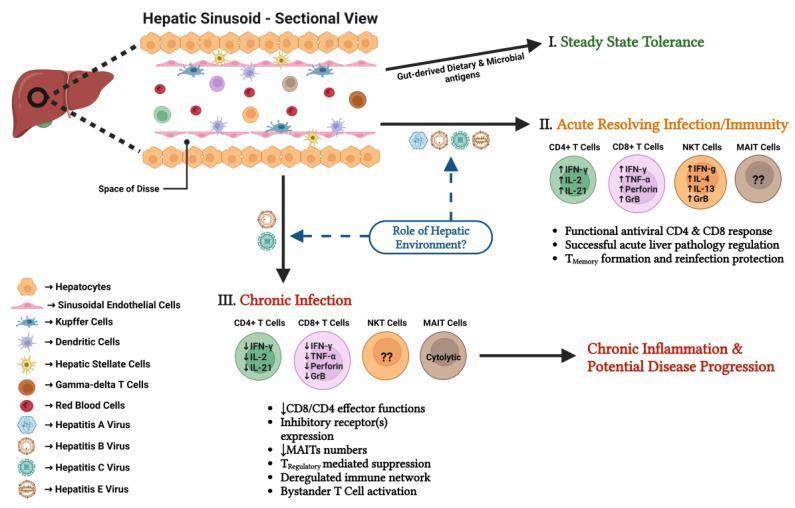
A medical illustration of the hepatic sinusoid microenvironment and its immunological response to viral infections. The diagram features a sectional view of the hepatic sinusoid, showing hepatocytes, the Space of Disse, sinusoidal endothelial cells, Kupffer cells, and stellate cells. It outlines three distinct clinical states: (I) Steady State Tolerance, where the liver maintains immunity to gut-derived antigens; (II) Acute Resolving Infection/Immunity, characterized by upregulated cytokine production (IFN-γ, IL-2, IL-21) and cytotoxic factors (Perforin, GrB) by CD4+, CD8+, and NKT cells, leading to viral clearance; and (III) Chronic Infection (associated with Hepatitis B and C), showing T cell dysfunction with downregulated effector molecules, chronic inflammation, and potential disease progression. The schematic highlights the role of specialized hepatic cells, including MAIT cells and gamma-delta T cells, in modulating these immune responses. It serves as a pedagogical overview of hepatotropic viral pathogenesis and liver-specific immune regulation for advanced medical education in immunology and hepatology.
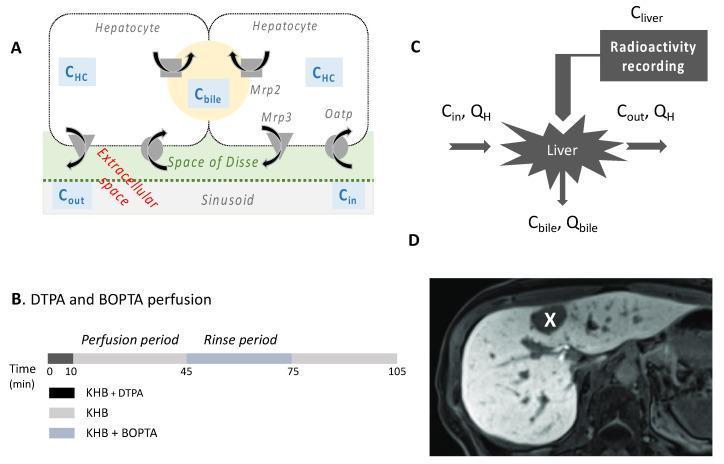
A multi-panel figure illustrating the transport mechanisms and diagnostic application of gadobenic acid (BOPTA) in hepatobiliary imaging. Panel A is a pathophysiology diagram showing hepatocyte transport: BOPTA enters hepatocytes from the sinusoids and space of Disse via Oatp transporters and exits into bile canaliculi through Mrp2, or returns to sinusoids via Mrp3. Panel B displays an experimental timeline for rat liver perfusion, detailing a 105-minute sequence involving KHB+DTPA (0-10 min), a KHB rinse (10-45 min), KHB+BOPTA accumulation (45-75 min), and a final rinse (75-105 min). Panel C is a schematic of a perfusion model indicating inflow (Cin), outflow (Cout), bile flow (Cbile), and radioactivity recording (Cliver) parameters. Panel D is a diagnostic MRI of a human liver in the hepatobiliary phase. It demonstrates differential uptake: normal hepatocytes appear bright (white) due to BOPTA uptake, while a focal liver lesion (marked with a 'X') remains dark (black), indicating a lack of uptake transporters in the tumor tissue.
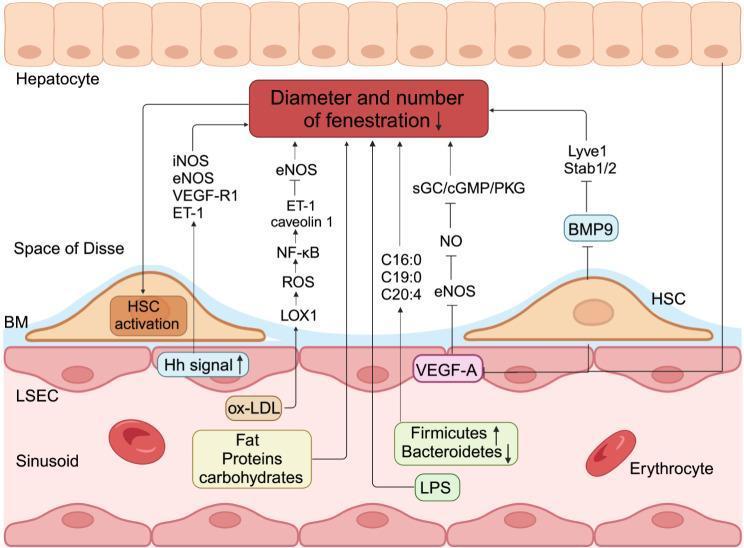
This pathophysiology diagram illustrates the pathological mechanism of liver sinusoidal endothelial cell (LSEC) capillarization, a key event in metabolic dysfunction-associated fatty liver disease (MAFLD) and fibrosis. The visual is organized into distinct anatomical layers: hepatocytes at the top, the Space of Disse containing hepatic stellate cells (HSCs), the basal membrane (BM), and the liver sinusoid containing LSECs and erythrocytes. The central educational focus is the reduction in diameter and number of LSEC fenestrations. The diagram maps multiple signaling pathways contributing to this process: 1) Nutritional factors (excess fat, proteins, carbohydrates) and gut-derived signals (LPS, Bacteroidetes/Firmicutes shifts) influencing fatty acid levels (C16:0, C19:0, C20:4); 2) Oxidative stress pathways where ox-LDL triggers the LOX1/ROS/NF-κB axis, upregulating ET-1 and caveolin 1 while inhibiting eNOS; 3) Paracrine signaling disruptions, including decreased VEGF-A from hepatocytes and BMP9 from HSCs, the latter affecting Lyve1 and Stab1/2; and 4) Intracellular signaling via upregulated Hedgehog (Hh) signals and the sGC/cGMP/PKG pathway. The culmination of these processes leads to LSEC capillarization, basement membrane deposition, and subsequent HSC activation.
Space of Disse
The basal surfaces of hepatocytes AND the basal surfaces of the sinusoidal endothelial cells (and Kupffer cells)
Location in Context
Sinusoidal lumen (blood)
        ↓
Fenestrated endothelial cells + Kupffer cells
        ↓
━━━━━ SPACE OF DISSE ━━━━━
        ↓
Hepatocyte basal surface (with microvilli)
Key Features
| Feature | Detail |
|---|---|
| Location | Between hepatocytes and sinusoidal endothelium |
| Access | Plasma (not blood cells) freely enters via fenestrae in endothelial cells |
| Microvilli | Hepatocyte surface facing the space is richly covered with microvilli - greatly increases surface area for exchange |
| Contents | Plasma, sparse ECM (collagen type I, III, IV, fibronectin, laminin), stellate cells |
| Drainage | Fluid drains into hepatic lymphatics via the portal tracts |
| Resident cells | Hepatic stellate cells (Ito cells / perisinusoidal lipocytes) reside here |
Cells Found in the Space of Disse
- Hepatic stellate cells (Ito cells) - normally quiescent, store vitamin A (lipid droplets); when activated, become myofibroblasts and produce collagen causing liver fibrosis
- Occasional lymphocytes and fat droplets
Clinical Relevance
| Condition | Involvement of Space of Disse |
|---|---|
| Liver fibrosis / Cirrhosis | Stellate cell activation deposits excess collagen in the Space of Disse ("capillarization of sinusoids") |
| Portal hypertension | Collagen deposition narrows sinusoids, increasing resistance |
| Hepatic lymph | Increased pressure here raises hepatic lymph production - contributes to ascites |
Diagram