
Explain the Diabetes Mellitus in detail in very simple language
diabetes mellitus type 1 type 2 insulin mechanism diagram
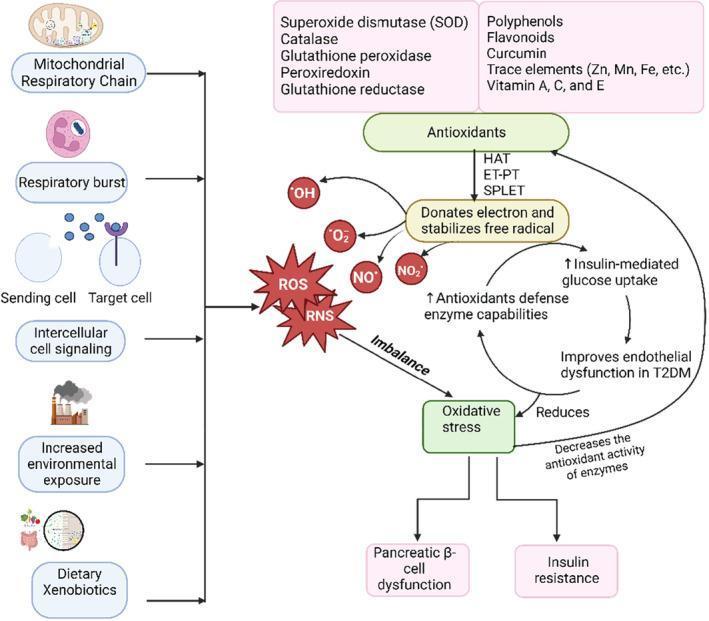
This pathophysiology diagram illustrates the mechanism of oxidative stress in Type 2 Diabetes Mellitus (T2DM) and the countervailing role of phytochemical antioxidants. On the left, it identifies primary sources of Reactive Oxygen Species (ROS) and Reactive Nitrogen Species (RNS), including mitochondrial respiratory chain activity, respiratory burst, intercellular cell signaling, environmental exposure (pollution), and dietary xenobiotics. An imbalance caused by these factors leads to oxidative stress, which induces pancreatic ̢-cell dysfunction and insulin resistance. The right side shows how antioxidants (e.g., superoxide dismutase, catalase, polyphenols, vitamins A, C, E) neutralize radicals like ·OH, ·O2-, NO·, and NO2· by donating electrons through mechanisms such as Hydrogen Atom Transfer (HAT) and Single Proton Loss Electron Transfer (SPLET). This antioxidant activity restores balance, improves insulin-mediated glucose uptake, enhances endogenous enzyme capabilities, and reduces endothelial dysfunction. The diagram serves as an educational summary of redox biology in metabolic disease management.
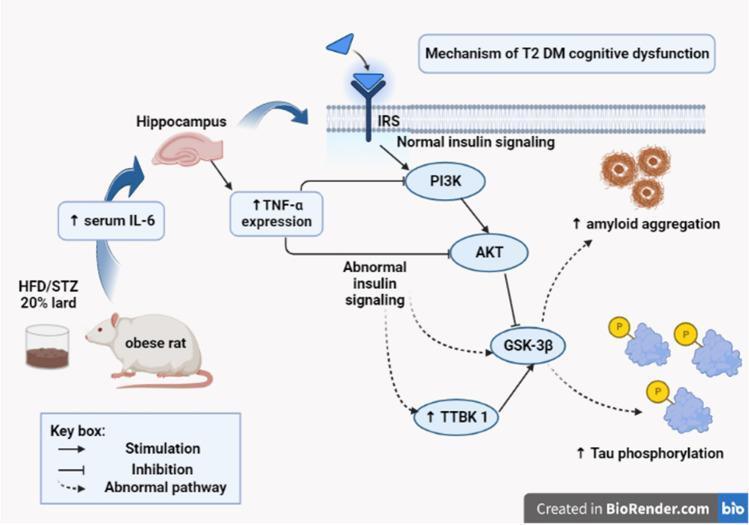
A pathophysiology diagram illustrating the molecular mechanisms linking Type 2 Diabetes Mellitus (T2DM) to cognitive dysfunction. The pathway begins with a High-Fat Diet (HFD) and Streptozotocin (STZ) induction in a rat model, leading to increased serum Interleukin-6 (IL-6) and subsequent hippocampal TNF-α expression. This inflammatory state disrupts normal insulin signaling at the Insulin Receptor Substrate (IRS) level. Under normal conditions, IRS stimulates the PI3K/AKT pathway. However, the diagram shows an 'abnormal pathway' where increased TNF-α leads to decreased PI3K and AKT activity. This downregulation fails to inhibit Glycogen Synthase Kinase 3 beta (GSK-3β). Simultaneously, there is an upregulation of Tau Tubulin Kinase 1 (TTBK 1). The synergistic effect of increased GSK-3β and TTBK 1 activity drives the hallmark pathological features of Alzheimer-like neurodegeneration: increased amyloid aggregation and increased tau phosphorylation. The diagram uses solid arrows for stimulation, T-bars for inhibition, and dashed arrows to represent abnormal disease-state pathways.
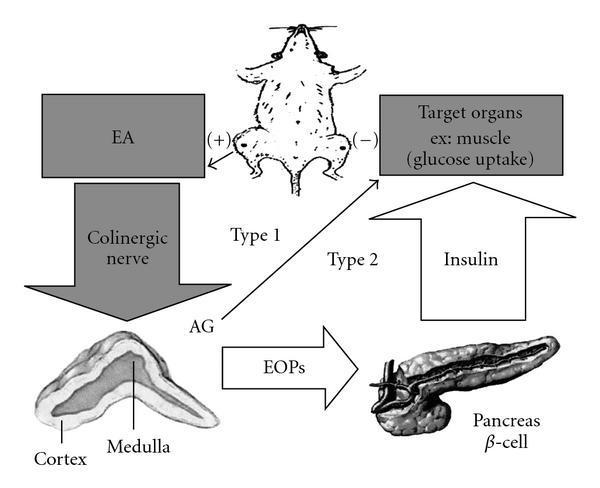
This pathophysiology diagram illustrates the hypothetical mechanism for the hypoglycemic effect of Electroacupuncture (EA) in different types of Diabetes Mellitus (DM), utilizing a rat model for preclinical context. The central pathway shows EA (applied at ST-36 acupoints) stimulating the cholinergic nerve, which targets the adrenal gland (AG), specifically highlighting the cortex and medulla. In Type 1 (insulin-dependent) DM, a direct signaling pathway from the adrenal gland to target organs (e.g., muscle) facilitates glucose uptake. In Type 2 (non-insulin-dependent) DM, the adrenal gland triggers the release of endogenous opioid peptides (EOPs), which stimulate the pancreas ̠-cells to secrete insulin, subsequently enhancing glucose uptake in target organs. The diagram serves to differentiate between insulin-dependent and insulin-independent mechanisms of EA, highlighting the roles of the parasympathetic nervous system, the adrenal-pancreatic axis, and metabolic signaling in glucose regulation. Key anatomical structures depicted include the adrenal gland, pancreas, and representative target musculature.
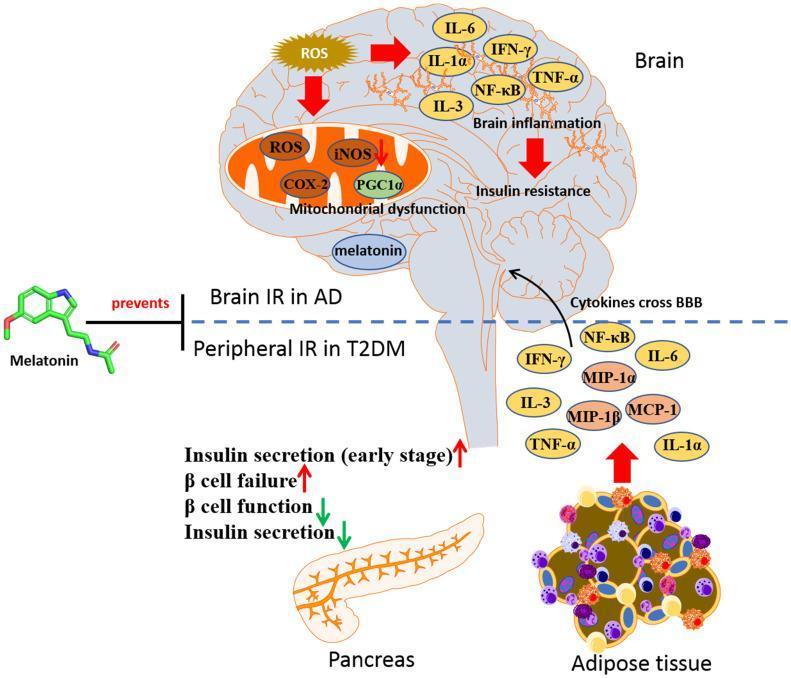
A medical pathophysiology diagram illustrating the link between peripheral insulin resistance (IR) in Type 2 Diabetes Mellitus (T2DM) and brain insulin resistance in Alzheimer's Disease (AD), highlighting the protective role of melatonin. The diagram is split into two sections by a dotted line representing the blood-brain barrier (BBB). The lower section depicts peripheral mechanisms including adipose tissue releasing pro-inflammatory cytokines (IL-1α, TNF-α, IL-3, IFN-γ, MCP-1, MIP-1α, MIP-1β, and NF-κB) and pancreatic alterations (early stage hyperinsulinemia followed by beta-cell failure and decreased insulin secretion). These peripheral cytokines are shown crossing the BBB into the brain. The upper section illustrates central effects: neuroinflammation characterized by IL-6 and TNF-α, mitochondrial dysfunction involving ROS, iNOS, COX-2, and PGC1α, and subsequent brain IR. A molecular structure of melatonin is shown on the left, indicated as an agent that 'prevents' the progression from peripheral IR to central neurodegeneration by targeting insulin signaling pathways.
"diabetes mellitus"[MeSH Terms] AND management
Diabetes Mellitus - A Simple, Detailed Explanation
What is Diabetes Mellitus?
🔑 The Role of Insulin - The Key to Understanding Diabetes
- Tells muscle and fat cells to absorb glucose for energy
- Tells the liver to store glucose (as glycogen) rather than make more
- Stops fat breakdown
📋 Classification: Types of Diabetes
Type 1 Diabetes Mellitus (T1DM)
- What happens: The immune system mistakenly attacks and destroys the pancreatic beta cells. No insulin is produced at all.
- Who gets it: Usually children and young adults (though it can occur at any age)
- Why it happens: Autoimmune destruction triggered by a combination of genetic predisposition and environmental factors (possibly viral infections)
- Key problem: Absolute insulin deficiency - the body has zero insulin
- Requires: Lifelong insulin injections to survive
Type 2 Diabetes Mellitus (T2DM)
- What happens: Two problems combine - (1) cells resist insulin's effect (insulin resistance), and (2) beta cells gradually fail to produce enough insulin
- Who gets it: Usually adults over 40, but increasingly younger people and even adolescents due to obesity
- Why it happens: Obesity (especially belly fat), physical inactivity, genetics, aging
- Key problem: Relative insulin deficiency + insulin resistance
- Accounts for: Over 90% of all diabetes cases - Lippincott Illustrated Reviews: Biochemistry, 8th ed
Gestational Diabetes
- Develops during pregnancy when hormones cause insulin resistance, and the pancreas cannot keep up. Usually resolves after delivery but increases risk of T2DM later.
Other Types
- Maturity-Onset Diabetes of the Young (MODY) - genetic single-gene defects
- Drug-induced (e.g., steroids)
- Pancreatic disease
⚙️ How Does It Actually Work? (Pathophysiology)
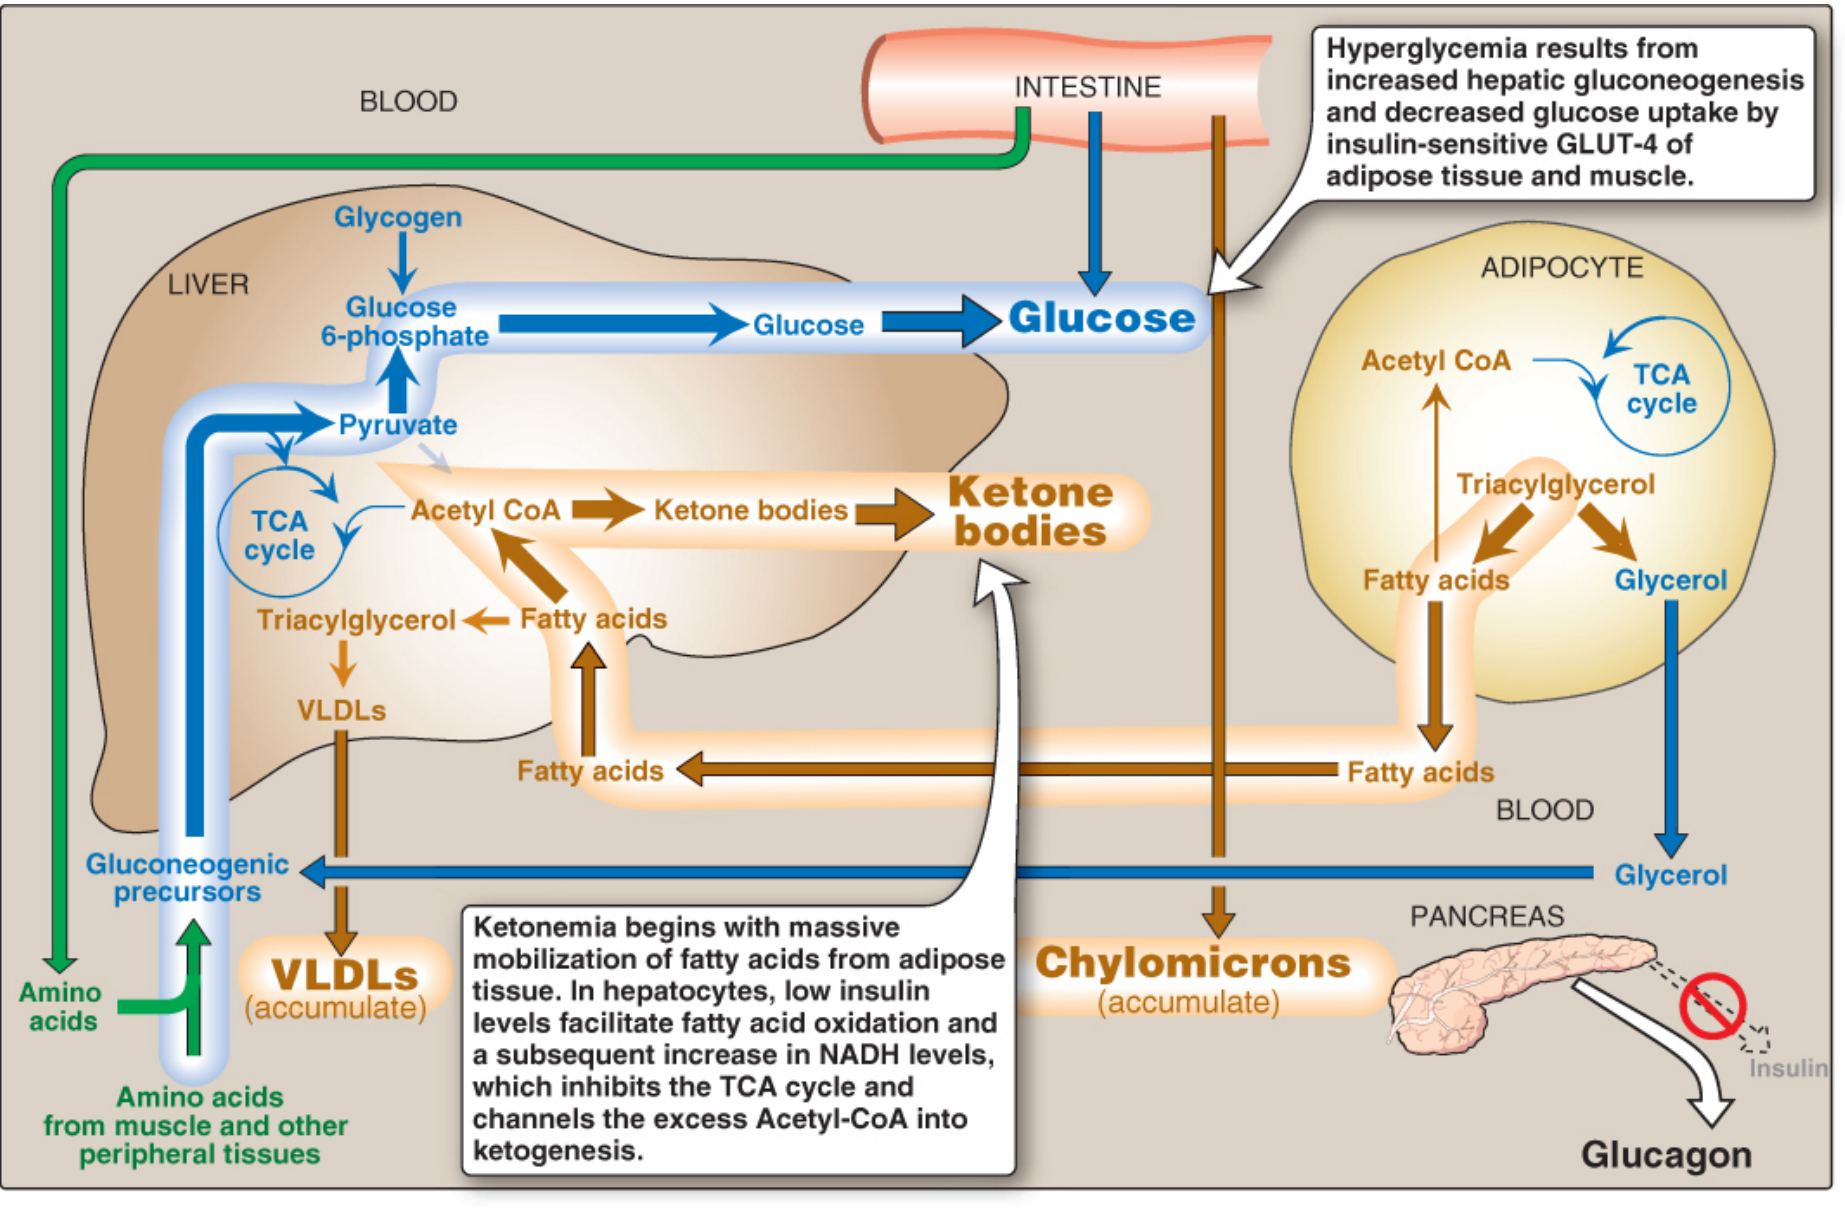
Type 1 - The "No Key" Problem
Type 2 - The "Broken Lock" Problem
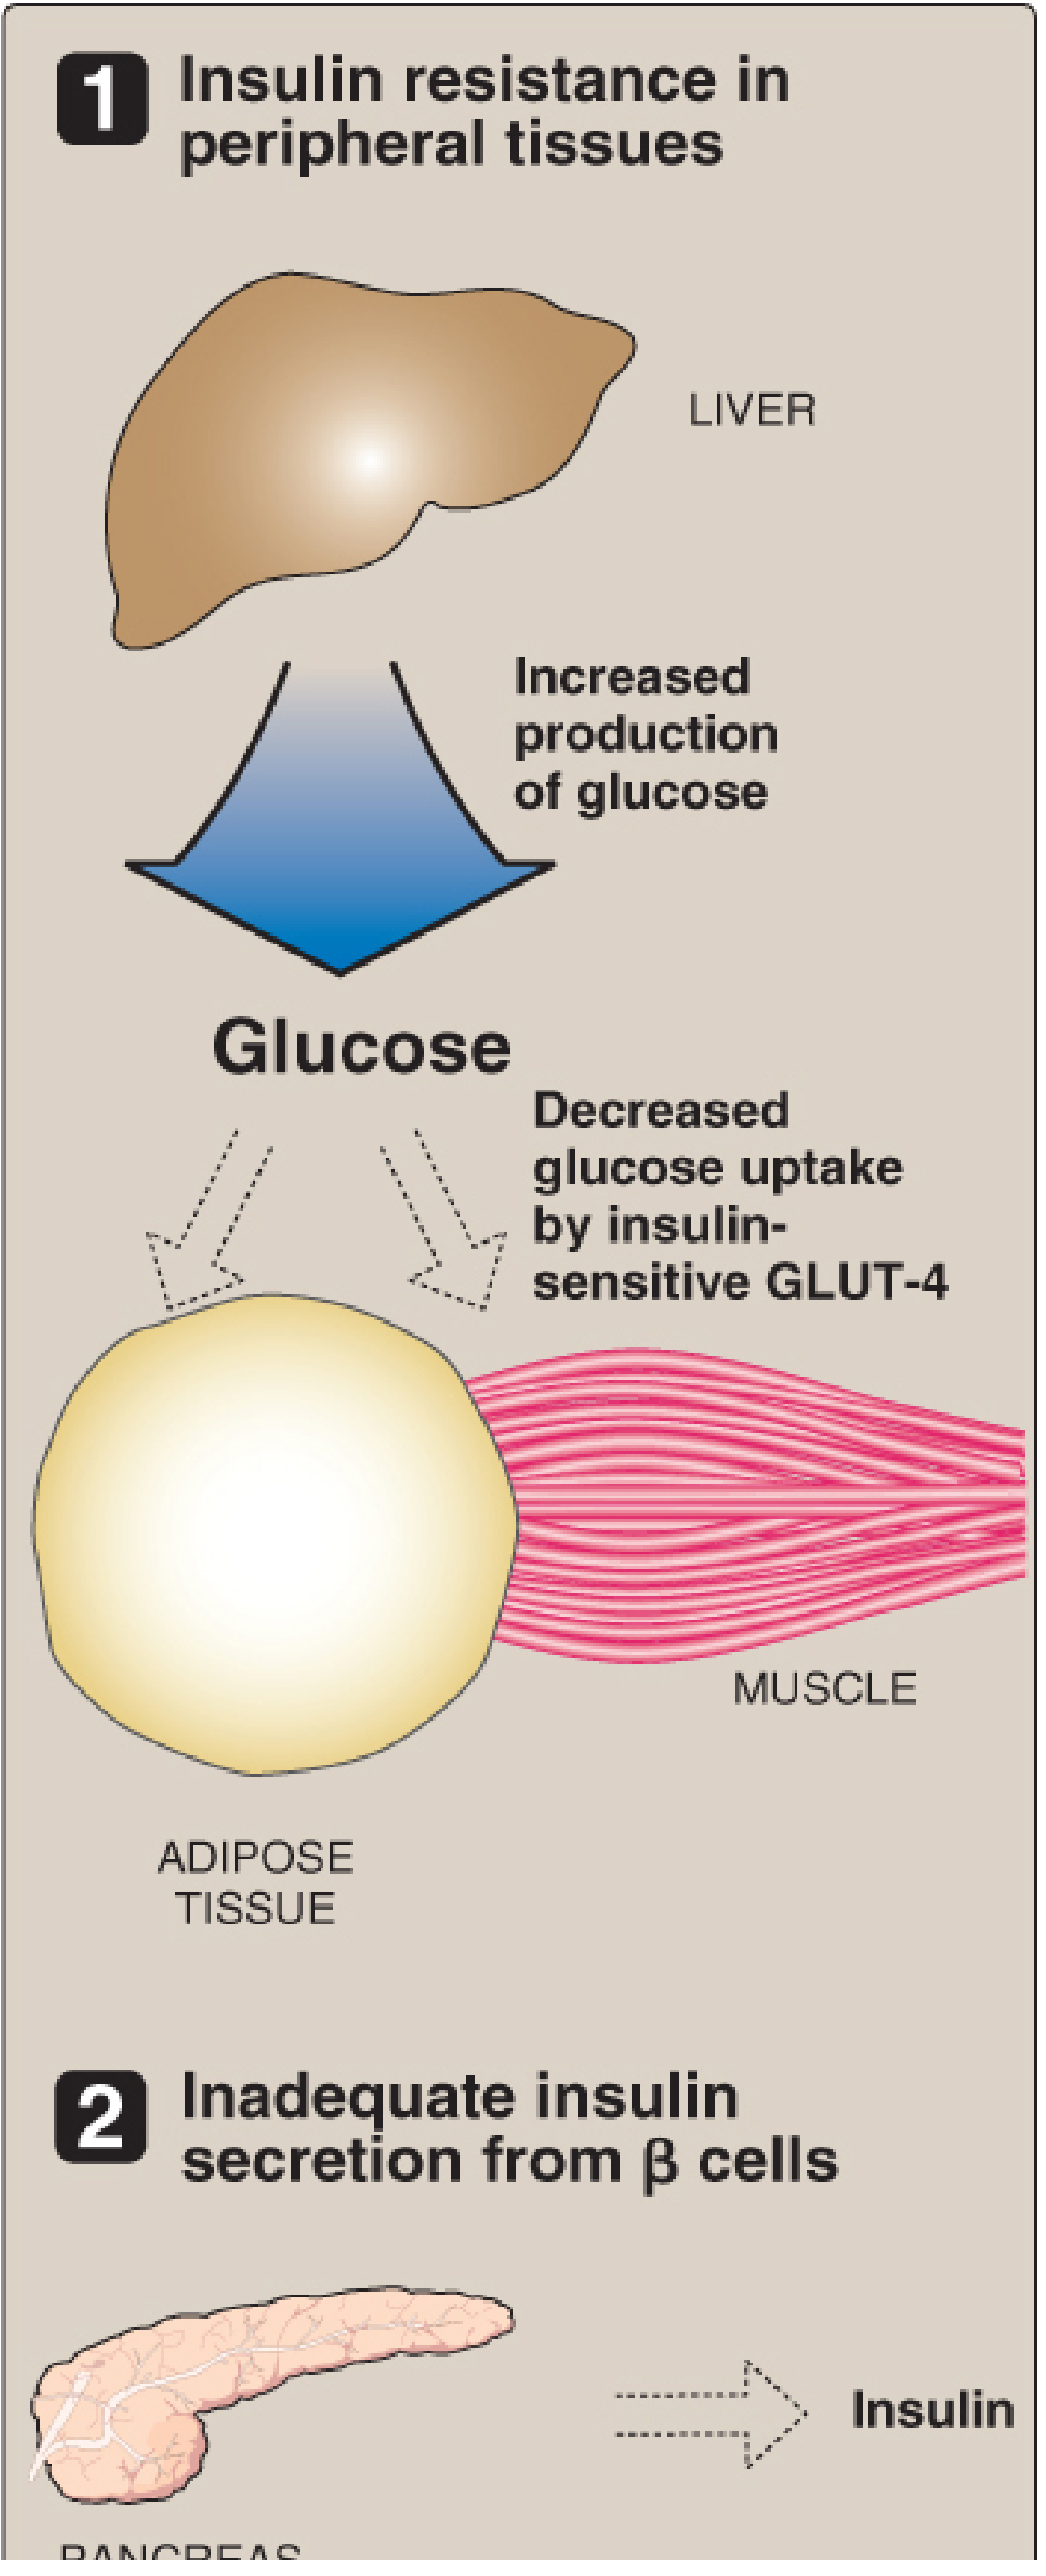
- The liver keeps dumping glucose into blood even after meals
- Muscles reduce glucose uptake by 30-60% compared to normal
- Fat tissue keeps releasing free fatty acids - Harrison's Principles of Internal Medicine, 22nd Ed
- TNF-α, IL-6, resistin - inflammatory proteins released by fat tissue that worsen insulin resistance
- Adiponectin - a protective protein from fat cells that is reduced in obesity
- Free fatty acids - flood the liver and muscles, causing "lipotoxicity"
🚨 Symptoms - How Does Diabetes Feel?
| Symptom | Simple Explanation |
|---|---|
| Polyuria (frequent urination) | Excess blood glucose spills into urine, pulling water with it (osmotic diuresis) |
| Polydipsia (excessive thirst) | All that water loss makes you dehydrated and constantly thirsty |
| Polyphagia (excessive hunger) | Cells are starving for energy even though blood has lots of glucose |
- Unexplained weight loss (especially T1DM - body burns fat and muscle for energy)
- Fatigue and weakness
- Blurry vision (high glucose changes the lens shape)
- Slow-healing wounds
- Frequent infections (fungi, bacteria thrive in high-sugar environments)
- Genital itching or thrush (candida/yeast infections)
🔬 How Is It Diagnosed?
| Test | Normal | Pre-Diabetes | Diabetes |
|---|---|---|---|
| Fasting Plasma Glucose | <100 mg/dL | 100-125 mg/dL | ≥126 mg/dL |
| 2-hr Oral Glucose Tolerance Test (OGTT) | <140 mg/dL | 140-199 mg/dL | ≥200 mg/dL |
| HbA1c (3-month average) | <5.7% | 5.7-6.4% | ≥6.5% |
| Random Blood Glucose + symptoms | - | - | ≥200 mg/dL |
⚠️ Complications - What Happens If Untreated?
Microvascular (Small Blood Vessel Damage)
- Diabetic Retinopathy: Blood vessels in the retina (back of the eye) leak and break. The leading cause of new blindness in adults.
- Diabetic Nephropathy (Kidney Disease): Damaged kidney filters leak protein into urine. Can progress to kidney failure requiring dialysis. Nephropathy also greatly increases cardiovascular risk.
- Diabetic Neuropathy: Nerve damage causing numbness, tingling, or burning pain, especially in feet and hands ("glove-and-stocking" distribution). Can cause loss of sensation, leading to unnoticed injuries and ulcers.
Macrovascular (Large Blood Vessel Damage)
- Heart Attack (Myocardial Infarction): DM is considered a "CAD risk equivalent" - a person with diabetes has the same heart attack risk as someone who already had one.
- Stroke: Accelerated atherosclerosis damages brain blood vessels.
- Peripheral Artery Disease: Reduced blood flow to legs, causing pain walking, poor wound healing, and in severe cases, amputation.
"Nearly 80% of people with diabetes will die of cardiovascular disease." - Textbook of Family Medicine, 9th Edition
Acute Complications
| Complication | Seen in | Cause |
|---|---|---|
| DKA (Diabetic Ketoacidosis) | Mainly T1DM | No insulin → ketone buildup → acid in blood |
| HHS (Hyperosmolar Hyperglycemic State) | Mainly elderly T2DM | Extreme dehydration + very high sugar |
| Hypoglycemia | Both types on treatment | Too much insulin or skipping meals |
💊 Treatment - How Is Diabetes Managed?
Lifestyle - The Foundation
- Dietary changes: Reduce refined sugars, increase fiber, control portion sizes
- Physical activity: Exercise makes muscles more sensitive to insulin - even 30 min walking daily helps significantly
- Weight loss: Even 5-10% body weight reduction dramatically improves blood sugar in T2DM
Medications
- Insulin is mandatory - either multiple daily injections (standard) or continuous insulin pump
- Standard therapy: 2-3 injections/day, targets HbA1c 8-9%
- Intensive therapy: 3+ injections or pump, targets HbA1c <7% - significantly reduces complications
| Drug Class | How It Works | Example |
|---|---|---|
| Metformin | Reduces liver glucose production | Metformin (first-line) |
| GLP-1 Receptor Agonists | Stimulate insulin, suppress glucagon, reduce appetite | Semaglutide, Liraglutide |
| SGLT-2 Inhibitors | Make kidneys dump excess glucose in urine | Empagliflozin, Dapagliflozin |
| Sulfonylureas | Force beta cells to produce more insulin | Glipizide, Glibenclamide |
| DPP-4 Inhibitors | Slow the breakdown of natural GLP-1 | Sitagliptin |
| Insulin | Replace or supplement insulin when beta cells fail | Various formulations |
Monitoring
- Blood glucose checks - using a glucometer (finger prick) or continuous glucose monitor (CGM - a small sensor worn on skin)
- HbA1c - checked every 3 months to assess long-term control
- Annual screening for kidney disease (urine albumin), eye disease (dilated eye exam), foot exams, and blood pressure control
🛡️ Prevention
- Maintaining healthy weight
- Regular physical activity
- Healthy diet (low in refined carbs and saturated fats)
- Not smoking
- Managing blood pressure and cholesterol
Quick Summary Table
| Feature | Type 1 DM | Type 2 DM |
|---|---|---|
| Age of onset | Usually childhood/adolescence | Usually >40 (now younger too) |
| Cause | Autoimmune beta cell destruction | Insulin resistance + beta cell failure |
| Insulin | Zero insulin produced | Some insulin, but not enough |
| Body type | Usually lean | Usually overweight/obese |
| Onset | Rapid (days-weeks) | Slow (years) |
| DKA risk | High | Low |
| Treatment | Insulin always needed | Lifestyle + oral drugs ± insulin |
| % of all diabetes | ~5-10% | ~90-95% |