Provode notes on ecg interpretation with examples of diseases
Reading File
Finding Sources
Finding Sources
Finding Sources
Finding Sources
Reading File
Reading File
Finding Sources
Finding Sources
Reading File
Reading File
Reading File
Finding Sources
Finding Sources
Reading File
Reading File
Reading File
Reading File
Reading File
Loading Image
Loading Image
Loading Image
Loading Image
Loading Image
I now have rich, comprehensive content from multiple authoritative textbooks. Here are detailed ECG interpretation notes:
ECG Interpretation - Comprehensive Notes
Sources: Harrison's Principles of Internal Medicine 22E (2025), Tintinalli's Emergency Medicine, Fuster and Hurst's The Heart 15th Ed., Pfenninger & Fowler's Procedures for Primary Care, Costanzo Physiology 7th Ed.
1. The Systematic Approach (14-Parameter Checklist)
Harrison's mandates this systematic review for every ECG to avoid errors of omission:
- Standardization / calibration - check 1 mV = 10 mm, paper speed 25 mm/s, lead placement artifacts
- Rhythm - sinus vs. non-sinus
- Heart rate - normal 60-100 bpm; Rate = 1/R-R interval (in seconds)
- PR interval / AV conduction - normal 120-200 ms (3-5 small squares)
- QRS interval - normal <120 ms
- QT/QTc interval - rate-corrected; prolonged if >440 ms (men) / >460 ms (women)
- Mean QRS electrical axis - normal -30° to +90°
- P waves - morphology, axis, duration
- QRS voltages - high or low
- Precordial R-wave progression - R grows from V1 to V5
- Abnormal Q waves - >40 ms wide or >25% of R wave height
- ST segments - elevation or depression relative to baseline
- T waves - inversion, peaking, flatness
- U waves - seen in V2-V3; prominent in hypokalemia
Always compare with previous ECGs. A single normal ECG does not exclude ischemia.
2. ECG Waveforms - What Each Represents
| Wave/Interval | Electrical Event | Normal Duration |
|---|---|---|
| P wave | Atrial depolarization | <120 ms, <2.5 mm tall |
| PR interval | AV nodal conduction time | 120-200 ms |
| QRS complex | Ventricular depolarization | <120 ms |
| ST segment | Isoelectric (ventricular plateau) | At baseline |
| T wave | Ventricular repolarization | Upright in I, II, V3-V6 |
| QT interval | Total ventricular activity (depolarization + repolarization) | <440 ms (rate-adjusted) |
| U wave | Possibly His-Purkinje repolarization | Low amplitude, follows T |
Key concept: The QRS complex is similar in duration to the P wave despite the larger ventricular mass, because conduction velocity in the His-Purkinje system is much faster than in the atrial conducting system.
3. Atrial Abnormalities (P-Wave Changes)
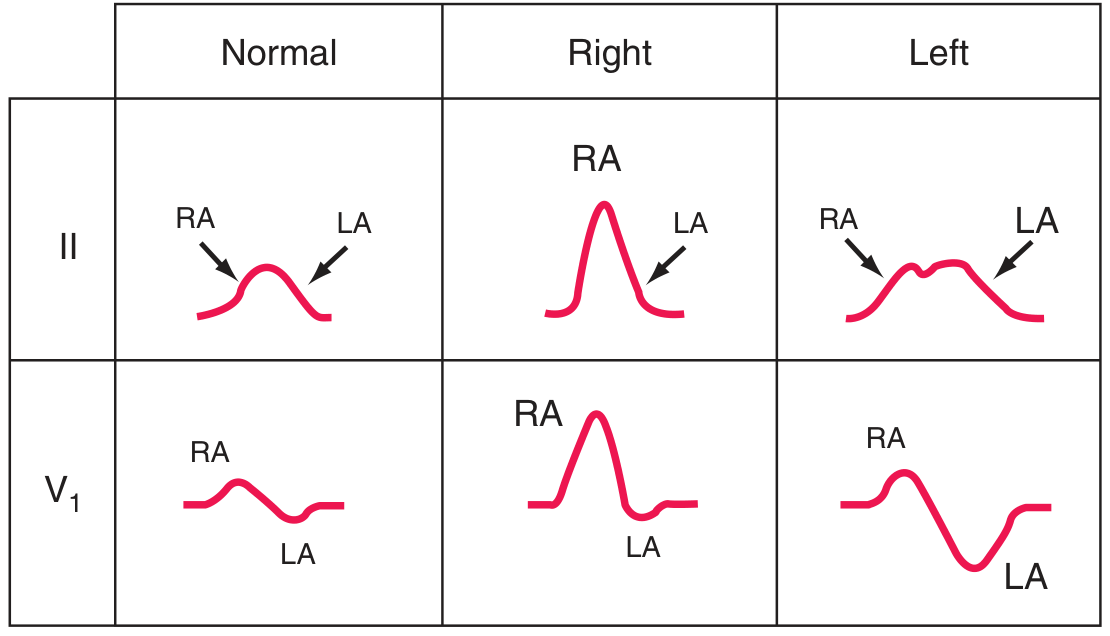
Right atrial (RA) overload = tall, peaked P waves ("P pulmonale"). Left atrial (LA) abnormality = broad, notched P waves in limb leads ("P mitrale"); biphasic P in V1 with prominent negative component.
Right Atrial Overload ("P pulmonale")
- Tall, peaked P waves >2.5 mm in leads II, III, aVF
- Seen in: pulmonary hypertension, cor pulmonale, tricuspid stenosis, COPD
Left Atrial Abnormality ("P mitrale")
- Broad (>120 ms), notched P waves in lead II
- Deep, wide negative terminal deflection in V1
- Seen in: mitral stenosis, LV failure, hypertension
4. Ventricular Hypertrophy
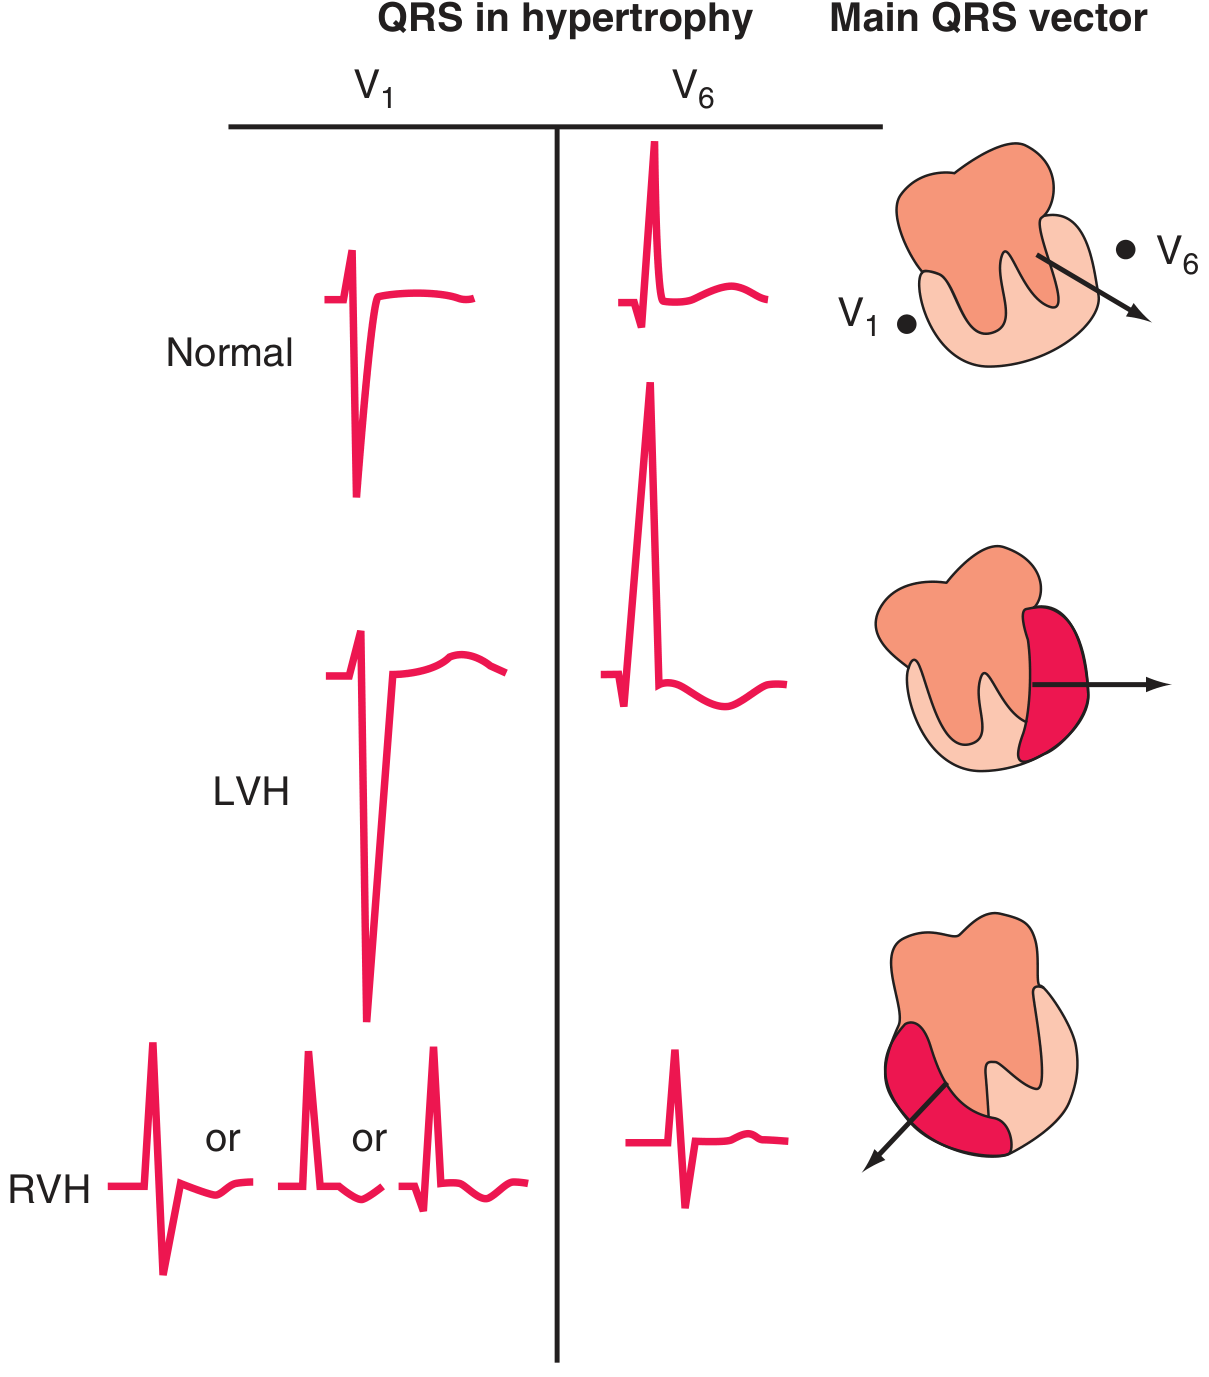
Left Ventricular Hypertrophy (LVH)
- Voltage criteria: SV1 + RV5 (or RV6) >35 mm (Sokolow-Lyon)
- Repolarization abnormality: ST depression + T-wave inversion in lateral leads (I, aVL, V5-V6) - the "strain pattern"
- QRS axis may shift leftward
- Causes: hypertension, aortic stenosis, hypertrophic cardiomyopathy
- Note: Prominent voltages can be a normal variant in young/athletic individuals
Right Ventricular Hypertrophy (RVH)
- Tall R wave in V1 (R > S in V1), deep S in V5-V6
- Right axis deviation (>+110°)
- T-wave inversions in V1-V4 (right "strain" pattern)
- Causes: pulmonary hypertension, pulmonary embolism, COPD, mitral stenosis, congenital heart disease
5. Myocardial Ischemia and Infarction
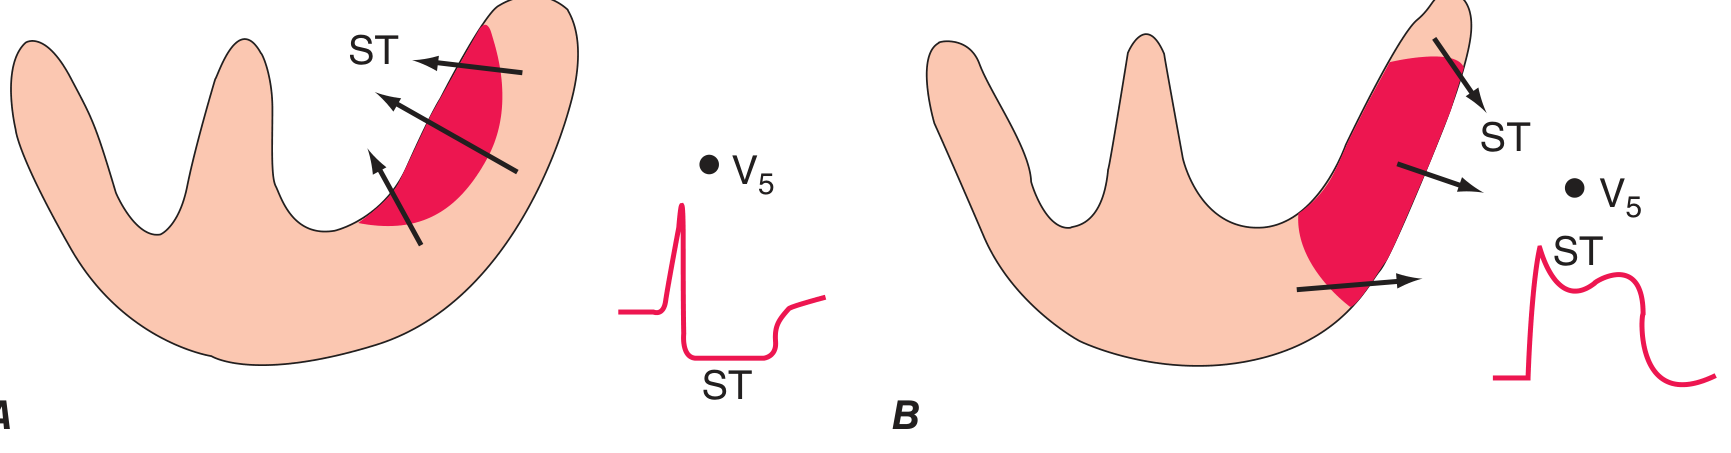
A: Subendocardial ischemia - ST vector points inward, causing ST depression in overlying leads. B: Transmural/epicardial ischemia - ST vector points outward, causing ST elevation.
ST-Elevation MI (STEMI)
Severe acute ischemia causes "currents of injury." The ECG territory localizes the culprit artery:
| Territory | Leads with ST Elevation | Culprit Artery |
|---|---|---|
| Anterior | V1-V6, I, aVL | Left anterior descending (LAD) |
| Inferior | II, III, aVF | Right coronary artery (RCA) |
| Lateral | I, aVL, V5-V6 | Left circumflex (LCx) |
| Posterior | ST depression V1-V3 (reciprocal) | RCA or LCx |
| Right ventricle | Right-sided leads (V3R-V4R) | Proximal RCA |
Evolution of Q-wave infarction:
- Hyperacute T waves (early, minutes)
- ST elevation (hours)
- Q wave formation (hours to days)
- T-wave inversion (days)
- Q waves may persist or normalize (weeks-months)
Non-STEMI / Subendocardial Ischemia
- ST depression in the ischemic zone
- ST elevation in aVR (reciprocal to diffuse subendocardial ischemia)
- Deep T-wave inversions in V1-V4 with high-grade LAD stenosis = Wellens syndrome (a "warning sign" ECG)
Wellens T-wave Sign
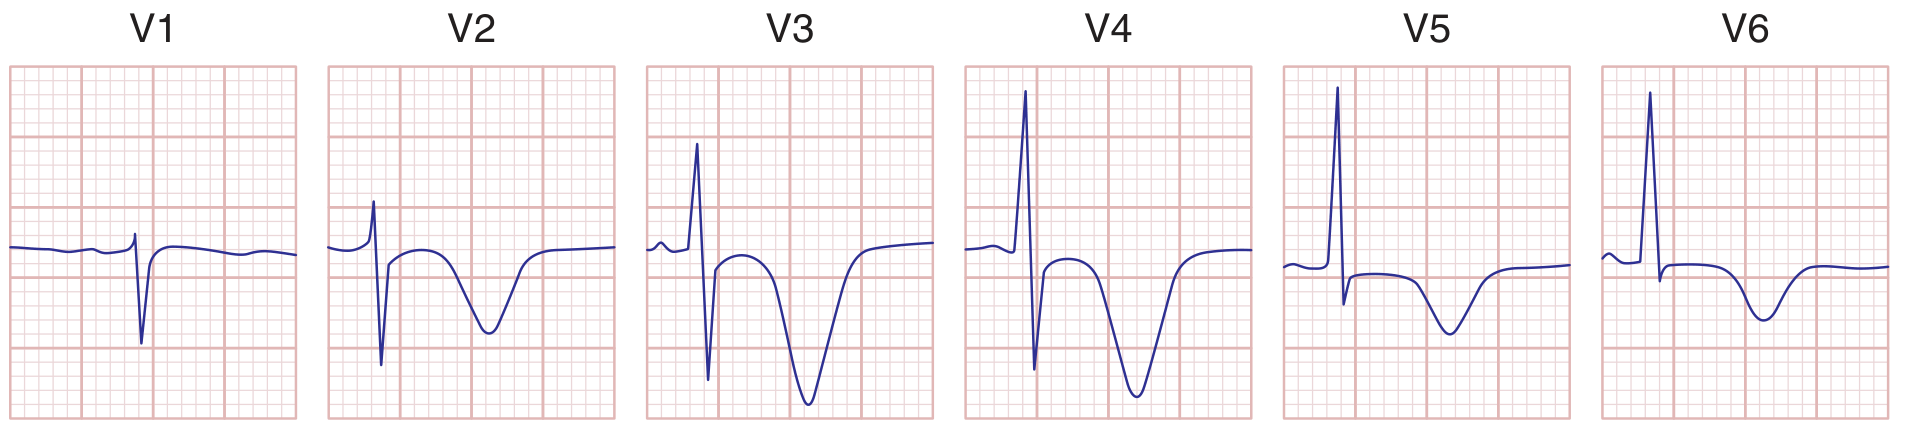
Deep precordial T-wave inversions V1-V4 = Wellens sign, indicating critical LAD stenosis requiring urgent intervention.
6. Conduction Abnormalities
AV Block
| Type | PR Interval | QRS dropped? | Mechanism | ECG Finding |
|---|---|---|---|---|
| 1st degree | >200 ms | No | Slow AV nodal conduction | Constant prolonged PR |
| 2nd degree Mobitz I (Wenckebach) | Progressively lengthens | Yes (periodically) | Incremental AV delay | PR lengthens until P not conducted; then resets |
| 2nd degree Mobitz II | Constant (normal or prolonged) | Yes (suddenly) | Infra-Hisian block | Constant PR, sudden dropped QRS; wide QRS common |
| 3rd degree (complete) | No relationship | All blocked | Complete AV dissociation | P and QRS independent; escape rhythm |
Clinical note: Mobitz II is more dangerous than Wenckebach and often requires pacemaker implantation. Complete AV block with a wide QRS escape rhythm indicates infra-Hisian disease and is a pacemaker indication.
Bundle Branch Blocks
Right Bundle Branch Block (RBBB):
- QRS >120 ms
- RSR' ("rabbit ears") in V1
- Wide S in I, V6
- Causes: normal variant, pulmonary embolism, RV pressure overload, atrial septal defect, ischemia
Left Bundle Branch Block (LBBB):
- QRS >120 ms
- Broad, notched R in I, aVL, V5-V6
- Deep S (or QS) in V1-V3
- No septal Q waves
- Causes: ischemia, cardiomyopathy, severe hypertension, fibrosis of conduction system
- LBBB + new chest pain = STEMI until proven otherwise (Sgarbossa criteria apply)
- LBBB masks ischemic changes and makes standard interpretation unreliable
Fascicular Blocks:
- Left anterior fascicular block: QRS axis more negative than -45° (marked left axis deviation)
- Left posterior fascicular block: right axis deviation >+110° after excluding RVH (very rare in isolation)
7. Arrhythmias
Atrial Fibrillation (AF)
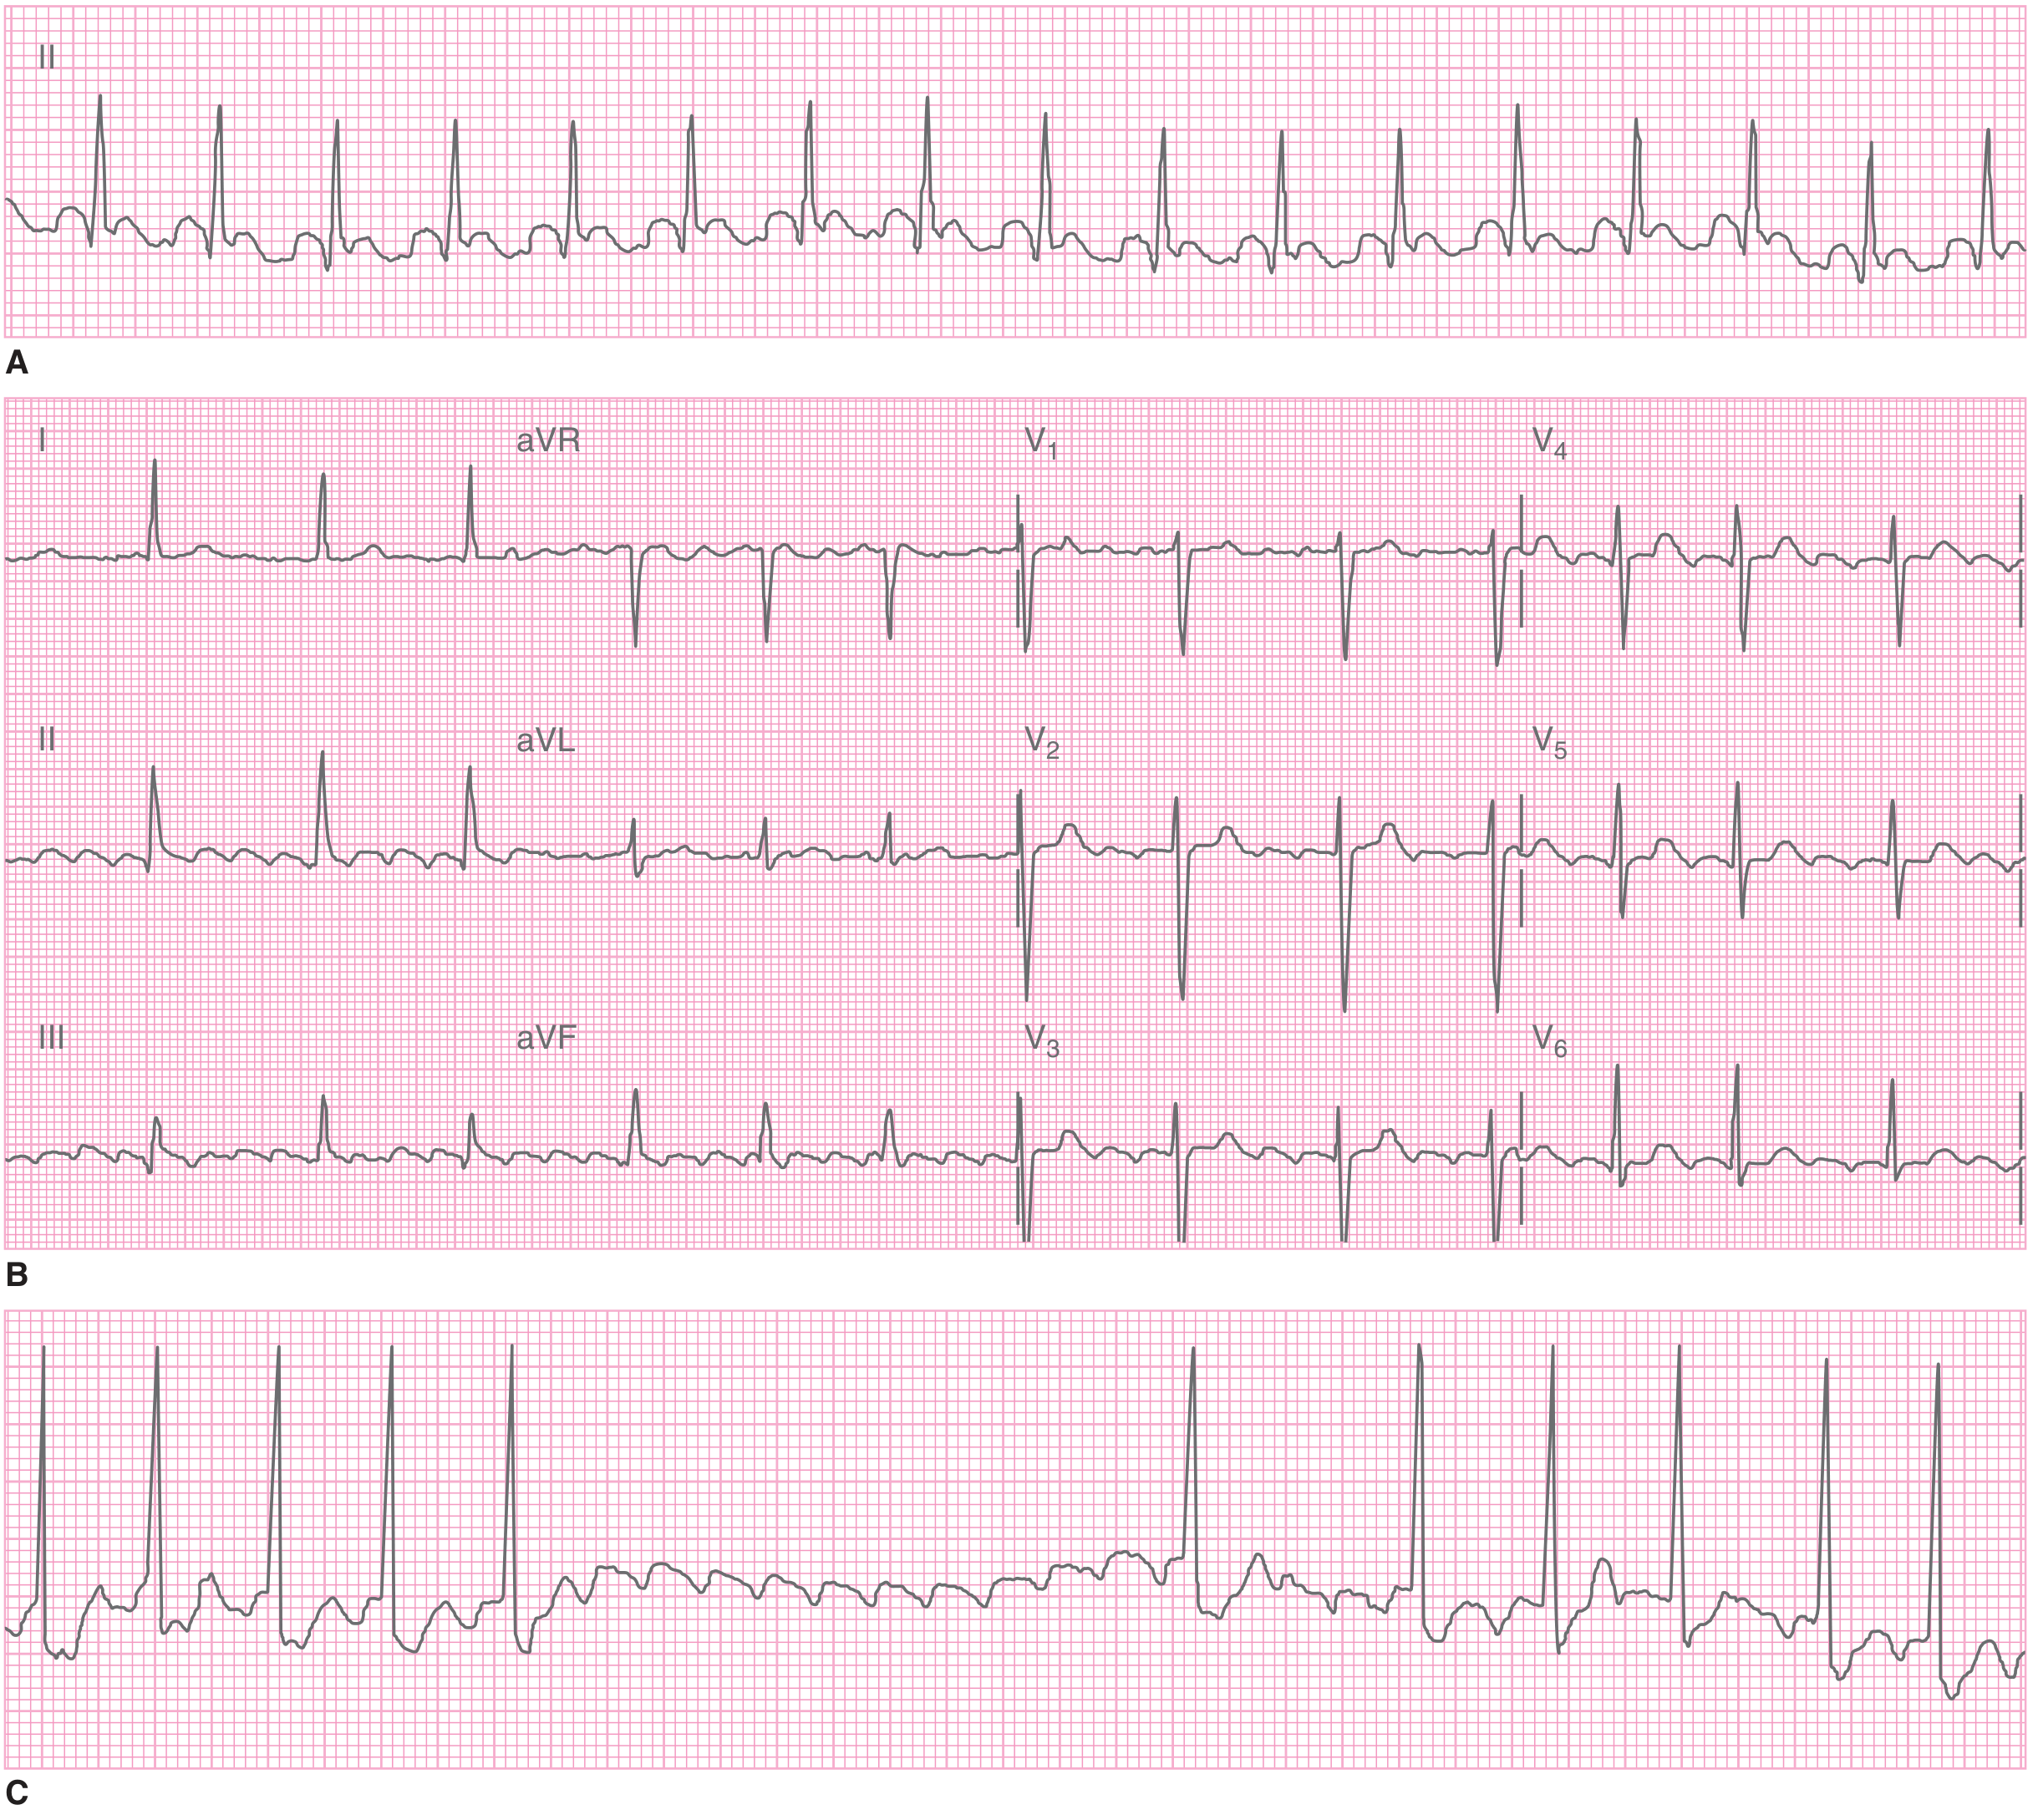
Atrial flutter with flutter waves best seen in II, III, aVF (C shows flutter waves unmasked by carotid sinus massage).
ECG features of AF:
- Absent P waves; flat or chaotic (fibrillatory) baseline
- Irregularly irregular ventricular rhythm
- Narrow QRS (unless bundle branch block or pre-excitation/WPW present)
Causes: ischemic heart disease, valvular disease, cardiomyopathy, alcohol ("holiday heart"), thyrotoxicosis, hypertension
Clinical consequences:
- Loss of atrial kick → heart failure in susceptible patients
- Rapid ventricular response → reduced filling time
- Thromboembolic risk (cardioembolic stroke) - risk increases dramatically if duration >48 hours before cardioversion
Atrial Flutter
- Regular saw-tooth flutter waves at ~300 bpm (negative in II, III, aVF)
- Usually 2:1 or 4:1 AV block → ventricular rate ~150 or ~75 bpm
- Carotid sinus massage slows ventricular rate, unmasking flutter waves
Paroxysmal Supraventricular Tachycardia (PSVT)
- Absent normal sinus P waves
- Retrograde P wave (inverted, just before or after QRS)
- Narrow QRS, regular rate (150-250 bpm)
Ventricular Tachycardia (VT)
- Wide QRS (>120 ms), rate >100 bpm
- AV dissociation (P waves independent of QRS)
- Fusion beats and capture beats (pathognomonic)
- May degenerate to ventricular fibrillation (VF)
8. Cor Pulmonale / Pulmonary Embolism
Acute PE ECG findings (often subtle or just sinus tachycardia):
- S1Q3T3 pattern: S wave in I, Q wave in III, T-wave inversion in III
- Right axis deviation
- Right bundle branch block (new)
- Sinus tachycardia (most common arrhythmia)
- ST-T changes in V1-V4 (can mimic anterior infarction)
Chronic cor pulmonale (COPD):
- Low-voltage complexes (due to hyperinflation)
- Slow R-wave progression (diminished r waves V1-V3)
- P pulmonale in inferior leads
9. Other Disease-Specific ECG Patterns
| Disease | Key ECG Finding |
|---|---|
| Hyperkalemia | Peaked T waves (early) → wide QRS → sine wave → asystole |
| Hypokalemia | Flattened T waves, prominent U waves, QT prolongation |
| Hypercalcemia | Short QT interval |
| Hypocalcemia | Prolonged QT interval |
| Digoxin toxicity | Scooped ST depression ("Salvador Dali" pattern), PR prolongation, bradyarrhythmias |
| Wolff-Parkinson-White (WPW) | Short PR (<120 ms), delta wave, wide QRS (preexcitation); risk of AF with rapid ventricular response |
| Brugada syndrome | Coved ST elevation in V1-V2, RBBB-like pattern; risk of sudden cardiac death |
| Long QT syndrome | QTc >440-460 ms; risk of torsades de pointes |
| Pericarditis | Diffuse concave ST elevation, PR depression in most leads; no reciprocal changes (except aVR) |
| Hypothermia | Osborn (J) waves; bradycardia |
| Tricyclic antidepressant toxicity | Widened QRS, right axis deviation, prolonged QT |
10. Key Limitations of ECG
- A single normal ECG does not exclude ischemia - serial ECGs are essential
- LBBB, electronic pacemakers, and WPW can mask ischemic changes entirely
- LVH with strain can mimic STEMI (pseudo-infarction pattern)
- Computerized ECG analyses should not be accepted without careful clinician review
- ECG changes in acute PE and anterior STEMI can mimic each other
References:
- Harrison's Principles of Internal Medicine 22E (2025), Chapter 247
- Tintinalli's Emergency Medicine (Comprehensive Study), Chapters 18, 49
- Fuster and Hurst's The Heart, 15th Edition, Chapters 38
- Pfenninger & Fowler's Procedures for Primary Care, 3rd Edition, Chapter 5
- Costanzo Physiology 7th Edition, Chapter 4
This is a shared conversation. Sign in to Orris to start your own chat.