


+4 more
Interpret these mri whole abdomen reports
I'll analyze all four MRI films simultaneously for this patient.
Searching sources...
analyse_media
analyse_media
analyse_media
analyse_media
Here is a structured interpretation of all four MRI films for Pronob Kumar Roy, 80-year-old male (Patient ID: SARL/0007900, Suraksha - Kolkata Medical College), acquired on a Philips scanner.
Patient & Technical Overview
- Study: MRI Whole Abdomen and Pelvis (multiplanar, multisequence)
- Sequences visible: T2-weighted axial, T1-weighted axial (pre- and post-contrast dynamic phases - arterial/portal venous/delayed), coronal T2/SPAIR fat-suppressed, sagittal T2, and likely DWI/ADC
- Films: 6 sheets total covering axial upper abdomen, axial pelvis, coronal abdomen/pelvis, and sagittal pelvis
Key Findings by Region
1. Large Left Upper Quadrant / Splenic Mass (Most Significant Finding)
- There is a massive, heterogeneous, lobulated mass in the left upper quadrant, appearing to arise from or completely replace the spleen
- T2W: Highly heterogeneous - areas of high signal (necrosis/cystic degeneration) mixed with hypointense solid components
- Post-contrast T1W: Peripheral and septal enhancement with large central non-enhancing zones indicating central necrosis/liquefaction
- The mass causes significant mass effect:
- Displaces the stomach medially/anteriorly
- Compresses and displaces the left kidney inferiorly
- Displaces the pancreatic body/tail anteriorly
2. Liver
- Mild to moderate hepatomegaly present
- Multiple hypoenhancing focal lesions scattered through both hepatic lobes on dynamic contrast images - highly suspicious for metastatic deposits
- No obvious intrahepatic biliary dilatation on available views
3. Kidneys
- Right kidney: Normal size, position, and corticomedullary differentiation
- Left kidney: Displaced inferiorly by the overlying splenic mass, upper pole mildly compressed
- Mild fullness of renal pelves may be present secondary to bladder outlet obstruction
4. Retroperitoneal Lymphadenopathy
- Prominent para-aortic and retroperitoneal soft tissue enlargement consistent with lymphadenopathy - suggests regional lymph node involvement (metastatic or lymphomatous)
- Pelvic lymph nodes (iliac chains) also appear enlarged with rounded morphology on T2 sequences
5. Prostate Gland (Pelvis - Films 2, 3, 4)
- Marked prostatomegaly with median lobe hypertrophy projecting into the bladder base
- Heterogeneous signal on T2W images - BPH nodularity present, but ill-defined T2-hypointense areas in the peripheral zone cannot exclude concurrent prostatic carcinoma without dedicated mpMRI/PI-RADS scoring
- The enlarged prostate is suspicious as a potential primary site given the bone marrow changes (see below)
6. Urinary Bladder
- Partially filled; wall thickening and trabeculation consistent with chronic bladder outlet obstruction (detrusor hypertrophy) from prostatic enlargement
- No gross intravesical mass clearly seen
7. Bone Marrow Signal (Pelvis and Lumbar Spine)
- Patchy heterogeneous marrow signal in the pelvic bones (iliac wings, sacrum, pubic symphysis), femoral heads, and lower lumbar vertebrae
- Areas of T2-hypointensity (dark foci) in the marrow are suspicious for osteoblastic metastases - this pattern is classically associated with metastatic prostate carcinoma
- Degenerative osteophytic changes consistent with age are also present
8. Rectum / Bowel
- No gross circumferential rectal wall thickening or exophytic rectal mass
- Sigmoid colon and small bowel loops appear normal in configuration
- No mechanical obstruction identified
9. Ascites
- Mild to moderate free peritoneal fluid (ascites) in perihepatic space and paracolic gutters - seen as T2-bright fluid on axial sequences
Differential Diagnosis
Given the overall picture (80-year-old male, massive splenic/LUQ mass, hepatic lesions, retroperitoneal lymphadenopathy, prostatomegaly, bone marrow changes, ascites), the top differentials are:
| Priority | Diagnosis | Reasoning |
|---|---|---|
| 1st | Metastatic Prostate Cancer (primary) with splenic, hepatic, nodal, and bone metastases | Age, male sex, prostatomegaly, osteoblastic bone marrow signal, pelvic nodal involvement |
| 2nd | Splenic Lymphoma (primary or systemic) | Massive splenic mass with necrosis, retroperitoneal LN involvement, hepatomegaly with lesions |
| 3rd | Splenic Angiosarcoma | Rare but aggressive; large necrotic splenic mass with liver metastases in elderly |
| 4th | Metastasis to spleen from unknown primary | Less common but possible with concurrent liver metastases |
Recommended Next Steps
- Serum PSA (Prostate-Specific Antigen) - urgent, to evaluate for metastatic prostate cancer
- Tumor markers: LDH (lymphoma), CEA, CA 19-9, AFP
- Dedicated prostate mpMRI (DWI + DCE sequences) with formal PI-RADS scoring if prostate cancer is the leading diagnosis
- Bone scan / PSMA PET-CT - to evaluate extent of bone and nodal metastases
- Image-guided biopsy - of a liver lesion or accessible node for histopathological confirmation
- Hematology/oncology referral - for staging workup and treatment planning
Important disclaimer: This interpretation is based on photographic images of printed MRI films and is intended as a clinical aid only. A formal, definitive report must be issued by a qualified radiologist reviewing the original DICOM data on a diagnostic workstation. Clinical correlation with the treating physician is mandatory before any management decisions are made.
Is there sign of haemochromatosis
On MRI, haemochromatosis classically causes diffuse low signal (dark) liver parenchyma on T2* and T1 sequences due to iron deposition, often with a characteristic "black liver" appearance. The spleen is typically spared in primary haemochromatosis but dark in secondary (transfusional) iron overload.
Searching sources...
Reading File
analyse_media
analyse_media
Haemochromatosis Assessment - Pronob Kumar Roy
Short Answer: No MRI signs of haemochromatosis are present.
What to Look for on MRI in Haemochromatosis
Iron deposits cause strong T2 susceptibility effects*, making affected organs appear diffusely dark/signal void - the classic "black liver" sign. Key patterns:
| Pattern | Primary Haemochromatosis | Secondary (Transfusional) Iron Overload |
|---|---|---|
| Liver | Diffusely dark (black) | Diffusely dark |
| Spleen | Spared (normal signal) | Also dark |
| Pancreas | Can be dark (iron deposits) | Usually spared |
| Muscle reference | Liver darker than paraspinal muscle | Same |
The most sensitive sequences are T2 gradient echo* and in-phase/opposed-phase imaging. Standard T2W spin-echo can miss mild/early disease.
What the Films Show for This Patient
Liver signal:
- The liver parenchyma retains a normal intermediate-to-bright signal on T2W sequences
- It is NOT darker than the paraspinal muscles - the hallmark "black liver" is absent
- No signal void is seen in the hepatic parenchyma
Spleen signal:
- Maintains normal T2-hyperintense signal (brighter than liver) - no abnormal darkening
Pancreas signal:
- No signal void or abnormal hypointensity suggesting pancreatic iron deposition
Conclusion
There is no MRI evidence of haemochromatosis or significant hepatic/systemic iron overload in this study. The liver and spleen signals are within normal limits relative to skeletal muscle on the available sequences.
Important caveat: The films shown are printed photographic images of standard T2W and T1W sequences. Quantitative T2 mapping or multi-echo gradient echo (GRE) sequences* - which are the gold standard for detecting early or mild iron overload - are not clearly identifiable on these printed films. If haemochromatosis is clinically suspected (family history, elevated serum ferritin, transferrin saturation >45%), dedicated liver iron quantification on DICOM workstation review (or MRI R2* mapping / FerriScan) should be specifically requested. Correlation with serum ferritin and transferrin saturation is also recommended.
How to diagnose haemochromatosis
Finding Sources
Searching PubMed
"haemochromatosis" AND "diagnosis"
Reading File
Reading File
Reading Article
PMID: 35662478
Loading Image
Loading Image
Loading Image
Diagnosis of Haemochromatosis
(Sources: Grainger & Allison's Diagnostic Radiology; EASL Clinical Practice Guidelines 2022 [PMID: 35662478])
Overview
Haemochromatosis is a disorder of iron metabolism causing progressive iron loading, predominantly in the liver. There are two forms:
- Primary (hereditary): Genetic error (HFE gene mutation - most commonly p.Cys282Tyr homozygosity) causing excess GI iron absorption - iron accumulates in hepatocytes
- Secondary (haemosiderosis): From multiple transfusions, cirrhosis, or refractory anaemia - iron accumulates in the RES (Kupffer cells, spleen, bone marrow)
Step-by-Step Diagnostic Approach
Step 1 - Clinical Suspicion
Classic presentation in a 40-60 year old male with the triad:
"Bronze Diabetic" = Skin bronzing (pigmentation) + Cirrhosis + Diabetes mellitus
Other features:
- Arthropathy (MCP joints, index/middle fingers)
- Hypogonadism, cardiac failure, fatigue
- Family history of liver disease
Step 2 - Serum Iron Studies (First-line)
| Test | Haemochromatosis Threshold |
|---|---|
| Transferrin Saturation (TSAT) | >45% in females; >50% in males - key screening test |
| Serum Ferritin | >200 µg/L (females); >300 µg/L (males/postmenopausal) |
| Serum iron | Elevated |
| TIBC | Reduced |
TSAT is the single best screening test - elevated in early disease before ferritin rises significantly.
Step 3 - Genetic Testing (HFE Mutation)
In patients with raised TSAT + elevated ferritin:
- Test for HFE C282Y and H63D mutations
- C282Y homozygosity (the most common genotype) + abnormal iron studies = diagnosis confirmed without biopsy
- No need for liver biopsy or MRI if C282Y homozygous with consistent iron parameters
Step 4 - MRI (When Needed)
Indicated for patients with high TSAT + elevated ferritin but non-C282Y/non-HFE genotypes, or for quantification of hepatic iron.
MRI signs of haemochromatosis:
The key finding is the "black liver" - diffusely reduced hepatic signal due to iron's T2* susceptibility effect:
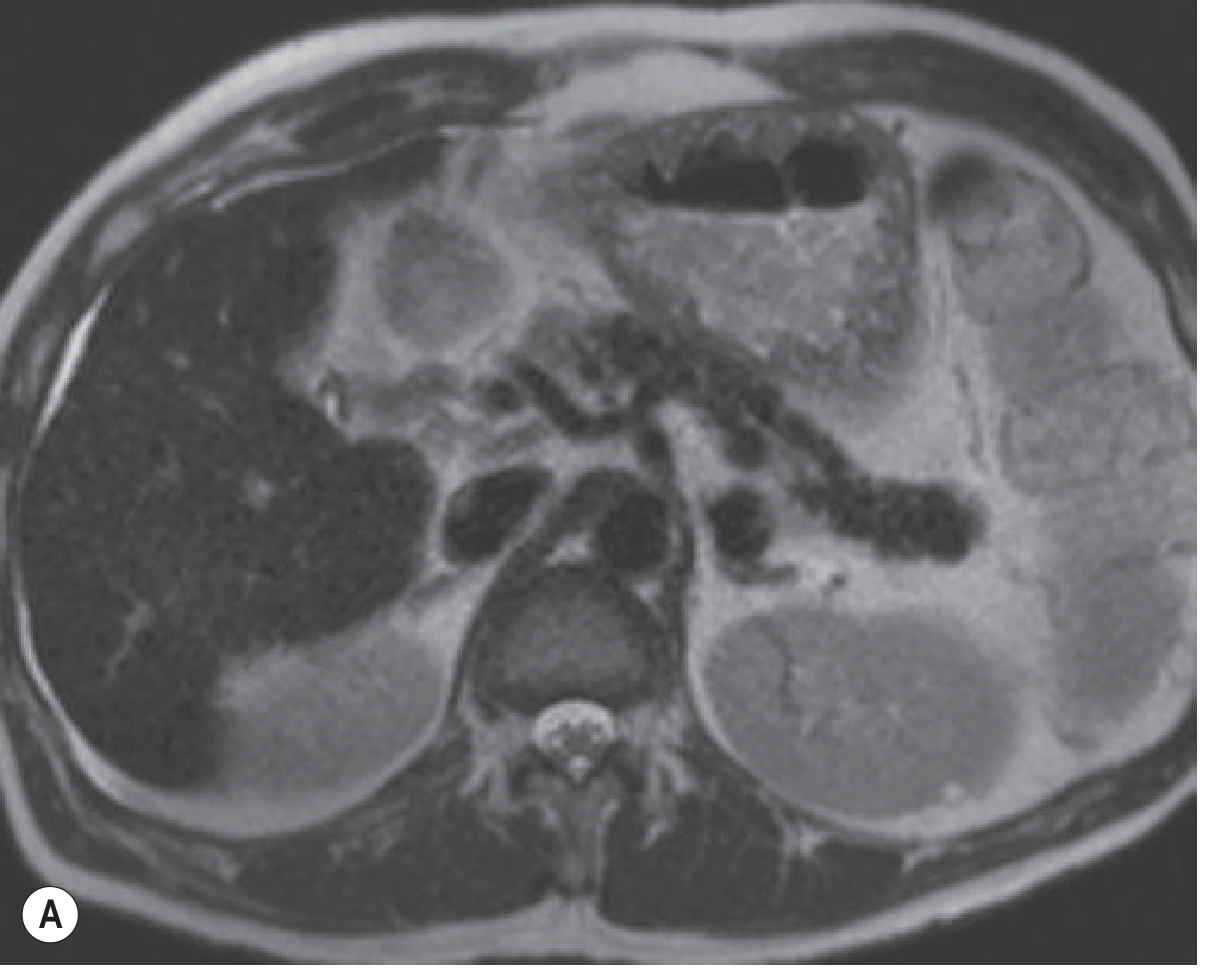
Fig A - T2W MRI showing the dark liver (haemochromatosis-related cirrhosis)
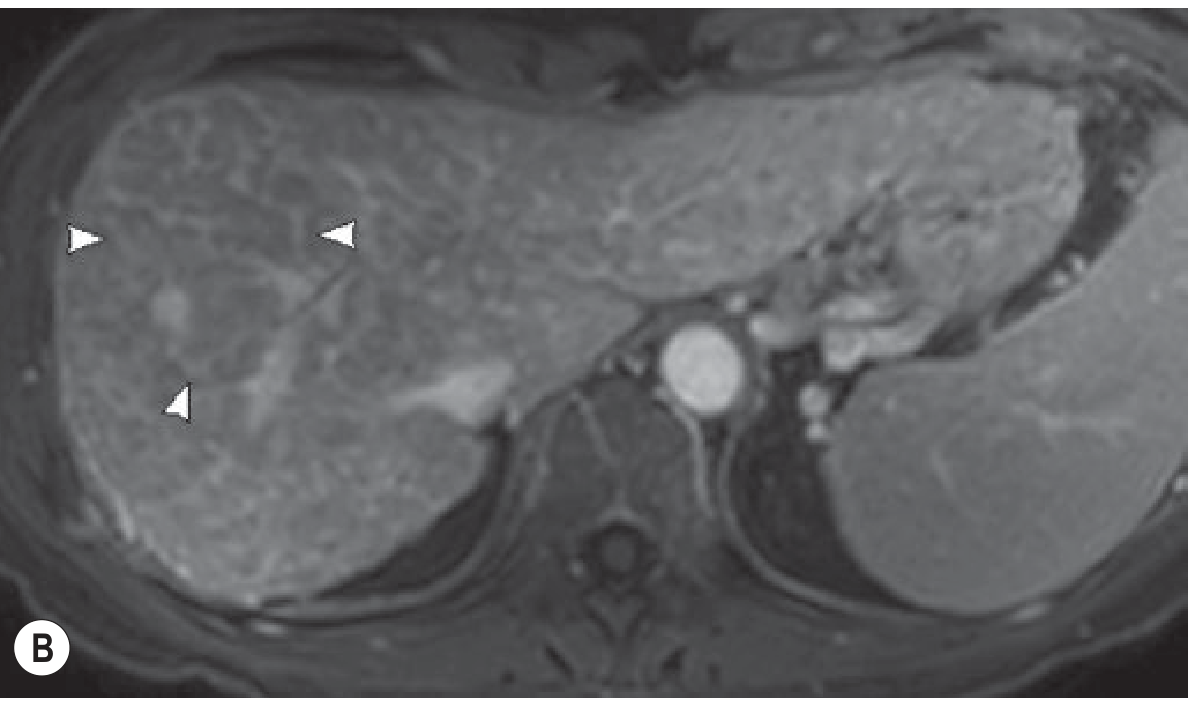
Fig B - In-phase GRE T1W: liver signal lower than paraspinal muscle. The pancreas also appears dark - pathognomonic for primary haemochromatosis.
MRI findings summarised:
| Feature | Primary Haemochromatosis | Secondary (Haemosiderosis) |
|---|---|---|
| Liver | Diffusely dark (< muscle signal) | Diffusely dark |
| Spleen | Normal signal (spared) | Also dark |
| Pancreas | Dark - pathognomonic | Usually spared |
| Bone marrow | May show iron deposits | Dark |
- Best sequence: T2 gradient-echo (GRE)* - most sensitive
- Standard T2W spin-echo also shows changes with significant overload
- Severe overload even affects T1W images
- Quantitative MRI (R2 mapping / FerriScan):* correlates strongly with hepatic iron concentration - allows non-invasive iron quantification
Unenhanced CT: Hepatic iron deposition raises attenuation >75 HU (vs normal ~60 HU)
Step 5 - Liver Biopsy (Selective Use)
- No longer routinely required if C282Y homozygous
- Indicated when:
- Non-HFE genotype with hepatic iron overload on imaging
- Ferritin >1000 µg/L (to assess for advanced fibrosis/cirrhosis)
- Histology shows Perls' Prussian blue stain - blue iron deposits in hepatocytes (periportal, zone 1 distribution in primary haemochromatosis)
Step 6 - Assess End-Organ Damage
Once diagnosed, evaluate for complications:
- Liver: Fibroscan or biopsy for fibrosis staging; if advanced fibrosis → HCC surveillance programme (6-monthly ultrasound + AFP)
- Cardiac: ECG, echocardiogram
- Endocrine: HbA1c, testosterone, thyroid function
- Joints: X-ray hands (MCP joints)
Classic X-ray finding - Hook osteophytes on radial aspects of 2nd and 3rd MCP heads:
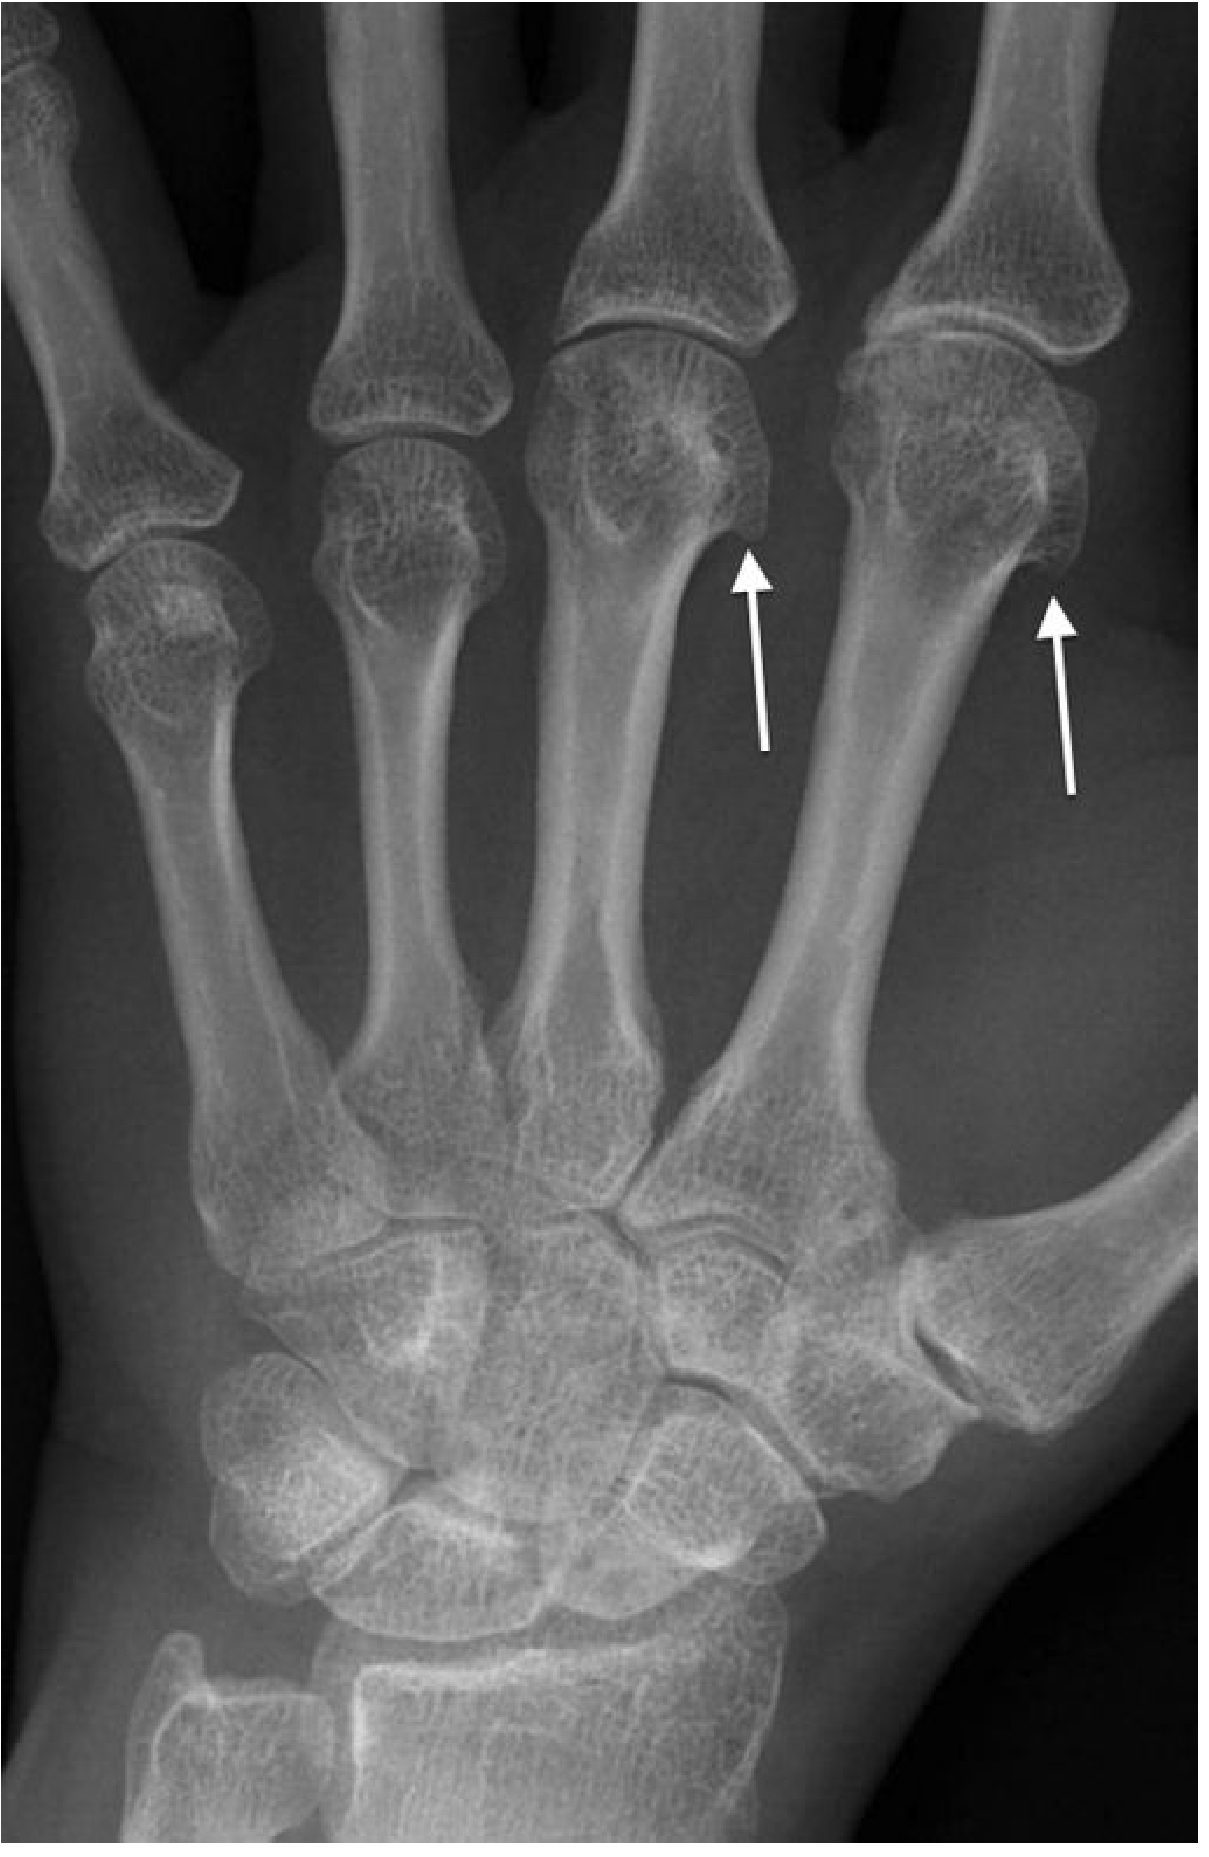
Hook osteophytes at 2nd/3rd MCP joints - joint pattern spares IP joints (unlike OA)
Step 7 - Family Screening
First-degree relatives of confirmed cases should have:
- Serum iron studies (TSAT + ferritin)
- HFE genotyping
Summary Diagnostic Algorithm
Raised TSAT (>45/50%) + Elevated Ferritin
↓
HFE Genotyping
↓
C282Y Homozygous? ──YES──→ Diagnosis confirmed
NO/Compound het.
↓
MRI Liver (R2* mapping)
↓
Hepatic iron overload confirmed? ──YES──→ Diagnosis confirmed
↓
Consider liver biopsy (non-HFE genotype)
Treatment Target (per EASL 2022)
Phlebotomy is the mainstay of treatment:
- Induction phase: Target ferritin <50 µg/L
- Maintenance phase: Target ferritin <100 µg/L
Early diagnosis and treatment prevents cirrhosis, HCC, diabetes, and arthropathy.
- Grainger & Allison's Diagnostic Radiology, p. 628
- EASL Clinical Practice Guidelines on Haemochromatosis, J Hepatol 2022
Echo finding of haemochromatosis
Haemochromatosis causes iron deposition in the myocardium, leading to a restrictive or dilated cardiomyopathy. On echocardiography, the classic findings include increased myocardial echogenicity ("sparkling"), diastolic dysfunction, and eventually systolic dysfunction with reduced EF.
Searching sources...
Finding Sources
Finding Sources
Searching PubMed
"haemochromatosis" AND "echocardiography"
Reading File
Finding Sources
Searching PubMed
"iron overload" AND "cardiomyopathy" AND "echocardiography"
Reading Article
PMID: 39145627
Reading Article
PMID: 33772457
Finding Sources
Echocardiographic Findings in Haemochromatosis
(Sources: Grainger & Allison's Diagnostic Radiology; Fuster & Hurst's The Heart 15th ed; Gera et al., Cardiology in Review 2024 [PMID: 39145627]; Zimmerman et al., J Echocardiogr 2021 [PMID: 33772457])
Pathophysiology
Iron deposits in myocardial cells (not Kupffer cells as in transfusional overload), causing:
- Oxidative stress and lipid peroxidation → myocyte damage
- Impaired calcium handling → diastolic then systolic dysfunction
- Myocardial fibrosis → increased wall stiffness
- Conduction system iron deposits → arrhythmias
The cardiomyopathy of haemochromatosis evolves through distinct stages, making serial echo monitoring essential.
Echocardiographic Findings by Stage
Stage 1 - Subclinical / Early (Most Treatable)
These changes precede symptoms and are often only detectable with advanced echo techniques:
| Finding | Detail |
|---|---|
| Normal LV dimensions and wall thickness | Wall thickness is typically normal (unlike amyloid which causes thickening) |
| Diastolic dysfunction (Grade I) | Impaired relaxation - earliest detectable echo change |
| Subclinical LV longitudinal strain reduction | Detected by Global Longitudinal Strain (GLS) on speckle tracking echocardiography (STE) - abnormal before EF drops |
| Left atrial enlargement | Reflects chronic diastolic filling pressure elevation |
Key point: Speckle tracking GLS is the most sensitive early echo marker - it detects subclinical myocardial dysfunction even with preserved EF and has been shown to equal or outperform CMR for early functional changes.
Stage 2 - Established Restrictive Pattern
Haemochromatosis is a recognised cause of restrictive cardiomyopathy (RCM):
| Finding | Detail |
|---|---|
| Biatrial enlargement | Both LA and RA enlarged - hallmark of restriction |
| Normal or mildly reduced LV dimensions | Ventricles not typically dilated at this stage |
| Normal or reduced wall thickness | Unlike amyloid (thick walls) or hypertensive disease |
| Normal or mildly reduced EF | Systolic function relatively preserved initially |
| Restrictive filling pattern on Doppler | ↑ E velocity, short deceleration time (<150 ms), ↓ A velocity, E/A ratio >2 |
| Elevated E/e' ratio | Reflects raised filling pressures (>14 is abnormal) |
| Inferior vena cava (IVC) dilation | Reflects elevated right-sided pressures |
Stage 3 - Dilated Cardiomyopathy Pattern (Late / Advanced)
With progressive iron deposition and myocardial fibrosis:
| Finding | Detail |
|---|---|
| LV dilation | Increased end-diastolic diameter |
| Reduced LVEF (<50%) | Global systolic dysfunction - poor prognosis |
| Wall motion abnormalities | Global hypokinesia (not regional as in ischaemia) |
| Pulmonary hypertension | Elevated RVSP on tricuspid regurgitation jet |
| RV dysfunction | TAPSE reduced, RV dilation |
| Functional mitral/tricuspid regurgitation | Secondary to chamber dilation |
Comparison: Haemochromatosis vs Other Infiltrative Cardiomyopathies
| Feature | Haemochromatosis | Amyloidosis | Sarcoidosis |
|---|---|---|---|
| Wall thickness | Normal/thin | Thick ("hypertrophy") | Normal or focally thick |
| Granular sparkling | Absent | Present ("starry sky") | Absent |
| LV cavity | Normal → dilated | Normal/reduced | Normal/regional wall motion abnormality |
| Pattern | Restrictive → Dilated | Restrictive | Focal/regional |
| CMR LGE | Subepicardial/diffuse | Subendocardial/diffuse | Mid-wall/patchy |
| Diastolic function | Abnormal | Abnormal (pseudonormal/restrictive) | Variable |
ECG Correlation (to complement Echo)
- Conduction defects: First-degree AV block, bundle branch blocks, complete heart block
- Supraventricular arrhythmias: AF is common (10-30% of cases)
- Ventricular arrhythmias: PVCs, VT - major cause of sudden death
- Low voltage QRS (when myocardial involvement is severe)
- ST-T changes (non-specific)
Role of Cardiac MRI vs Echo
| Modality | Strength |
|---|---|
| Echo (standard) | Widely available, serial monitoring of EF and diastolic function |
| Echo with GLS (speckle tracking) | Most sensitive for subclinical dysfunction, can match CMR for early changes |
| Cardiac MRI (T2 mapping)* | Gold standard - quantifies myocardial iron; T2* <20ms indicates iron overload; T2* <10ms indicates severe overload with high arrhythmia risk |
| CMR LGE | Detects fibrosis; predicts adverse outcomes |
When to Do Echo in Haemochromatosis
Per current guidance:
- At diagnosis - establish baseline cardiac function
- Before starting phlebotomy - if severe iron overload, rapid phlebotomy can worsen cardiac function transiently
- Serial monitoring - every 1-2 years (more frequent if cardiac symptoms develop)
- After adequate treatment - cardiac function can partially or fully recover with early phlebotomy/chelation therapy, which is a distinguishing feature from most other causes of cardiomyopathy
Important note: Cardiac involvement in haemochromatosis is often asymptomatic until late. When symptomatic heart failure develops, median survival without treatment is under 1 year. Early echo screening is therefore clinically critical.
- Grainger & Allison's Diagnostic Radiology, p. 323
- Cardiac Manifestations of Hemochromatosis - Gera et al., Cardiol Rev 2024 [PMID: 39145627]
- Echocardiography for Iron Overload Cardiomyopathy - Zimmerman et al., J Echocardiogr 2021 [PMID: 33772457]
This is a shared conversation. Sign in to Orris to start your own chat.