
Cardioverson vs defibrillator 10 marks question answer in md Anaesthesia with some explanation
cardioversion defibrillation ECG waveform synchronization R wave
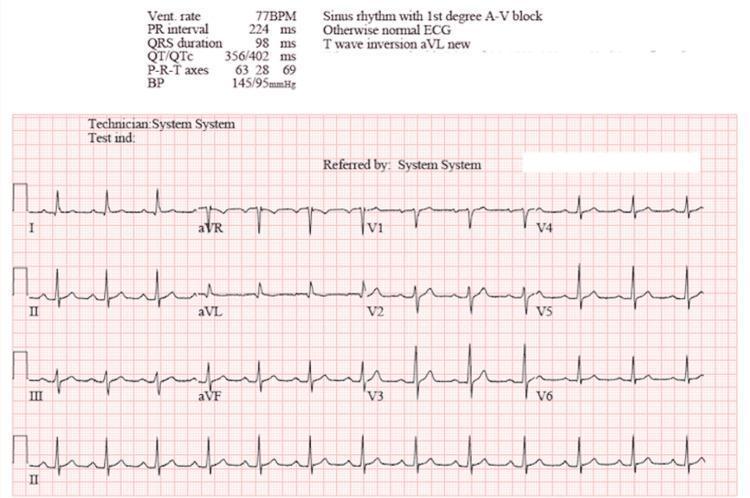
A standard 12-lead electrocardiogram (ECG) printed on red-grid paper, demonstrating a normal sinus rhythm following cardioversion. The diagnostic header indicates a ventricular rate of 77 BPM and a blood pressure of 145/95 mmHg. Key waveform findings include a prolonged PR interval of 224 ms, diagnostic of a first-degree atrioventricular (AV) block. The QRS complex duration is within normal limits at 98 ms, and the QT/QTc intervals are measured at 356/402 ms. Morphologically, P waves are present and consistent across leads, followed by narrow QRS complexes. A notable finding is T-wave inversion in lead aVL. The P-R-T axes are reported at 63, 28, and 69 degrees, respectively. The tracing includes limb leads (I, II, III, aVR, aVL, aVF) and precordial leads (V1-V6), with a continuous rhythm strip of lead II at the bottom. This image serves as a clinical example of post-cardioversion rhythm assessment and the presentation of a first-degree heart block.
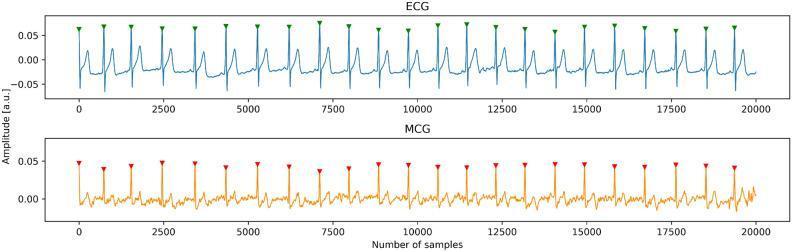
This Comparison Chart illustrates simultaneous cardiac signal recordings, comparing Electrocardiography (ECG) and Magnetocardiography (MCG) over a continuous sample range of 0 to 20,000 samples. The top panel displays the ECG waveform in blue, showing a clear rhythmic pattern characterized by prominent QRS complexes and distinct T waves, with amplitude ranging approximately between -0.05 and 0.05 arbitrary units (a.u.). The bottom panel displays the MCG waveform in orange, which tracks the cardiac rhythm synchronously with the ECG but exhibits a more complex, less defined morphology with amplitude fluctuations between roughly -0.02 and 0.05 a.u. Both signals are annotated with triangular fiducial markers—green for ECG and red for MCG—placed at the apex of each R-wave. These markers facilitate the analysis of temporal alignment and heart rate variability between the electric and magnetic manifestations of the cardiac cycle. This artifact-free recording is utilized in cardiology research to study the synchronization and morphological differences between bioelectric potentials and biomagnetic fields in healthy human subjects.
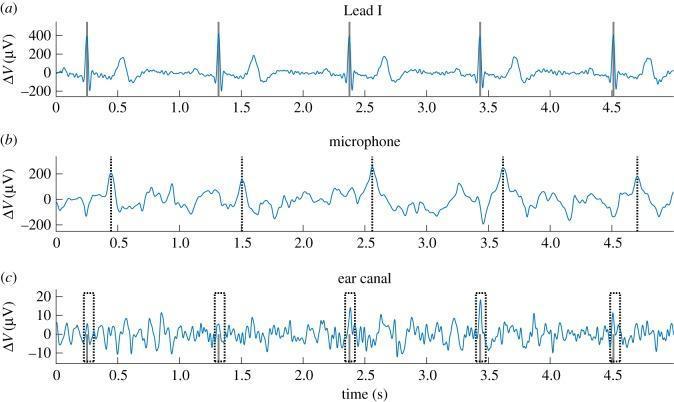
This Comparison Chart illustrates the synchronization of standard and alternative physiological signals for R-wave detection. The image consists of three vertically aligned time-series plots over a 5-second interval. Subplot (a) shows a standard Lead I Electrocardiogram (ECG) recorded from the arms, exhibiting clear P-QRS-T complexes with an R-wave amplitude range from -200 μV to +500 μV. Subplot (b) displays a mechanical plethysmogram recorded via an in-ear MEMS microphone, where periodic maxima represent arterial pulse arrivals in the ear canal. Subplot (c) shows the 'ear-ECG' signal with a significantly lower amplitude (-15 to +20 μV) and higher noise floor. Vertical markers demonstrate the temporal relationship between the standard R-wave (Lead I) and the corresponding signals in the ear canal. This comparison highlights the educational concept of using co-located mechanical sensors (microphone) to define a search window for identifying low-SNR electrical signals (ear-ECG) in wearable health-monitoring applications.
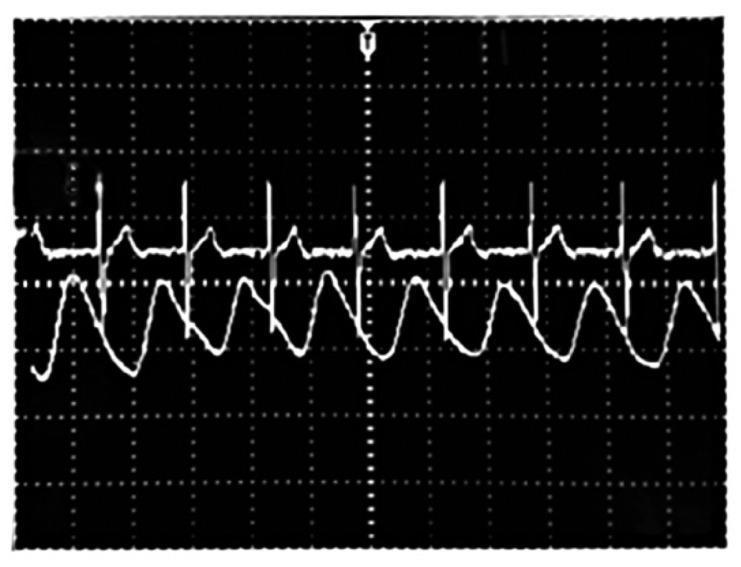
This diagnostic image displays a dual-channel waveform comparison on a gridded oscilloscope-style background, representing physiological monitoring signals. The upper waveform is a standard Electrocardiogram (ECG) trace characterized by distinct, high-frequency R-wave spikes occurring at regular intervals, alongside smaller P and T waves. The lower waveform represents a heartbeat signal acquired via a fiber optic plethysmography system. This lower trace exhibits a larger amplitude with a smoother, sinusoidal morphology and a lower frequency relative to the ECG. The visual comparison demonstrates the temporal correlation between cardiac electrical activity (ECG) and the resulting mechanical pulsatile blood flow (plethysmogram), where each R-wave spike in the upper trace precedes a corresponding peak in the lower pulsatile wave. This visualization is used in biomedical engineering and clinical diagnostics to validate the accuracy of novel physiological sensors against gold-standard monitoring techniques like electrocardiography.
Cardioversion vs. Defibrillation
(10-Mark Answer - Anaesthesia)
Introduction
Definition
| Cardioversion | Defibrillation | |
|---|---|---|
| Definition | Delivery of a DC shock synchronized to the R wave of the QRS complex to convert a tachyarrhythmia with a pulse | Delivery of an unsynchronized (asynchronous) DC shock to depolarize a fibrillating or pulseless myocardium |
| Pulse present? | Yes - patient has a pulse | No - pulseless arrest |
| Nature of arrhythmia | Organised (regular or irregularly irregular) | Disorganised (chaotic) |
Mechanism
Indications
Cardioversion
- Atrial fibrillation (AF) - with haemodynamic compromise
- Atrial flutter
- Supraventricular tachycardia (SVT)
- Stable or unstable ventricular tachycardia (VT) with a pulse
Defibrillation
- Ventricular fibrillation (VF)
- Pulseless ventricular tachycardia (pVT)
- Rapid polymorphic VT (unsynchronized because QRS complexes are not discernible)
Contraindications
| Cardioversion | Defibrillation |
|---|---|
| Arrhythmias due to digitalis toxicity (risk of refractory VF) | Presence of a pulse |
| Sinus tachycardia (not an arrhythmia) | Asystole or PEA |
| Electrolyte imbalances (relative) | Obvious signs of death |
| Long-standing AF without adequate anticoagulation | Valid DNR order |
Energy Levels
Waveform Types
- Biphasic waveforms are preferred and recommended because they achieve defibrillation at significantly lower energies than monophasic waveforms, resulting in less myocardial injury. (Goldman-Cecil Medicine)
Adult Energy Doses
| Arrhythmia | Cardioversion | Defibrillation |
|---|---|---|
| VF / Pulseless VT | -- | 200 J biphasic (or 360 J monophasic); escalate if needed |
| AF | 120-200 J biphasic (start low) | -- |
| Atrial flutter / SVT | 50-100 J biphasic | -- |
| Stable VT with pulse | 100 J biphasic | -- |
Paediatric Doses
- Defibrillation: 2 J/kg initial; 4 J/kg for subsequent shocks; max 10 J/kg or adult dose
- Cardioversion: 0.5 J/kg initial, doubled if unsuccessful (Tintinalli's Emergency Medicine)
Technique / Procedure Steps
Common Steps (both procedures)
- Connect ECG leads and confirm rhythm
- Apply conductive gel/pads or self-adhesive electrodes
- Position paddles: right of sternum at 2nd ICS + left midaxillary line at 5th ICS (anterior-lateral)
- Alternatively: anterior-posterior position
- Ensure no one is touching the patient - call "clear"
- Charge and deliver shock
Specific to Cardioversion
- Enable SYNC mode on the defibrillator
- Confirm sync marker fires on R waves (visible on monitor)
- Press and hold the discharge button - it will wait for the next R wave before firing
- Failure to activate sync mode risks delivering the shock on the T wave, potentially converting the rhythm to VF
Specific to Defibrillation
- Turn sync mode OFF
- Charge as quickly as possible - minimize hands-off time
- Deliver shock immediately
- Resume CPR immediately after shock - do not await rhythm check
Anaesthesia Considerations
For Elective Cardioversion
- Patient is fasted (minimum 4-6 hours for solids)
- A short-acting anaesthetic agent is required because the shock is extremely painful
- Commonly used agents: Propofol (1-1.5 mg/kg IV), Etomidate (0.2-0.3 mg/kg - preferred in haemodynamically unstable patients), Midazolam + fentanyl (for conscious sedation in less unstable patients)
- Ketamine is another option (cardiovascular stimulant properties are useful in borderline patients)
- Supplemental oxygen via face mask
- Airway equipment and resuscitation drugs must be immediately available
- Anaesthesiologist/trained personnel must be present for sedation/anaesthesia
For Emergency Cardioversion/Defibrillation
- No pre-anaesthetic requirement - life-threatening emergency takes precedence
- Post-resuscitation anaesthesia/sedation may be needed if spontaneous circulation restores and patient regains consciousness
Patients with Cardiac Implantable Electronic Devices (CIEDs)
- Paddle/pad placement should be >8 cm from the generator, in anterior-posterior orientation when possible
- With modern bipolar leads, CIED malfunction during cardioversion is uncommon
- For patients with ICDs: remove the magnet first to re-enable the device's own antitachycardia therapy; only proceed with external shock if the ICD fails to terminate the arrhythmia
- After any external shock near a CIED, always re-interrogate the device and check pacing thresholds (Miller's Anesthesia, 10e)
Complications
| Complication | Notes |
|---|---|
| Thromboembolism | Cardioversion of AF/flutter - risk minimised by TEE exclusion of thrombus or 3 weeks anticoagulation pre-procedure |
| VF induction | If shock falls on T wave (failure to sync) or in setting of digitalis toxicity / electrolyte disturbance |
| Post-shock bradycardia/asystole | Treat with atropine 0.5-3 mg IV or transcutaneous pacing |
| Myocardial injury / troponin rise | Transient - rarely clinically significant |
| Chest wall burns | From poor electrode contact or repeated shocks |
| Injury to healthcare worker | If provider is in contact with patient during shock delivery |
Key Differences - Summary Table
| Feature | Cardioversion | Defibrillation |
|---|---|---|
| Timing | Synchronized (R wave) | Asynchronous |
| Pulse | Present | Absent |
| Rhythm | Organised | Disorganised (VF/pVT) |
| Consciousness | Awake - needs sedation/GA | Unconscious - no anaesthesia needed |
| Energy (adult) | 50-200 J | 200-360 J |
| CPR | Not required | Continued alongside |
| Sync mode | ON | OFF |
| Urgency | May be elective or emergent | Always emergent |
| Post AF duration >48h | Anticoagulate first | N/A |
Conclusion
- Miller's Anesthesia, 10e - Cardioversion and CIEDs
- Goldman-Cecil Medicine - Transthoracic Cardioversion and Defibrillation
- Roberts & Hedges' Clinical Procedures in Emergency Medicine - Defibrillation and Cardioversion (Chapter 12)
- Tintinalli's Emergency Medicine - Cardioversion, Defibrillation, and Pacing
Now make this pdf to on difference between cardioverson vs defibrillator 10 marks answer