
Graph of blood glucose after meal
Reading File
After a meal, blood glucose rises from a fasting baseline (~70-100 mg/dL), peaks at about 30-60 minutes (~140 mg/dL in healthy individuals), then returns to baseline within ~2 hours due to insulin secretion.
Searching sources...
Finding Sources
Finding Sources
Finding Sources
Finding Sources
Reading File
Finding Sources
Finding Sources
Searching the Web
blood glucose curve after meal normal postprandial response graph physiology
Loading Image
Finding Sources
Here is the postprandial blood glucose graph showing both the normal response and the diabetic response:
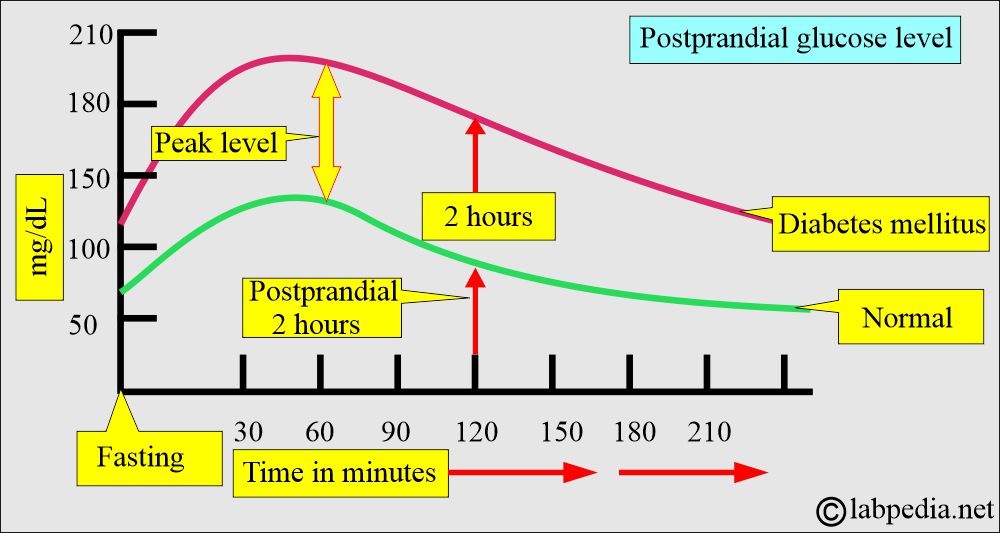
Blood Glucose After a Meal - Explained
Normal Physiology (Green Curve)
| Time Point | Blood Glucose |
|---|---|
| Fasting (0 min) | ~70-100 mg/dL |
| Peak (~60 min) | ~120-140 mg/dL |
| 2 hours post-meal | <140 mg/dL |
| 3-4 hours | Returns to fasting baseline |
What happens step by step:
- 0-30 min - Carbohydrates from the meal are digested and absorbed in the small intestine. Glucose enters the portal circulation, causing blood glucose to rise.
- 30-60 min - Blood glucose peaks. The pancreatic beta cells respond with a two-phase insulin release:
- First phase: Rapid burst of pre-formed insulin within 2-5 minutes of glucose sensing
- Second phase: Sustained insulin synthesis and release over the next 1-2 hours
- 60-120 min - Insulin drives glucose uptake into skeletal muscle, liver (glycogen synthesis), and adipose tissue. Blood glucose falls back toward baseline.
- 2+ hours - Blood glucose normalizes. Glucagon from alpha cells helps prevent overshoot into hypoglycemia.
The physiological delta (post-meal minus pre-meal) should be 0-50 mg/dL - Textbook of Family Medicine 9e.
Diabetic Response (Pink Curve)
In Type 2 Diabetes / Impaired Glucose Tolerance:
- The first-phase insulin response is blunted or absent
- Glucose peaks much higher (>180-200 mg/dL)
- The curve stays elevated well beyond 2 hours (>200 mg/dL at 2 h = diagnostic of diabetes)
- The prolonged hyperglycemia causes vascular and oxidative stress
Diagnostic cut-offs (2-hour post 75g glucose load - OGTT):
- Normal: <140 mg/dL
- Impaired glucose tolerance (pre-diabetes): 140-199 mg/dL
- Diabetes mellitus: ≥200 mg/dL
Key Hormones Involved
| Hormone | Source | Effect |
|---|---|---|
| Insulin | Pancreatic beta cells | Lowers glucose (uptake, glycogen synthesis, inhibits gluconeogenesis) |
| Glucagon | Pancreatic alpha cells | Suppressed post-meal; rises if glucose drops too low |
| GLP-1, GIP (incretins) | Gut L/K cells | Amplify insulin secretion in response to food |
| Amylin | Co-secreted with insulin | Slows gastric emptying, blunts postprandial glucose spike |
Sources: - Textbook of Family Medicine 9e | - Nutrisense: Glucose Curve | - ScienceInsights: Normal Glucose Graph
This is a shared conversation. Sign in to Orris to start your own chat.