explain whole guyton's physiology 14th chapter
Guyton & Hall Textbook of Medical Physiology - Chapter 14
Overview of the Circulation: Pressure, Flow, and Resistance
Purpose of the Circulation
1. Physical Characteristics of the Circulation
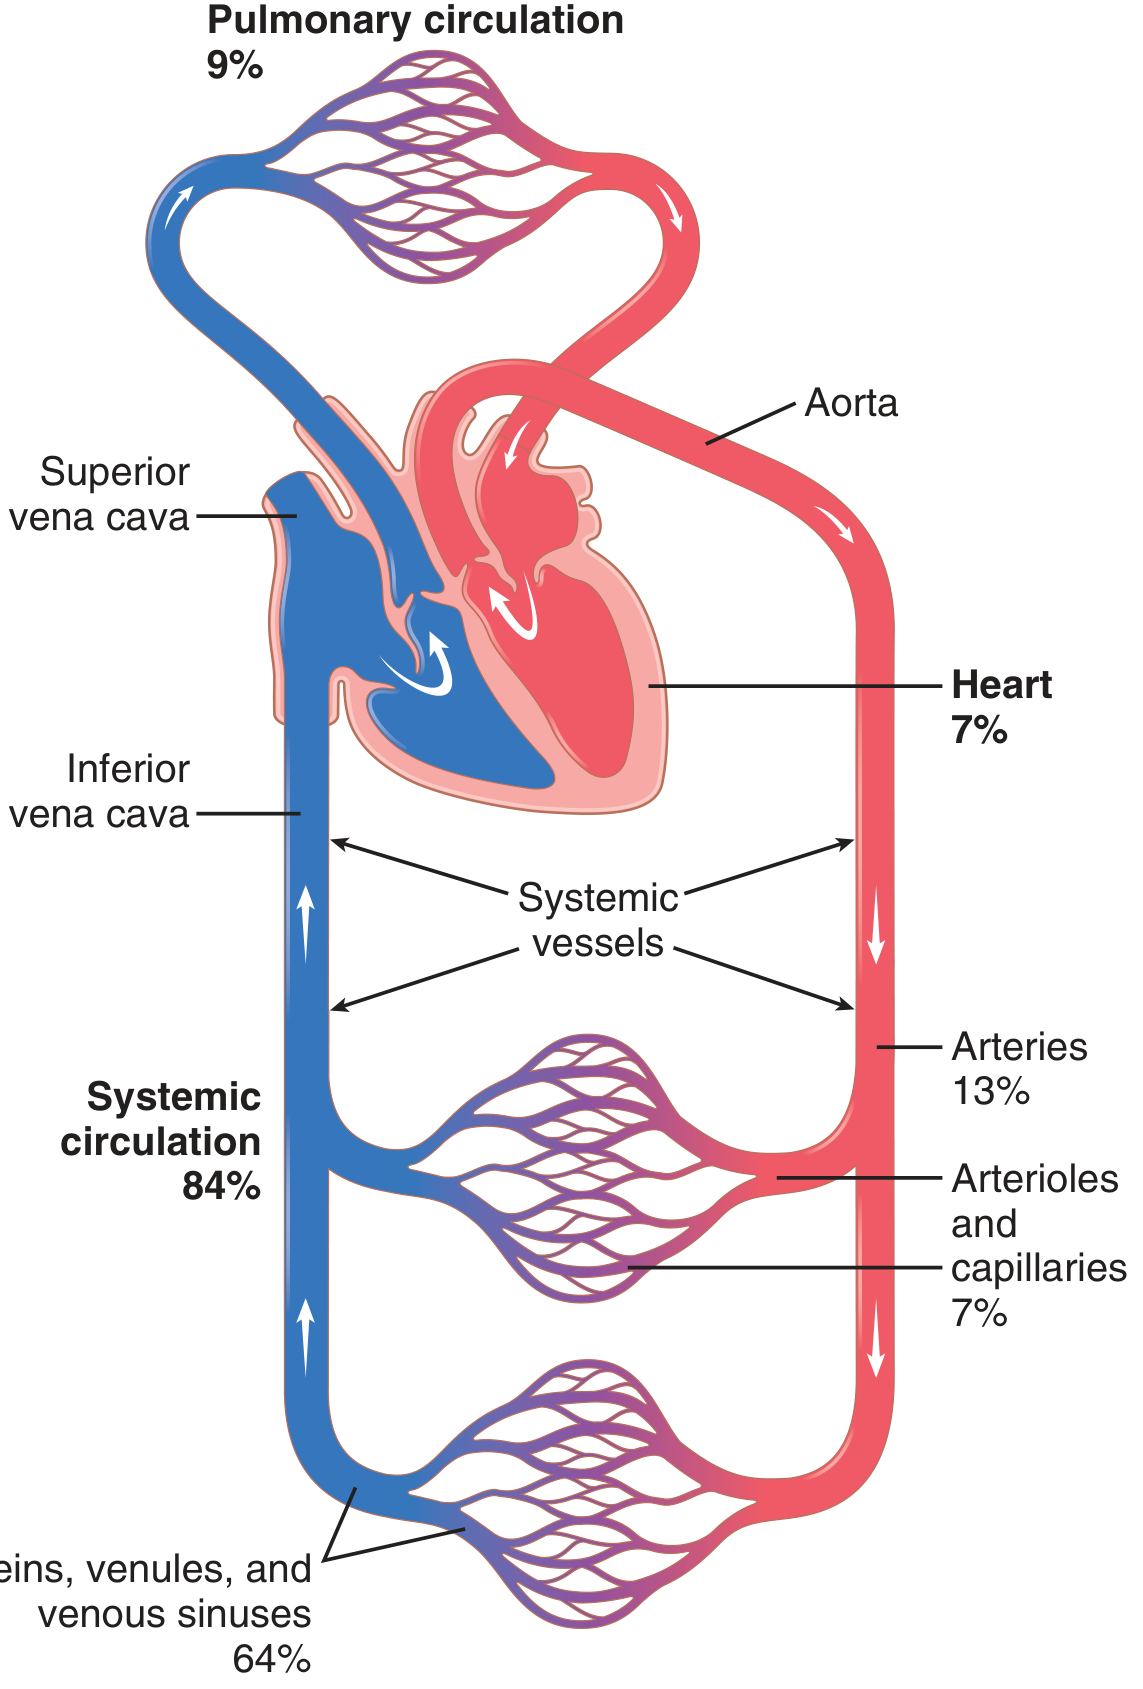
- Systemic circulation (also called peripheral circulation) - supplies all body tissues except the lungs. Contains ~84% of total blood volume.
- Pulmonary circulation - serves the lungs for gas exchange. Contains ~9% of total blood volume.
- The heart itself holds ~7% of blood volume.
Fig. 14.1 - Blood Distribution
Functional Parts
| Vessel | Role |
|---|---|
| Arteries | Transport blood under high pressure to tissues; thick muscular walls; high-velocity flow |
| Arterioles | Last small branches of arterial system; control blood entry into capillaries; can open or close completely (the "resistance vessels") |
| Capillaries | Exchange fluid, nutrients, wastes, electrolytes, and hormones between blood and interstitial fluid; thin walls with pores |
| Venules | Collect blood from capillaries; coalesce into veins |
| Veins | Conduits returning blood to the heart; serve as the main blood reservoir; muscular enough to contract or expand (compliance vessels) |
2. Blood Pressures Across the Circulation
Fig. 14.2 - Pressure Profile
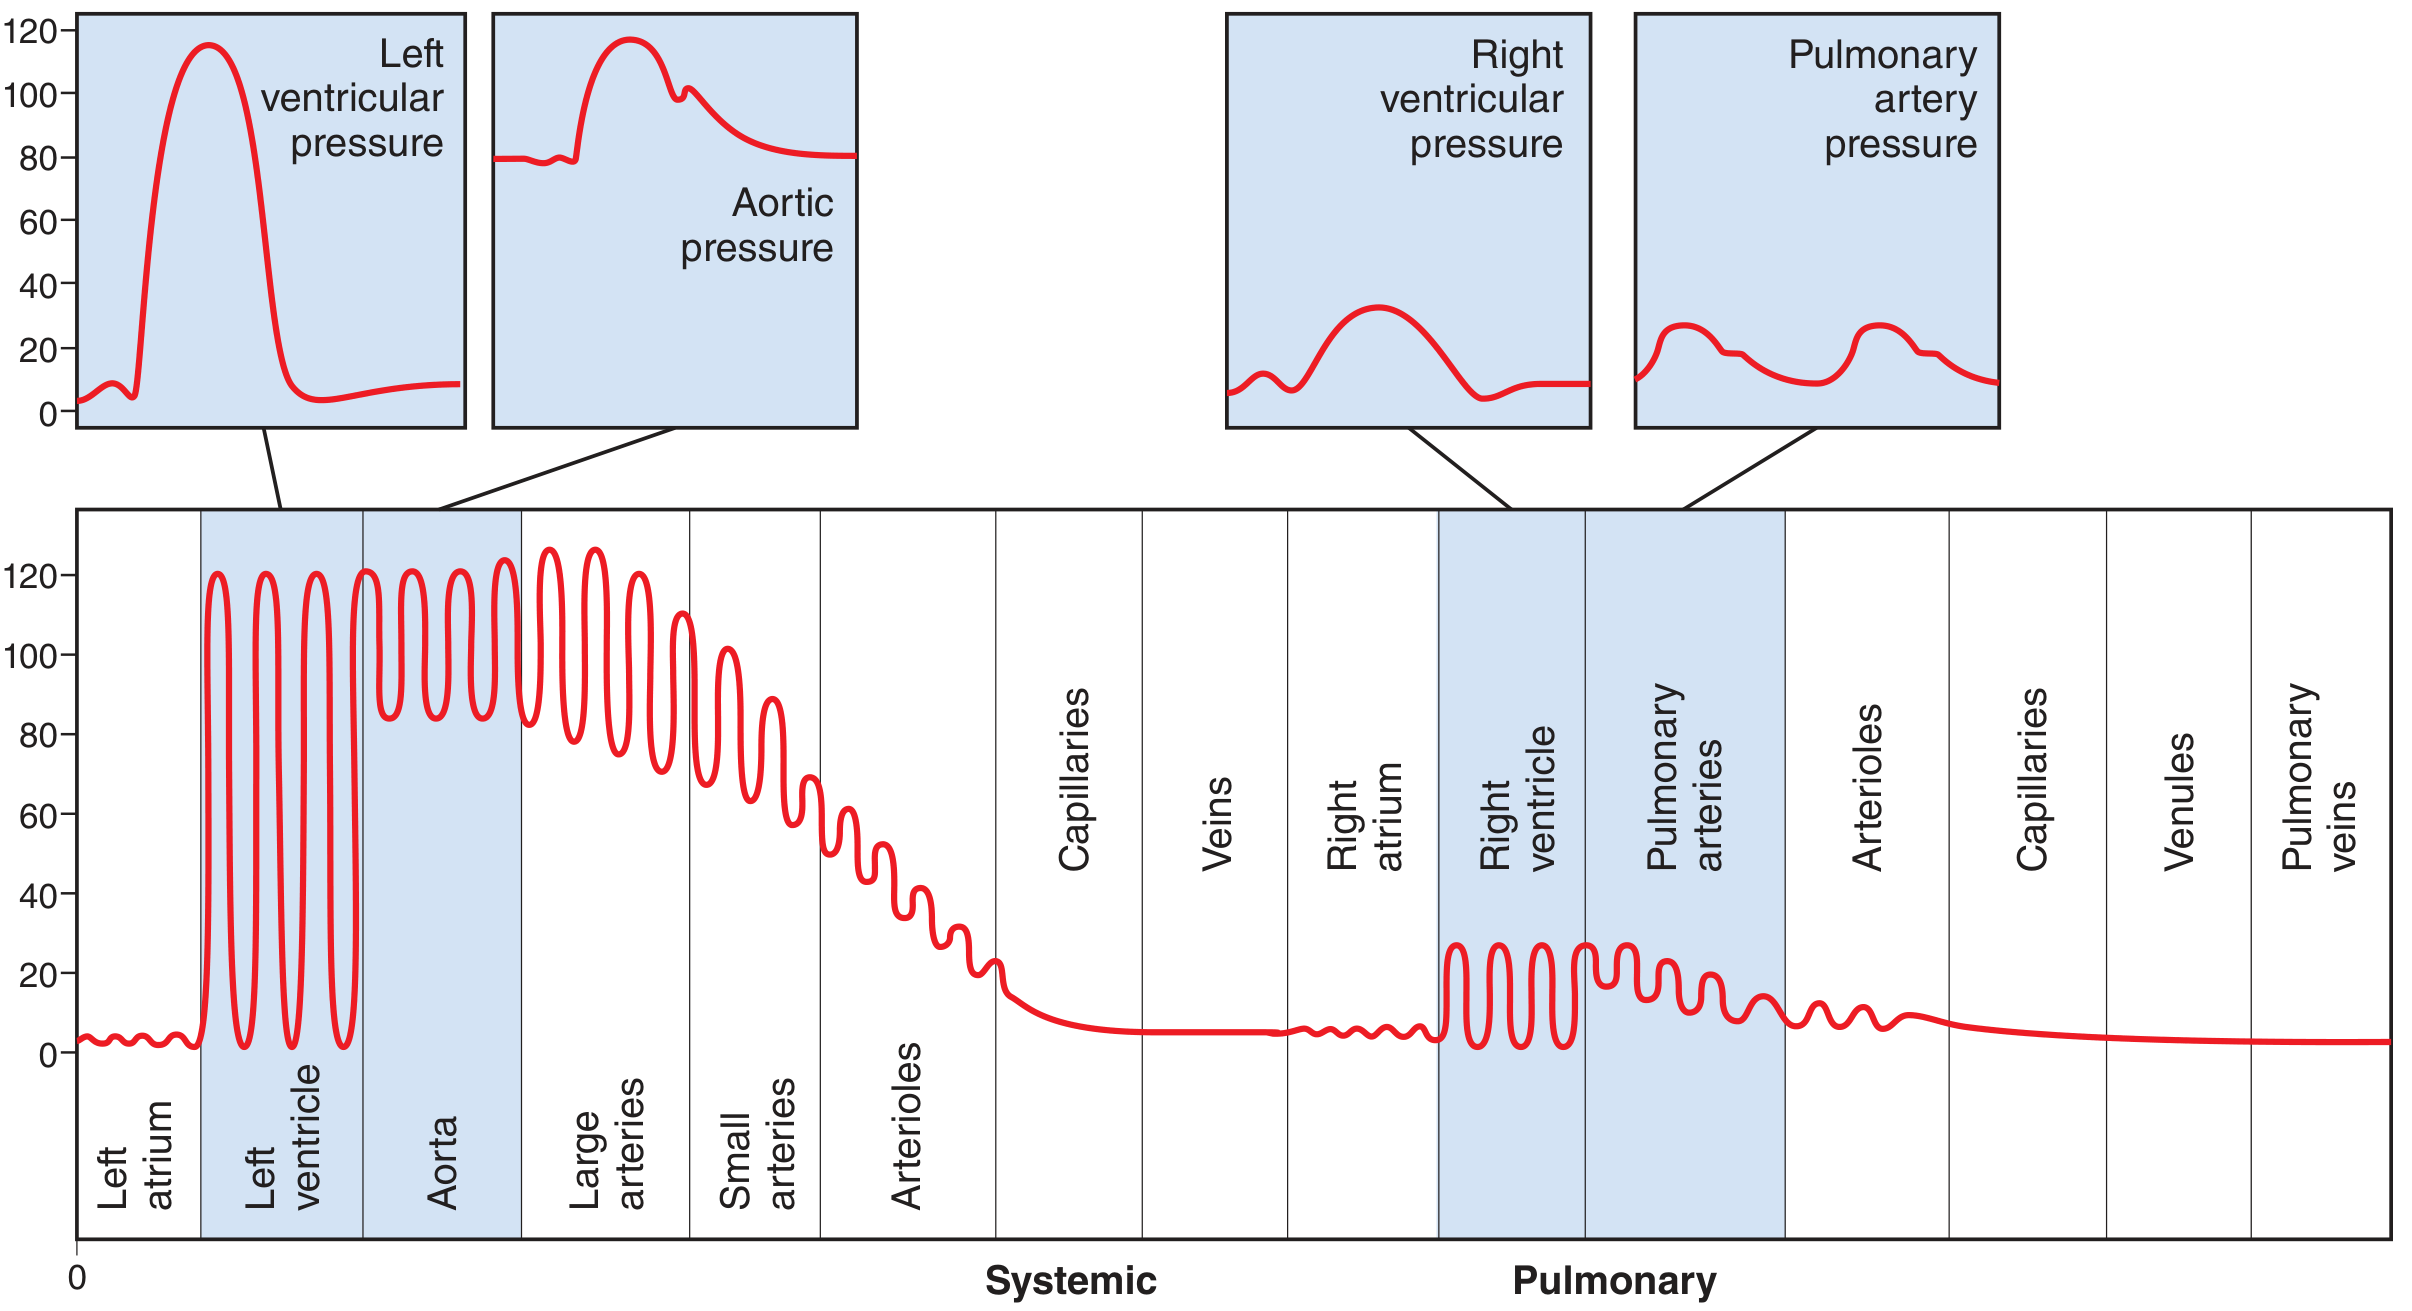
- Left ventricle: 0-120 mm Hg (systole/diastole)
- Aorta: ~80-120 mm Hg (diastolic/systolic)
- Arterioles: drops steeply to ~25-35 mm Hg (where greatest resistance exists)
- Capillaries: ~17 mm Hg at arterial end, ~8 mm Hg at venous end
- Right atrium / venae cavae: ~0 mm Hg
- Pulmonary artery: ~15-28 mm Hg (about 1/6th of systemic arterial pressure)
3. Basic Principles: The Interplay of Pressure, Flow, and Resistance
Ohm's Law Applied to the Circulation
F = ΔP / R
- F = blood flow (mL/sec or L/min)
- ΔP = pressure difference between two ends of a vessel (P₁ - P₂, in mm Hg)
- R = vascular resistance
- Flow is directly proportional to the pressure difference, NOT the absolute pressure.
- If pressure at both ends of a vessel is equal (e.g., both 100 mm Hg), flow is zero despite high pressure.
- The formula rearranges to: ΔP = F × R and R = ΔP / F
4. Blood Flow
- Definition: quantity of blood passing a point per unit time (mL/min or L/min)
- Normal cardiac output at rest: ~5,000-6,000 mL/min (5-6 L/min) in a 70-kg adult
- Total blood flow = cardiac output (the amount ejected into the aorta each minute)
- Men typically have 10-20% higher cardiac output than women at rest, mainly due to larger body mass
Measuring Blood Flow
- Applied outside a blood vessel
- A magnetic field is placed around the vessel; blood moving through it generates an electrical voltage proportional to flow rate
- Can record changes in under 1/100th of a second - captures pulsatile flow accurately
- Transmits ultrasonic waves into flowing blood
- Moving red blood cells reflect these waves with a Doppler frequency shift proportional to flow velocity
- Can be used non-invasively; also detects direction of flow
5. Blood Pressure Measurement
- Standard unit: millimeters of mercury (mm Hg) - standardized since Poiseuille's manometer in 1846
- Pressure = force exerted by blood per unit area of vessel wall
- 1 mm Hg = 1.36 cm H₂O (mercury is 13.6× denser than water)
- Mercury manometers can only follow slow pressure changes (up to ~1 cycle/2-3 sec)
- Electronic transducers use a thin metal membrane that deflects with pressure changes, recorded via:
- Capacitance transducer (membrane capacitance changes with deflection)
- Inductance transducer (iron slug moves into a coil)
- Resistance wire transducer (stretched wire changes resistance)
- These can accurately record pressure cycles up to 500 cycles/sec
6. Resistance to Blood Flow
Units of Resistance
- 1 peripheral resistance unit (PRU) = pressure difference of 1 mm Hg producing flow of 1 mL/sec
- Total peripheral resistance (TPR) of the entire systemic circulation is normally ~1 PRU
Poiseuille's Law - Determinants of Resistance
R = 8ηL / πr⁴
- η (eta) = viscosity of blood
- L = length of the vessel
- r = radius of the vessel
Conductance (inverse of resistance)
Conductance = 1/Resistance = Flow/Pressure difference
Vessels in Series vs. Parallel
- Total resistance = sum of individual resistances
- R_total = R₁ + R₂ + R₃ ...
- The segment with the highest resistance (arterioles) determines most of the total resistance
- Total conductance = sum of individual conductances
- C_total = C₁ + C₂ + C₃ ...
- Adding more parallel vessels reduces total resistance
- Removing a limb or kidney removes a parallel pathway, increasing total peripheral resistance
- Blood flow through each organ is determined by its own individual resistance and the pressure gradient
7. Effect of Hematocrit and Blood Viscosity
Hematocrit
- Definition: percentage of blood volume occupied by red blood cells
- Normal values: ~42% in men, ~38% in women
- Measured by centrifuging blood in a calibrated tube
- Anemia: decreased hematocrit → decreased viscosity → reduced resistance → increased flow tendency
- Polycythemia: increased hematocrit → markedly increased viscosity → dramatically increased resistance
- At hematocrit 0-40%: modest viscosity increase
- Above 60%: viscosity rises steeply - cardiac workload becomes dangerously high
8. Vascular Distensibility and Compliance
Distensibility
Vascular distensibility = Increase in volume / (Increase in pressure × Original volume)
- Veins are ~8× more distensible than arteries of similar size
- Arteries are relatively stiff - they act as a "pressure reservoir" (Windkessel effect), smoothing out the pulsatile cardiac output into a more continuous flow
- Pulmonary arteries are ~6× more distensible than systemic arteries (since they operate at much lower pressures)
Compliance (Capacitance)
Vascular compliance = Increase in volume / Increase in pressure
- Compliance = distensibility × volume
- Systemic vein compliance = ~24× that of a systemic artery (8× more distensible AND 3× larger volume)
- Systemic arterial system: at 700 mL blood → pressure ~100 mm Hg; at 400 mL → pressure ~0 mm Hg
- Systemic venous system: requires hundreds of mL change to alter venous pressure by just 3-5 mm Hg - this is why transfusing 500 mL into a healthy person doesn't dramatically change circulatory function
Effect of Sympathetic Stimulation on Volume-Pressure Relationships
- Sympathetic stimulation → increases vascular smooth muscle tone → higher pressure at same volume (vessels "stiffen")
- Sympathetic inhibition → lower pressure at same volume (vessels "relax")
- This gives the nervous system powerful control over blood distribution, especially venous return to the heart
Summary Table: Key Concepts of Chapter 14
| Concept | Key Point |
|---|---|
| Purpose | Transport nutrients/wastes; maintain homeostasis |
| Ohm's Law | F = ΔP/R; flow driven by pressure difference, opposed by resistance |
| Poiseuille's Law | Resistance ∝ 1/r⁴; arteriolar radius is the chief flow regulator |
| Cardiac Output | ~5-6 L/min at rest; = total systemic blood flow |
| Pressure | Highest in aorta (~120/80), lowest in vena cava (~0 mm Hg) |
| Series resistance | Adds up; arterioles dominate total resistance |
| Parallel conductance | Adds up; more parallel vessels = less total resistance |
| Blood viscosity | ~3× water; increases steeply with hematocrit above 60% |
| Venous compliance | ~24× arterial compliance; veins are the blood reservoir |
| Sympathetics | Shift volume-pressure curve; control redistribution of blood |
- Guyton and Hall Textbook of Medical Physiology, Chapter 14 (ISBN 9780443111013)
give whole detailed notes from guyton physiology without removing any point , chapter let ie be oriented - begin with 9th chapter , followed by 10 , 11 , 12 , 14 , 15 , 16 , 17 , 18 , 19 , 20 , and 21 , take your time but let it the include every and each point
GUYTON & HALL - TEXTBOOK OF MEDICAL PHYSIOLOGY
CHAPTER 9: Cardiac Muscle; The Heart as a Pump and Function of the Heart Valves
OVERVIEW
- Right heart - pumps blood through the pulmonary circulation (lungs)
- Left heart - pumps blood through the systemic circulation (all other organs and tissues)
- Atrium - weak primer pump; helps move blood into the ventricle
- Ventricle - main pumping chamber; supplies force to propel blood into the circulation
SECTION 1: CARDIAC MUSCLE PHYSIOLOGY
Three Types of Cardiac Muscle
| Type | Location | Primary Function |
|---|---|---|
| Atrial muscle | Atria | Contraction (similar to skeletal but longer duration) |
| Ventricular muscle | Ventricles | Powerful contraction; main pumping |
| Specialized excitatory/conductive fibers | SA node, AV node, bundle of His, Purkinje fibers | Automatic rhythmical discharge + conduction of action potentials |
- Specialized fibers contract feebly (few contractile fibrils) but serve as the excitatory and conductive system.
SECTION 2: CARDIAC MUSCLE ANATOMY
Histology
- Cardiac muscle fibers arranged in a latticework - fibers divide, recombine, and spread again.
- Striated - same as skeletal muscle
- Contains typical myofibrils with actin and myosin filaments, lying side by side; filaments slide during contraction (same cross-bridge mechanism as skeletal muscle)
Left Ventricular Torsion (Twisting Motion)
- The LV has complex fiber layers running in different directions, enabling a wringing/twisting motion during systole.
- Subepicardial (outer) layer - spirals leftward
- Subendocardial (inner) layer - spirals rightward (opposite direction)
- Midwall fibers run circumferentially
- Arrangement forms a double helix
- During contraction:
- Subepicardial fibers rotate LV apex counterclockwise (viewed apex-to-base)
- Base rotates clockwise
- Net result: wringing motion pulling base toward apex during systole
- At end systole: LV acts like a loaded spring - recoils/untwists during diastole, allowing rapid ventricular filling
Intercalated Discs
- Dark bands crossing cardiac muscle fibers visible on histology
- Actually cell membranes separating individual cardiac muscle cells
- Cardiac muscle = many individual cells connected at intercalated discs
- At intercalated discs, cell membranes fuse into gap junctions (communicating junctions)
- Gap junctions allow free diffusion of ions between cells
- Ions carry electrical current → cardiac muscle is an electrical syncytium
Functional Syncytium
- The heart has two separate syncytia:
- Atrial syncytium - forms the walls of the two atria
- Ventricular syncytium - forms the walls of the two ventricles
- Atria and ventricles are separated by fibrous tissue except at the AV bundle (bundle of His)
- When an action potential is initiated anywhere in the atrial syncytium → spreads to ALL atrial fibers
- When an action potential is initiated in the ventricular syncytium → spreads to ALL ventricular fibers
- This is the basis of all-or-nothing contraction of cardiac muscle
SECTION 3: ACTION POTENTIALS IN CARDIAC MUSCLE
Resting Membrane Potential
- About -85 mV in ventricular muscle (slightly less negative than in skeletal muscle, which is -90 mV)
Phases of the Ventricular Action Potential
- Fast Na⁺ channels open → rapid influx of Na⁺
- Membrane potential rises from -85 mV toward +20 mV
- Fast channels are "activation gates" - open within milliseconds when membrane potential rises above threshold (~-65 mV)
- These channels have two gates: activation gate (opens rapidly) and inactivation gate (closes within milliseconds)
- Fast Na⁺ channels inactivate
- Brief K⁺ efflux
- Duration: ~0.2 seconds (atrial) to ~0.3 seconds (ventricular)
- Caused by: L-type (slow) calcium channels open → sustained Ca²⁺ influx
- Also: decreased K⁺ permeability (K⁺ channels close at onset of plateau)
- Without the plateau: contraction would be too brief for adequate pumping
- L-type Ca²⁺ channels close
- K⁺ channels reopen → rapid K⁺ efflux → membrane repolarizes back to resting potential
Comparison: Cardiac vs. Skeletal Muscle Action Potential
| Feature | Skeletal Muscle | Cardiac Muscle |
|---|---|---|
| Duration | 1-5 ms | 200-300 ms |
| Plateau | Absent | Present |
| Main Ca²⁺ source for contraction | Sarcoplasmic reticulum | Both SR + extracellular (via T tubules) |
| Tetanus possible | Yes | No (due to long refractory period) |
Why Cardiac Muscle Cannot Tetanize
- The action potential duration is nearly as long as the contraction itself
- During the plateau, the muscle is in its absolute refractory period - it cannot be re-excited
- This prevents tetanic (sustained) contractions that would stop the heart's pumping action
SECTION 4: EXCITATION-CONTRACTION COUPLING IN CARDIAC MUSCLE
T-Tubule System
- Cardiac T tubules are 5 times the diameter of skeletal muscle T tubules (25× the volume)
- Inside T tubules: large quantities of mucopolysaccharides that are electronegatively charged and bind abundant stored calcium ions
- T tubule openings pass directly through the cardiac muscle cell membrane into extracellular spaces
- Therefore: calcium in T tubules = from extracellular fluid surrounding cardiac cells
Calcium-Induced Calcium Release (CICR)
- L-type Ca²⁺ channels on T tubule membrane open → Ca²⁺ flows from T tubule into sarcoplasm
- This Ca²⁺ triggers ryanodine receptor (RyR) Ca²⁺ release channels on the sarcoplasmic reticulum (SR) → massive release of Ca²⁺ from SR (calcium-induced calcium release)
- Total sarcoplasmic [Ca²⁺] rises → Ca²⁺ binds troponin C → conformational change → tropomyosin moves → actin-myosin cross-bridge cycling → contraction
Key Difference from Skeletal Muscle
- Skeletal muscle: almost entirely SR-derived Ca²⁺ (extracellular Ca²⁺ barely matters)
- Cardiac muscle: both SR and extracellular Ca²⁺ are important
- A heart placed in calcium-free solution quickly stops beating
- Therefore, extracellular Ca²⁺ concentration directly affects force of cardiac contraction
Relaxation
- Ca²⁺ influx suddenly cut off as action potential ends
- SERCA2 (sarcoplasmic/endoplasmic reticulum Ca²⁺-ATPase) pumps Ca²⁺ back into SR
- Na⁺/Ca²⁺ exchanger extrudes Ca²⁺ out of cell (Na⁺ enters)
- Na⁺/K⁺-ATPase then pumps Na⁺ back out
- Sarcoplasmic Ca²⁺ falls below threshold → troponin-tropomyosin complex returns to blocking position → relaxation
Duration of Contraction
- Contraction begins a few milliseconds after the action potential begins
- Continues until a few milliseconds after the action potential ends
- Duration of contraction ~ duration of action potential (including plateau)
- Atrial muscle: ~0.2 seconds
- Ventricular muscle: ~0.3 seconds
SECTION 5: THE CARDIAC CYCLE
Phases of the Cardiac Cycle
DIASTOLE (Relaxation/Filling Phase)
- Ventricles relaxed; AV valves open; semilunar valves closed
- Blood flows passively from great veins/pulmonary veins → atria → ventricles
- ~70-80% of ventricular filling occurs passively before atrial contraction
ATRIAL SYSTOLE ("Atrial Kick")
- P wave on ECG → atrial depolarization → atrial contraction
- Atrial contraction adds 20-30% of additional ventricular filling (the "booster pump")
- Right atrial pressure rises 4-6 mm Hg; Left atrial pressure rises 7-8 mm Hg
- Important in exercise or tachycardia when diastolic filling time is short
VENTRICULAR SYSTOLE
- QRS complex on ECG → ventricular depolarization → ventricles start to contract
- Ventricular pressure rises rapidly
- AV valves close as soon as ventricular pressure exceeds atrial pressure (produces S1)
- Semilunar valves still closed (aortic pressure ~80 mm Hg)
- Volume does not change (both sets of valves closed) - "isovolumetric"
- Duration: ~0.05 seconds
- Ventricular pressure exceeds aortic/pulmonary artery pressure → semilunar valves open
- LV pressure rises to ~120 mm Hg (systolic); RV to ~25 mm Hg
- Blood rapidly ejected into aorta and pulmonary artery
- About 70% of total stroke volume ejected in this phase
- Ventricular pressure begins to fall
- Ejection continues but slows
- Remaining ~30% of stroke volume ejected
VENTRICULAR DIASTOLE (Beginning)
- T wave on ECG → ventricular repolarization → ventricles begin to relax
- Ventricular pressure falls rapidly
- Semilunar valves close when ventricular pressure drops below aortic pressure (produces S2)
- AV valves still closed
- Volume unchanged again - "isovolumetric"
- Duration: ~0.04 seconds
- Ventricular pressure drops below atrial pressure → AV valves open
- Blood rushes rapidly from atria into ventricles
- ~70-80% of total ventricular filling occurs here
- Filling continues slowly
- Blood entering veins and atria slowly passes into ventricles
Atrial Pressure Waves: a, c, and v Waves
| Wave | Timing | Cause |
|---|---|---|
| a wave | Just after P wave (atrial contraction) | Atrial contraction → slight rise in atrial pressure |
| c wave | Onset of ventricular contraction | Backflow of blood toward atria at start of ventricular contraction + AV valve bulging backward into atria |
| v wave | End of ventricular systole | Slow filling of atria from veins while AV valves are closed |
- Right atrial: a wave = 4-6 mm Hg; Left atrial: a wave = 7-8 mm Hg
Ventricular Pressures and Volumes
- End-diastolic volume (EDV): ~110-120 mL
- End-systolic volume (ESV): ~40-50 mL
- Stroke volume (SV) = EDV - ESV = ~70 mL
- Ejection fraction (EF) = SV/EDV = 70/120 = ~60%
- Systolic pressure: ~120 mm Hg
- Diastolic pressure: ~0 to 8 mm Hg
- Same volumes as LV
- Systolic pressure: ~25 mm Hg
- Diastolic pressure: ~0 to 8 mm Hg
Effect of Increased Heart Rate on the Cardiac Cycle
- Increased HR → shorter cycle duration
- Systole shortens but NOT proportionally as much as diastole
- At normal HR of 72 bpm → systole = ~40% of cycle
- At 3× normal HR → systole = ~65% of cycle
- Very fast heart rates: diastole inadequate → incomplete ventricular filling → reduced stroke volume
SECTION 6: FUNCTION OF THE HEART VALVES
Atrioventricular (AV) Valves
- Mitral valve (left AV): two leaflets; guards left AV orifice
- Tricuspid valve (right AV): three leaflets; guards right AV orifice
- Both are prevented from bulging too far back into atria (prolapsing) by chordae tendineae - fibrous strings attached to valve leaflets and to papillary muscles on the ventricular walls
- Papillary muscles contract along with the ventricle → pull chordae tendineae → keep valves closed tight without reversing into atria
- If papillary muscles fail (e.g., MI) → valve prolapse → regurgitation
Semilunar Valves
- Aortic valve and pulmonary valve
- Each has three semilunar (half-moon) shaped cusps
- Open when ventricular pressure exceeds arterial pressure
- Close when arterial pressure exceeds ventricular pressure at end systole
- No chordae tendineae - close by mechanical pressure alone
- Designed to prevent blood backflow from aorta/pulmonary artery into ventricles
Why Valves Open and Close Silently vs. With Sound
- Valve opening = slow process → no noise normally
- AV valve closure (S1): slower, lower-pitched, longer sound
- Semilunar valve closure (S2): rapid snap, higher-pitched, shorter sound
- Both sounds caused by vibration of valve leaflets and surrounding blood/tissue
SECTION 7: WORK OUTPUT OF THE HEART
- Energy used to move blood from low-pressure veins to high-pressure arteries
- Work = stroke volume × mean arterial pressure
- Energy used to accelerate blood to ejection velocity
- Proportional to mass of blood × (velocity of ejection)²
- Normally only ~1% of total work output
- Exception: aortic stenosis → blood ejected at very high velocity through narrowed valve → kinetic energy work can exceed 50% of total work output
- RV external work = ~1/6 of LV external work (due to ~6-fold lower pulmonary vs. systemic pressure)
SECTION 8: VENTRICULAR VOLUME-PRESSURE RELATIONSHIPS
Volume-Pressure Diagram (Fig. 9.10 in Guyton)
- Up to ~150 mL: diastolic pressure increases little → blood can fill easily
- Above ~150 mL: diastolic pressure rises rapidly (fibrous pericardium stretched to limit; cardiac connective tissue fully stretched)
- Even at low volumes, systolic pressure increases significantly when ventricle contracts
- Maximum systolic pressure at ~150-170 mL
- At very high volumes: systolic pressure actually decreases because actin and myosin filaments are pulled beyond optimal overlap (like in skeletal muscle length-tension relationship)
The Cardiac Loop (Fig. 9.11)
- Diastolic filling (right side, low pressure): volume increases from ESV to EDV
- Isovolumetric contraction: pressure rises, volume constant
- Ejection: pressure maintained at high level, volume decreases (SV ejected)
- Isovolumetric relaxation: pressure falls, volume constant
- Total area inside the loop = net external work output of the ventricle per beat
SECTION 9: REGULATION OF HEART PUMPING
9A. Intrinsic Regulation - The Frank-Starling Mechanism
- Frank-Starling Law: Within physiological limits, the greater the volume of blood filling the ventricle (increased end-diastolic volume = increased preload), the greater the force of contraction and stroke volume
- Mechanism: More filling → cardiac muscle fibers stretched → optimal actin-myosin overlap → stronger cross-bridge formation → greater force
- Also: increased stretch increases sensitivity of troponin to Ca²⁺
- Practical significance: If extra blood flows into the heart from peripheral veins, the heart automatically pumps it all out - output = input
- This prevents venous backup and maintains balanced output between right and left hearts
- Plot: stroke work vs. left ventricular end-diastolic pressure (LVEDP)
- Normal resting LV: diastolic pressure ~2 mm Hg; LVEDP ~0-6 mm Hg when exercising
- As LVEDP (preload) increases, stroke work increases
- At very high filling pressures: curve plateaus or may decline (overstretched)
9B. Extrinsic Regulation - Autonomic Nervous System
- Norepinephrine released from sympathetic nerve endings → binds β₁-adrenergic receptors
- Chronotropic effect: increases heart rate from ~70 bpm up to 180-200 bpm (rarely 250 bpm)
- Inotropic effect: may double force of contraction
- Increases Ca²⁺ entry and release, and speeds up SERCA activity (faster relaxation too)
- Overall: sympathetic stimulation can increase maximum cardiac output 2-3 fold
- Normal baseline: sympathetic nerves discharge continuously at low rate → heart pumps ~30% above baseline (no sympathetic)
- Sympathetic inhibition → HR and contractility fall → cardiac output may drop ~30% below normal
- At any given right atrial pressure (filling pressure):
- Increased sympathetic stimulation → shifts curve upward and to the left (more output)
- Increased parasympathetic stimulation → shifts curve downward and to the right (less output)
- Acetylcholine released from vagus nerve → binds M₂ muscarinic receptors
- Vagal fibers distributed mainly to atria (SA node, AV node), not much to ventricles
- Strong vagal stimulation can stop the heart for a few seconds
- Heart eventually "escapes" and beats at 20-40 bpm (junctional or ventricular escape rhythm)
- Decreases strength of atrial (not much ventricular) contraction by 20-30%
- Combined effect of rate reduction + slight contractility decrease → ventricular pumping reduced by 50% or more
SECTION 10: EFFECT OF IONS ON HEART FUNCTION
Potassium (K⁺)
- Reduces resting membrane potential (less negative)
- Reduced membrane potential → decreased action potential amplitude and strength
- Heart becomes dilated and flaccid
- Heart rate slows
- Very high K⁺ (>8-10 mEq/L) can cause the heart to stop in diastole (cardiac arrest)
- Membrane hyperpolarizes (more negative resting potential)
- Arrhythmias (spontaneous extra beats)
Calcium (Ca²⁺)
- More Ca²⁺ available to enter during plateau → stronger contraction
- Very high Ca²⁺ → heart stops in systole (spastic contraction) - called "calcium rigor"
- Decreased contraction strength
- Very low Ca²⁺ → cardiac muscle relaxes, heart stops in diastole
- In skeletal muscle: SR stores alone are sufficient for full contraction
- In cardiac muscle: T tubule extracellular Ca²⁺ is indispensable (SR stores alone insufficient)
Temperature Effects
- Increased temperature → increases heart rate, slightly increases force of contraction
- Decreased temperature (hypothermia) → slows heart rate significantly; during cardiac surgery, heart can be stopped by cooling
SECTION 11: SPECIAL FEATURES OF CARDIAC MUSCLE METABOLISM
- Cardiac muscle is an obligate aerobe - it cannot sustain itself on anaerobic metabolism for more than a few minutes
- Primary fuel: Free fatty acids (60-70% of energy at rest)
- Also uses: glucose, lactate, amino acids, ketone bodies
- During exercise or increased workload: glucose utilization increases
- Cardiac muscle has very high mitochondrial density (25-35% of cell volume) - reflects its continuous high energy demands
- Creatine phosphate (phosphocreatine) serves as a rapid energy buffer during sudden increases in demand
- Myocardial O₂ consumption = best index of overall cardiac energy expenditure
- Ischemia (insufficient O₂ supply) → rapid switch to anaerobic glycolysis → lactate production → acidosis → impaired contraction
SECTION 12: CARDIAC RESERVE AND OVERALL PUMPING CAPABILITY
- Heart normally operates at only 20-25% of its maximal capacity at rest
- Cardiac reserve: the extra output the heart can achieve above resting level
- Normal cardiac reserve = 300-400% of resting cardiac output
- Even if atria fail to function as "primer pumps," most people will not notice at rest (the ventricles still receive ~70-80% passive filling)
- Symptoms of atrial failure become apparent only during exercise (when filling time is short and atrial kick becomes critical)
KEY NUMBERS TO REMEMBER - CHAPTER 9
| Parameter | Value |
|---|---|
| Resting membrane potential (ventricular) | -85 mV |
| Action potential duration (atrial) | ~0.2 sec |
| Action potential duration (ventricular) | ~0.3 sec |
| Normal heart rate | ~72 bpm |
| End-diastolic volume (LV) | ~110-120 mL |
| End-systolic volume (LV) | ~40-50 mL |
| Stroke volume | ~70 mL |
| Ejection fraction | ~60% |
| LV systolic pressure | ~120 mm Hg |
| RV systolic pressure | ~25 mm Hg |
| Passive ventricular filling (before atrial kick) | 70-80% |
| Atrial "kick" contribution | 20-30% |
| Sympathetic HR increase (max) | 180-200 bpm (rarely 250) |
| Sympathetic contractility increase | Up to 2× |
| Vagal stimulation effect on contractility | -20 to -30% |
| K⁺ cardiac arrest | Diastole (flaccid) |
| Ca²⁺ cardiac arrest | Systole (spastic) |
| Cardiac reserve above resting | 300-400% |
Continue with Chapter 10 notes now
GUYTON & HALL - TEXTBOOK OF MEDICAL PHYSIOLOGY
CHAPTER 10: Rhythmical Excitation of the Heart
OVERVIEW
- Generates electrical impulses to initiate rhythmical contraction
- Conducts those impulses rapidly and in the correct sequence through the heart
- Atria contract ~1/6 second (about 0.16 sec) ahead of ventricular contraction → allows ventricular filling before ejection
- All portions of the ventricles contract almost simultaneously → generates maximum pressure in the ventricular chambers
- This system is susceptible to damage by ischemia (reduced coronary blood flow) → bizarre rhythms, abnormal contraction sequences, severe reduction in pumping → can cause death
SECTION 1: THE SPECIALIZED EXCITATORY AND CONDUCTIVE SYSTEM
Components (from top to bottom)
| Structure | Location | Function |
|---|---|---|
| Sinus (SA) node | Superior posterolateral wall of right atrium, below/lateral to SVC opening | Normal pacemaker; generates rhythmical impulses |
| Internodal pathways | Atrial muscle; three tracts between SA and AV nodes | Conduct impulses from SA to AV node |
| AV node | Posterior inferior right atrium, near tricuspid valve | Delays impulse from atria to ventricles |
| AV bundle (Bundle of His) | Passes through fibrous skeleton into interventricular septum | Sole electrical connection between atria and ventricles |
| Right and left bundle branches | Down both sides of interventricular septum | Conduct impulse toward ventricular apices |
| Purkinje fibers | Inner walls of both ventricles, including papillary muscles | Rapid conduction to all of ventricular muscle |
SECTION 2: THE SINUS (SINOATRIAL) NODE
Anatomy
- Small, flattened ellipsoid strip of specialized cardiac muscle
- Size: ~3 mm wide × 15 mm long × 1 mm thick
- Location: superior posterolateral wall of the right atrium, immediately below and slightly lateral to the opening of the superior vena cava
- Fiber diameter: 3-5 μm (much smaller than surrounding atrial muscle fibers at 10-15 μm)
- Fibers have almost no contractile myofilaments
- Sinus nodal fibers connect directly with atrial muscle fibers → any action potential in sinus node spreads immediately into the atrial wall
Self-Excitation of Sinus Fibers (Automaticity)
Resting Membrane Potential in SA Node vs. Ventricular Muscle
| Parameter | SA Node | Ventricular Muscle |
|---|---|---|
| Resting membrane potential | -55 to -60 mV | -85 to -90 mV |
| Action potential upstroke | Slow (Ca²⁺-dependent) | Rapid (Na⁺-dependent) |
| Threshold potential | ~-40 mV | ~-65 mV |
| Automaticity | Yes | No (normally) |
- SA cell membranes are naturally leaky to Na⁺ and Ca²⁺
- Constant inward leak of positive ions → partially depolarizes the resting membrane → resting potential only reaches -55 to -60 mV instead of -90 mV
SECTION 3: MECHANISM OF SINUS NODE AUTOMATICITY
Three Key Ion Channels in SA Node
- Open for only a few 10,000ths of a second
- Responsible for the rapid upstroke spike in ventricular/atrial action potentials
- In SA node: almost entirely inactivated (because the resting membrane potential of -55 to -60 mV is not negative enough to de-inactivate them; fast Na⁺ channels need at least -70 mV to be fully available)
- Take 10-20× longer to open and inactivate than fast Na⁺ channels
- Conduct both Ca²⁺ and Na⁺ into the fiber when open
- Responsible for the upstroke of the SA node action potential
- Also responsible for maintaining the plateau in ventricular muscle
- Allow K⁺ to flow out of the cell
- Open during phase 3 repolarization
- Gradually close during diastole → contributes to slow depolarization (pacemaker potential)
The Pacemaker Potential (Prepotential / Phase 4 Spontaneous Depolarization)
- After each action potential, K⁺ channels are open → K⁺ flows out → membrane repolarizes to about -55 to -60 mV
- After repolarization, special HCN (hyperpolarization-activated cyclic nucleotide-gated) channels open
- These "funny" channels carry inward Na⁺ (and some K⁺) current when the membrane is hyperpolarized
- This causes the membrane potential to slowly drift upward (less negative) - this slow upward drift is the prepotential or pacemaker potential
- As membrane potential drifts toward ~-50 mV, T-type (transient) Ca²⁺ channels open
- Ca²⁺ inflow accelerates the rate of depolarization
- When membrane potential reaches threshold (~-40 mV), L-type Ca²⁺ channels open fully
- Rapid Ca²⁺ (and some Na²⁺) inflow → action potential upstroke
- Note: NO fast Na⁺ channel-dependent rapid upstroke (those are inactivated)
- Action potential reaches +10 to +20 mV
- L-type Ca²⁺ channels gradually inactivate
- K⁺ channels open (I_K) → K⁺ efflux → rapid repolarization back to -55 to -60 mV
- Cycle repeats automatically
The Slow Drift (Prepotential) is the Key to Rhythmicity
- The slow upward drift of the membrane potential from -55 mV back to the threshold of -40 mV (-40 mV) is called the pacemaker potential
- This continuous, automatic, rhythmical drifting is what makes the SA node the pacemaker
- The rate of this drift determines the heart rate
SECTION 4: CONDUCTION OF THE CARDIAC IMPULSE THROUGH THE HEART
From SA Node → Atria → AV Node
- Impulse spreads from SA node through the internodal pathways (three recognized tracts: anterior, middle [Wenckebach], and posterior [Thorel]) to the AV node
- Total conduction time SA node → AV node: ~0.03 seconds
- Impulse also spreads through the atrial muscle in all directions
- Entire atrium depolarized in about 0.08-0.09 seconds after SA node discharge
| Tissue | Conduction Velocity |
|---|---|
| SA node | 0.05 m/sec |
| Atrial muscle | 1.0 m/sec |
| AV node (transitional zone) | 0.02-0.05 m/sec (very slow) |
| Bundle of His | 1.0 m/sec |
| Purkinje fibers | 4.0 m/sec (fastest) |
| Ventricular muscle | 0.3-0.5 m/sec |
SECTION 5: AV NODE - DELAY AND ITS IMPORTANCE
Anatomy
- Located in the posterior wall of the right atrium, immediately behind the tricuspid valve
- Transmission through AV node and Bundle of His delayed ~0.09 seconds (total AV delay)
- Most of the delay occurs in the transitional fibers entering the AV node (very small diameter, low excitability, slow conduction of 0.02-0.05 m/sec)
Why AV Delay is Critical
- The atria to contract first and complete ventricular filling before the ventricles contract
- Without this delay: atria and ventricles would contract almost simultaneously → no atrial "booster pump" effect → reduced ventricular filling → reduced cardiac output
The AV Node as a Gatekeeper
- During rapid atrial rates (e.g., atrial flutter at 250-350/min), the AV node blocks some impulses
- Acts as a frequency filter - prevents all rapid atrial impulses from reaching the ventricles
- Protects ventricles from excessively fast rates that would compromise pumping
SECTION 6: TRANSMISSION THROUGH THE BUNDLE BRANCHES AND PURKINJE SYSTEM
Bundle of His (AV Bundle)
- Passes from AV node through the fibrous barrier separating atria from ventricles
- This fibrous barrier is the only route for electrical impulse transmission from atria to ventricles (under normal circumstances)
- After passing through fibrous barrier, AV bundle divides into:
- Left bundle branch (splits further into anterior and posterior fascicles)
- Right bundle branch
- Both run down either side of the interventricular septum toward the apex
Purkinje Fibers
- After traversing the septum, fibers spread throughout the subendocardial surfaces of both ventricles
- Largest cardiac fibers in the heart - 70-80 μm diameter
- Highly permeable gap junctions → allow very rapid conduction: 1.5-4.0 m/sec (about 6× faster than normal ventricular muscle)
- Impulse reaches all endocardial surfaces of the ventricles within 0.03 seconds of entering the bundle branches
Why Rapid Conduction Through Purkinje System Matters
- All parts of the ventricles need to contract nearly simultaneously
- If conduction were via ventricular muscle alone (slow, 0.3-0.5 m/sec): sequential, non-simultaneous contraction → inefficient pumping
- Rapid Purkinje conduction → near-simultaneous contraction of all ventricular muscle → maximum pressure development
Sequence of Ventricular Activation
- Impulse enters the interventricular septum from the left → septal depolarization first (left to right)
- Purkinje fibers carry impulse rapidly to endocardial surfaces of both ventricles
- Depolarization spreads from endocardium outward through ventricular muscle to epicardium
- Apex and lateral walls depolarize before the base
- Last to depolarize: basal portions and posterolateral wall of left ventricle and pulmonary conus
SECTION 7: THE SA NODE AS THE NORMAL PACEMAKER
Intrinsic Rates of Potential Pacemakers
| Tissue | Intrinsic Firing Rate |
|---|---|
| SA node | 60-100 bpm (normal: ~70-80 bpm) |
| AV node / AV junction | 40-60 bpm |
| Purkinje fibers / Bundle of His | 15-40 bpm |
| Ventricular muscle | 20-40 bpm (least reliable) |
Why SA Node Controls the Heart Rate
- SA node has the fastest intrinsic rate of spontaneous depolarization
- It reaches threshold and fires before any other potential pacemaker
- When SA node fires, its action potential spreads through the entire heart - including the AV node and Purkinje fibers - resetting those cells before they can fire spontaneously
- The SA node thus continuously "overdrive suppresses" all lower pacemakers
Overdrive Suppression
- Any pacemaker that is stimulated at a rate faster than its intrinsic rate is suppressed
- The faster the overdrive rate, the more Na⁺/K⁺-ATPase pumps Na⁺ out and hyperpolarizes the cell
- If SA node suddenly fails: lower pacemaker is suppressed → brief pause → then lower pacemaker eventually "escapes" and takes over at its own slower intrinsic rate
Ectopic Pacemakers
- Any region of the heart that develops abnormal automaticity and fires faster than the SA node can take control = ectopic pacemaker or ectopic focus
- Causes: ischemia, electrolyte imbalances (especially hypokalemia), digitalis toxicity, excess catecholamines
- Ectopic beats emanating from below SA node produce abnormal conduction patterns visible on ECG
SECTION 8: ROLE OF THE PURKINJE SYSTEM IN CAUSING NORMAL VENTRICULAR CONTRACTION
- Synchronous activation of ventricular muscle for maximum pumping efficiency
- Ensures endocardial-to-epicardial activation direction → depolarization wave front moves from inside to outside of ventricular wall
- Impulse must travel through ventricular muscle (slow, 0.3-0.5 m/sec)
- Activation becomes sequential rather than simultaneous
- QRS complex widens (>0.12 sec)
- Pumping efficiency reduced
SECTION 9: AUTONOMIC CONTROL OF HEART RHYTHMICITY AND CONDUCTION
Parasympathetic (Vagal) Stimulation
- Releases acetylcholine at vagal nerve endings
- Slows SA node discharge rate
- Decreases excitability of AV junctional fibers → slows/blocks AV conduction
| Vagal Stimulation Intensity | Effect |
|---|---|
| Weak-moderate | Slows heart rate to ~1/2 normal |
| Strong | Can completely stop SA node firing; or completely block AV conduction |
| After complete block | Ventricles undergo ventricular escape at 15-40 bpm (Purkinje pacemaker) |
- ACh binds M₂ muscarinic receptors on SA/AV nodal cells
- Activates I_KACh (acetylcholine-activated K⁺ current) via G-protein (Gᵢ)
- Increased K⁺ permeability → rapid K⁺ efflux → hyperpolarization
- In SA node: resting potential becomes -65 to -75 mV (vs. normal -55 to -60 mV)
- More negative starting point → slow upward drift takes longer to reach threshold → slower rate
- Strong enough vagal stimulation → cannot reach threshold → sinus arrest
- In AV node: hyperpolarization → decreased excitability → less likely that small atrial impulses can excite nodal fibers → conduction delay or block
Sympathetic Stimulation
- Increases SA node discharge rate (positive chronotropy)
- Increases conduction velocity throughout the heart (positive dromotropy)
- Increases excitability in all portions of the heart
- Increases force of contraction (positive inotropy - see Chapter 9)
- Almost triple heartbeat frequency (up to ~180-200 bpm)
- Increase contractile strength up to 2-fold
- Norepinephrine released at sympathetic nerve endings → binds β₁-adrenergic receptors
- Activates Gs → increases cAMP → activates PKA
- In SA node:
- Increases permeability to Na⁺ and Ca²⁺
- Resting potential becomes more positive (less negative) → closer to threshold
- Rate of upward drift of diastolic membrane potential increases → threshold reached sooner → faster heart rate
- I_f (funny current / HCN channels) activated → accelerates pacemaker potential
- In AV node and Purkinje system:
- Increased excitability → faster conduction
- In ventricular muscle:
- More Ca²⁺ entry and enhanced Ca²⁺ release from SR → stronger contraction
SECTION 10: ABNORMAL RHYTHMS - OVERVIEW
Heart Block
- SA nodal block: impulses fail to leave SA node → bradycardia or sinus arrest
- First-degree AV block: PR interval prolonged (>0.2 sec) but every impulse conducted
- Second-degree AV block: some impulses blocked at AV node (e.g., 2:1 - every other P wave conducts)
- Third-degree (complete) AV block: no atrial impulses reach ventricles
- Ventricles "escape" at their own idioventricular rate of 15-40 bpm (very slow)
- Patient may develop Stokes-Adams syndrome (fainting attacks from insufficient cardiac output)
- Treatment: artificial cardiac pacemaker
Purkinje System Block
- Block in the left or right bundle branch → bundle branch block
- Impulse must travel through slow ventricular muscle from the unblocked side
- Delayed activation of one ventricle → widened QRS (>0.12 sec)
- Both ventricles still eventually depolarize
- Left bundle branch block more clinically significant (larger LV mass)
Premature Contractions (Extrasystoles)
- Caused by ectopic foci anywhere in the heart
- After an extrasystole, a compensatory pause occurs (next SA impulse arrives when ventricle is still refractory from the extrasystole → ventricle skips one beat)
- Causes of ectopic beats: caffeine, nicotine, lack of sleep, anxiety, ischemia, electrolyte disorders, digitalis toxicity
SECTION 11: CARDIAC RESYNCHRONIZATION THERAPY (CRT) - Clinical Application
- In heart failure with left bundle branch block: both ventricles do not contract simultaneously
- Left ventricle contracts late → reduces pumping efficiency
- Biventricular pacing (CRT): paces both ventricles simultaneously to restore synchrony
- Improves cardiac output, reduces heart failure symptoms
- Demonstrated survival benefit in selected patients with:
- Reduced ejection fraction (EF ≤35%)
- Wide QRS (≥130-150 ms, especially with LBBB morphology)
- Symptomatic heart failure despite optimal medical therapy
KEY NUMBERS TO REMEMBER - CHAPTER 10
| Parameter | Value |
|---|---|
| SA node dimensions | 3 mm × 15 mm × 1 mm |
| SA node resting potential | -55 to -60 mV |
| Ventricular muscle resting potential | -85 to -90 mV |
| SA node threshold potential | ~-40 mV |
| SA node intrinsic rate | 60-100 bpm |
| AV junction intrinsic rate | 40-60 bpm |
| Purkinje fiber intrinsic rate | 15-40 bpm |
| Conduction velocity - Purkinje fibers | 4.0 m/sec (fastest) |
| Conduction velocity - AV node | 0.02-0.05 m/sec (slowest) |
| Conduction velocity - atrial muscle | 1.0 m/sec |
| Conduction velocity - ventricular muscle | 0.3-0.5 m/sec |
| SA → AV node conduction time | ~0.03 sec |
| AV nodal delay | ~0.09 sec |
| Total SA → ventricle delay | ~0.16 sec |
| Total ventricular depolarization time | ~0.06 sec |
| Atria depolarize completely in | ~0.08-0.09 sec |
| Ventricular escape rate (complete AV block) | 15-40 bpm |
| Vagal hyperpolarization shifts SA potential to | -65 to -75 mV |
| Max HR with sympathetic stimulation | 180-200 bpm (rarely 250) |
| Max strength increase with sympathetic | ~2-fold |
Continue with Chapter 11 notes (Electrocardiogram)
GUYTON & HALL - TEXTBOOK OF MEDICAL PHYSIOLOGY
CHAPTER 11: The Normal Electrocardiogram
OVERVIEW
- Cardiac arrhythmias
- Myocardial infarction and ischemia
- Ventricular hypertrophy
- Bundle branch blocks
- Electrolyte abnormalities
SECTION 1: WAVEFORMS OF THE NORMAL ECG
The Three Main Components
| Waveform | Cause | Type of Wave |
|---|---|---|
| P wave | Atrial depolarization (before atrial contraction) | Depolarization wave |
| QRS complex | Ventricular depolarization (before ventricular contraction) | Depolarization wave |
| T wave | Ventricular repolarization | Repolarization wave |
The QRS Complex
- Often (but not always) three separate waves:
- Q wave - first downward deflection before the R wave; small negative wave
- R wave - large upward (positive) deflection
- S wave - downward deflection after R wave
- Not every QRS complex has all three components visible in every lead
Normal Intervals and Durations
| Measurement | Normal Value |
|---|---|
| P wave duration | ~0.08-0.10 sec |
| PR interval (P onset to QRS onset) | 0.12-0.20 sec |
| QRS complex duration | 0.06-0.10 sec (up to 0.12 sec) |
| ST segment | Isoelectric (at baseline) |
| T wave | 0.10-0.25 sec |
| QT interval (onset QRS to end T) | 0.35-0.44 sec (varies with rate) |
SECTION 2: DEPOLARIZATION WAVES vs. REPOLARIZATION WAVES - The Fundamental Distinction
Depolarization Wave (e.g., QRS)
- As depolarization spreads from left to right across a muscle fiber:
- The leading (already depolarized) area = negative outside
- The trailing (still polarized) area = positive outside
- Electrode near the positive end records a positive deflection
- When depolarization is complete: both ends equally depolarized → returns to zero
Repolarization Wave (e.g., T wave)
- As repolarization spreads from left to right across a muscle fiber:
- The leading (already repolarized) area = positive outside
- The trailing (still depolarized) area = negative outside
- Opposite polarity from the depolarization wave
- Electrode near the leading end records a negative deflection
Why the T Wave Is Upright (Same Direction as QRS) in Normal Hearts
- In normal ventricular muscle, repolarization occurs in the opposite order from depolarization
- Depolarization: endocardium → epicardium (inner to outer)
- Repolarization: epicardium → endocardium (outer to inner, because epicardial action potentials are shorter)
- Because repolarization travels in the reverse direction from depolarization, its polarity is again the same as the QRS (positive end still toward the apex)
- Net result: T wave is concordant (same direction) with QRS in normal hearts
Relation of Monophasic Action Potential to QRS and T Waves
- QRS begins when ventricular muscle depolarizes
- ST segment corresponds to the plateau of the action potential (isoelectric because all cells are equally depolarized - no current flowing between cells)
- T wave corresponds to repolarization as cells return to resting potential
SECTION 3: CURRENT FLOW IN THE CHEST AROUND THE HEART
How Currents Reach the Body Surface
- From the depolarized (negative) area
- To the still-polarized (positive) area
- In large circuitous routes through body fluids
Direction of Current Flow During Ventricular Depolarization
- Cardiac impulse arrives first in the septum (left endocardium of septum first)
- Spreads to inner surfaces of both ventricles (endocardial surfaces)
- This creates: electronegativity on inside, electropositivity on outer ventricular walls
- Current flows through body fluids along elliptical paths
- Algebraic average of all current flows = current predominantly directed from base toward apex (base = negative end, apex = positive end)
- This remains true for most of ventricular depolarization
- Exception: Very end of depolarization - last areas to depolarize are the outer walls near the ventricular base → current briefly reverses (~0.01 sec)
- Electrode nearer the base = negative
- Electrode nearer the apex = positive
- Recording meter shows a positive deflection (R wave in most leads)
SECTION 4: THE ELECTROCARDIOGRAPHIC LEADS
Three Standard Bipolar Limb Leads
| Lead | Positive Electrode | Negative Electrode | Axis of Lead |
|---|---|---|---|
| Lead I | Left arm (LA) | Right arm (RA) | 0° (horizontal, pointing left) |
| Lead II | Left leg (LL) | Right arm (RA) | +60° (downward to the left) |
| Lead III | Left leg (LL) | Left arm (LA) | +120° (downward to the right) |
Lead I + Lead III = Lead II (At any instant, the sum of the voltages in leads I and III equals the voltage in lead II. This is a mathematical consequence of the geometry of Einthoven's triangle.)
- Lead I: Positive P wave, positive QRS (upright R), positive T wave
- Lead II: All waves positive and largest (axis of lead closest to mean cardiac vector of +60°)
- Lead III: Variable; P and T waves usually positive; QRS may be positive, biphasic, or negative
Precordial (Chest) Leads: V1-V6
- Positive electrode: placed on anterior chest wall at six standard positions
- Negative (indifferent) reference electrode (Wilson's Central Terminal): connected through equal resistances to RA, LA, and LL simultaneously (creates a near-zero reference)
Electrode Positions:
| Lead | Position |
|---|---|
| V1 | 4th intercostal space, right sternal border |
| V2 | 4th intercostal space, left sternal border |
| V3 | Between V2 and V4 |
| V4 | 5th intercostal space, midclavicular line |
| V5 | 5th intercostal space, anterior axillary line |
| V6 | 5th intercostal space, midaxillary line |
QRS Morphology in Chest Leads:
- V1, V2 (near the base): QRS mainly negative - electrode is closer to the base, which is the direction of electronegativity during most depolarization
- V4, V5, V6 (near the apex): QRS mainly positive - electrode is closer to the apex (direction of electropositivity during most depolarization)
- V3 = transitional zone - QRS is biphasic (equiphasic)
- R wave progression: R wave should grow progressively taller from V1 to V5/V6 (poor R wave progression suggests anterior MI or LV dysfunction)
Augmented (Unipolar) Limb Leads: aVR, aVL, aVF
| Lead | Positive Electrode | Axis |
|---|---|---|
| aVR (augmented Vector Right) | Right arm | -150° |
| aVL (augmented Vector Left) | Left arm | -30° |
| aVF (augmented Vector Foot) | Left leg/foot | +90° |
- aVR: Inverted (negative) P, QRS, and T - because positive electrode is on the right arm which "looks away" from the cardiac apex (the heart's electrical mean vector points away from aVR's positive electrode)
- aVL: Similar to Lead I
- aVF: Similar to Lead II; all waves usually positive (positive electrode at foot, looks up toward cardiac apex)
The 12-Lead ECG: Summary of All 6 Limb + 6 Chest Leads
| Region of Leads | Leads | Heart Wall "Viewed" |
|---|---|---|
| Inferior | II, III, aVF | Inferior (diaphragmatic) wall of LV |
| Lateral | I, aVL, V5, V6 | Lateral wall of LV |
| Anterior | V1-V4 | Anterior wall of LV and septum |
| Right ventricular | V1, V3R, V4R | Right ventricle |
SECTION 5: THE NORMAL ECG WAVEFORM DETAILS
P Wave
- Cause: Depolarization spreading from SA node through the atria
- Duration: ~0.08-0.10 sec
- Amplitude: Small (atrial muscle mass is small)
- In lead II: upright, rounded, smooth
- Normally < 0.12 sec wide and < 2.5 mm tall
PR Interval
- From onset of P wave to onset of QRS complex
- Represents: atrial depolarization + AV nodal delay + Bundle of His conduction
- Normal: 0.12-0.20 sec (120-200 ms)
- Mostly represents the AV nodal delay (~0.09 sec of the total)
- Shortens with faster heart rates; lengthens with slower rates
QRS Complex
- Cause: ventricular depolarization
- Normal duration: 0.06-0.10 sec (60-100 ms)
-
0.12 sec (120 ms) = abnormal ("wide QRS"), suggests bundle branch block or ventricular origin
Q Wave:
- Small initial negative deflection in some leads
- Represents initial septal depolarization (left to right, away from most electrodes)
- Pathological Q wave: > 0.04 sec wide or > 25% of R wave height = suggests prior MI
- Normal septal Q waves: small, narrow, in leads I, aVL, V5, V6
R Wave:
- Main upward deflection
- Largest component in most leads
- Height depends on the magnitude of ventricular muscle mass and proximity of electrode
S Wave:
- Terminal downward deflection
- Represents late ventricular depolarization (basal portions of LV)
ST Segment
- From end of QRS to beginning of T wave
- Represents: period when all ventricular muscle is depolarized (plateau phase of action potential)
- Normal: isoelectric (flat at baseline) → no voltage difference between any ventricular areas
- ST elevation: Injury (early MI, Prinzmetal angina, pericarditis)
- ST depression: Subendocardial ischemia, reciprocal change
T Wave
- Cause: ventricular repolarization
- Occurs 0.25-0.35 sec after depolarization
- Normally upright in leads I, II, V3-V6 (concordant with QRS because of epicardial-to-endocardial repolarization)
- Normally inverted (negative) in aVR
- Variable in III, aVL, V1, V2
U Wave
- Small wave after T wave (not always present)
- Thought to represent repolarization of Purkinje fibers or mid-myocardial cells
- Prominent U waves: seen in hypokalemia
QT Interval
- From onset of QRS to end of T wave
- Represents total duration of ventricular depolarization + repolarization
- Normal: 0.35-0.44 sec (varies inversely with heart rate - shortens at faster rates)
- Corrected QT interval: QTc = QT / √RR (Bazett's formula)
- QTc > 0.44-0.45 sec = prolonged → risk of fatal arrhythmias (torsades de pointes)
SECTION 6: RECORDING SYSTEMS AND PAPER
ECG Paper
- Standard speed: 25 mm/sec
- Small squares: 1 mm × 1 mm = 0.04 sec horizontally; 0.1 mV vertically (at standard calibration of 1 mV/10 mm)
- Large squares: 5 mm × 5 mm = 0.2 sec horizontally; 0.5 mV vertically
- Standard calibration: 1 mV = 10 mm deflection (shown as calibration pulse at start of tracing)
Calculating Heart Rate from ECG
- Count the number of large squares (each = 0.2 sec) between two consecutive R waves
- Heart rate = 300 / number of large squares between R waves
- Or: count QRS complexes in 6-second strip × 10 = rate per minute
SECTION 7: CLINICAL CORRELATION - WHAT CHANGES THE ECG
Abnormalities Visible on the Normal Baseline ECG
- Left ventricular hypertrophy (LVH): Increased QRS voltage (tall R in V5/V6, deep S in V1), left axis deviation, ST-T changes (strain pattern)
- Right ventricular hypertrophy (RVH): Tall R in V1, right axis deviation, inverted T in V1-V3
- Ischemia: ST depression, T wave inversion
- Acute injury (STEMI): ST elevation
- Old infarct: Pathological Q waves
- Hyperkalemia: Peaked T waves → wide QRS → sine wave pattern
- Hypokalemia: Flat/inverted T waves, prominent U waves, prolonged QT
- Hypercalcemia: Shortened QT
- Hypocalcemia: Prolonged QT
- Visible as changes in rate, regularity, P wave morphology, PR interval, QRS width
SECTION 8: NORMAL ECG AXIS AND MEAN CARDIAC VECTOR
The Mean QRS Axis
- Normal axis: approximately +59° (pointing downward and to the left, toward the apex)
- This means during most of ventricular depolarization, the apex remains positive relative to the base
Normal Axis Range:
- Normal: -30° to +90°
- Left axis deviation (LAD): more negative than -30° → suggests LVH, left anterior fascicular block
- Right axis deviation (RAD): more positive than +90° → suggests RVH, left posterior fascicular block, dextrocardia
Why the Normal Axis Is Around +59°
- The left ventricle is larger and depolarizes slightly later
- The predominant direction of depolarization wave front moves down and to the left toward the apex of the left ventricle
KEY NUMBERS TO REMEMBER - CHAPTER 11
| Parameter | Normal Value |
|---|---|
| PR interval | 0.12-0.20 sec |
| QRS duration | 0.06-0.10 sec (max 0.12 sec) |
| QT interval | 0.35-0.44 sec (rate-dependent) |
| T wave timing after depolarization | 0.25-0.35 sec |
| ECG paper speed | 25 mm/sec |
| Small square = | 0.04 sec / 0.1 mV |
| Large square = | 0.20 sec / 0.5 mV |
| Standard calibration | 1 mV = 10 mm |
| Normal mean QRS axis | ~+59° (range -30° to +90°) |
| QTc prolonged if | > 0.44-0.45 sec |
| Pathological Q wave | > 0.04 sec wide OR > 25% R wave height |
| Lead II largest voltage | Because its axis (+60°) is closest to mean cardiac vector (+59°) |
| aVR is always inverted | Positive electrode looks away from apex |
Continue with Chapter 12 notes
GUYTON & HALL - TEXTBOOK OF MEDICAL PHYSIOLOGY
CHAPTER 12: Electrocardiographic Interpretation of Cardiac Muscle and Coronary Blood Flow Abnormalities: Vectorial Analysis
OVERVIEW
- The concept of vectors representing cardiac electrical potentials
- How to determine the mean electrical axis of the ventricles
- How to interpret abnormal axis deviations
- How the ECG changes with ventricular hypertrophy
- How ischemia, injury, and infarction alter the ECG
- The current of injury concept and its use in diagnosing MI
SECTION 1: VECTORS REPRESENTING ELECTRICAL POTENTIALS
What Is a Vector?
- A vector is an arrow that:
- Points in the direction of the electrical potential generated by current flow
- Has the arrowhead at the positive end
- Has a length proportional to the voltage of the potential
Instantaneous Mean Vector
- Current flows predominantly from base toward apex (base = negative, apex = positive)
- The instantaneous mean vector points from base to apex
- This is a long vector (large current, large voltage)
SECTION 2: THE DIRECTION OF A VECTOR IN DEGREES - THE REFERENCE SYSTEM
Degree Convention (Frontal Plane)
| Direction | Degrees |
|---|---|
| Exactly horizontal, pointing left | 0° (zero reference point) |
| Pointing straight downward | +90° |
| Pointing right (exactly horizontal) | +180° |
| Pointing straight upward | -90° (or +270°) |
| Upper left quadrant | -1° to -179° |
| Lower right quadrant | +91° to +179° |
Normal Mean QRS Vector
- The average direction of the vector during spread of the depolarization wave through the ventricles = mean QRS vector
- Normal mean QRS vector = approximately +59° (pointing downward and to the left, toward the cardiac apex)
- This means: during most ventricular depolarization, the apex remains positive relative to the base
SECTION 3: AXES OF THE STANDARD LEADS
| Lead | Axis (degrees) |
|---|---|
| Lead I | 0° (horizontal, positive = left) |
| Lead II | +60° (positive = lower left) |
| Lead III | +120° (positive = lower right) |
| aVR | -150° (positive = upper right) |
| aVL | -30° (positive = upper left) |
| aVF | +90° (positive = straight down) |
How a Vector Projects onto a Lead
- When the heart vector points in the same direction as a lead's axis → maximum positive recording in that lead
- When the heart vector is perpendicular to a lead's axis → zero (isoelectric) in that lead
- When the heart vector points away from a lead's positive electrode → negative recording
SECTION 4: VECTORCARDIOGRAM
Definition
- As depolarization sweeps through the ventricles, the instantaneous mean vector changes both magnitude and direction
- Plotting the tip of this changing vector traces a loop
QRS Loop
- Represents the changing mean vector during ventricular depolarization
- Begins at center (zero), sweeps outward (increasing voltage), then returns to center (all depolarized)
- The loop for a normal heart is oriented mainly in the +40° to +70° direction (downward-left)
T Loop
- Represents the changing mean vector during ventricular repolarization
- In the normal heart: T loop is oriented in approximately the same direction as the QRS loop
- This is why the T wave is concordant (same polarity) with the QRS complex in most leads
SECTION 5: DETERMINING THE MEAN ELECTRICAL AXIS FROM STANDARD LEADS
Clinical Method (Using Leads I and III)
- Net QRS = positive area minus negative area of the QRS
- If the QRS is entirely positive, net potential = total positive amplitude
- If part is negative, subtract the negative area from the positive area
- On the lead I axis (horizontal line at 0°): plot the net voltage of lead I
- On the lead III axis (+120°): plot the net voltage of lead III
SECTION 6: NORMAL AXIS AND AXIS DEVIATIONS
Normal Range
- Normal mean electrical axis: -30° to +90°
- Most commonly +59° in normal adults
Axis Deviations and Their Causes
| Axis | Degrees | Common Causes |
|---|---|---|
| Normal axis | -30° to +90° | Normal heart |
| Left Axis Deviation (LAD) | more negative than -30° | LV hypertrophy, left anterior fascicular block (LAFB), inferior MI, left bundle branch block, pregnancy, obesity |
| Right Axis Deviation (RAD) | more positive than +90° | RV hypertrophy, left posterior fascicular block (LPFB), right bundle branch block, lateral MI, dextrocardia, normal variant in tall/thin people |
| Extreme axis deviation | -90° to ±180° | Severe LVH, LBBB with LAD, ventricular ectopic rhythm |
Physiological Causes of Normal Axis Variation
- Normal hearts: axis may vary from about +20° to +100° depending on:
- Anatomical differences in Purkinje distribution
- Body position (lying vs. standing)
- Body habitus (obese = more horizontal = more leftward; tall, thin = more vertical = more rightward)
- Inspiration vs. expiration (inspiration lowers diaphragm → heart more vertical → RAD tendency)
Change in Heart Position in the Chest
- Heart tipped to the left (e.g., during expiration, obesity, pregnancy): mean electrical axis swings toward left axis deviation
- Heart tipped to the right (e.g., during inspiration, tall/thin person): mean electrical axis swings toward right axis deviation
- These are purely positional changes, NOT pathological
Left Ventricular Hypertrophy (LVH) Causing LAD
- LV massively enlarged → greater electrical potentials generated by larger LV muscle mass
- Mean QRS vector swings further to the left and slightly upward
- In extreme LVH: axis may reach -20° to -30° (left axis deviation)
- Also: increased QRS voltage, prolonged QRS duration (longer travel path through larger muscle mass)
Right Ventricular Hypertrophy (RVH) Causing RAD
- Normal RV generates only 25% of the total QRS vector (much smaller than LV)
- In RVH: RV mass increases dramatically relative to LV
- RV vectors now dominate → mean QRS vector shifts to the right, often to +110° to +180°
- ECG: tall R wave in V1, deep S wave in V5/V6, right axis deviation
SECTION 7: BUNDLE BRANCH BLOCK AND QRS CHANGES
Complete Left Bundle Branch Block (LBBB)
- Left bundle branch blocked → LV depolarizes late via slower conduction through ventricular muscle
- Right ventricle depolarizes first (normally)
- Then depolarization spreads slowly through left ventricular muscle from right to left
- Result:
- QRS duration ≥ 0.12 sec (widened)
- Mean QRS vector swings to the left (because LV depolarizes last and predominates)
- Left axis deviation common
- Wide, notched R wave in leads I and aVL ("M" shape or "RSR' pattern")
- Wide, deep S wave in leads V1 and V2
Complete Right Bundle Branch Block (RBBB)
- Right bundle branch blocked → RV depolarizes late via slow spread through ventricular muscle
- LV depolarizes first (normally)
- Then depolarization spreads slowly through RV from left to right
- Result:
- QRS duration ≥ 0.12 sec (widened)
- Mean QRS vector may swing to the right (because RV depolarizes last)
- RSR' pattern in V1 ("rabbit ears" or "M-shaped" QRS in V1)
- Wide, deep S wave in leads I, V5, V6
- RBBB is often benign; LBBB more commonly associated with serious disease
Purkinje System Block Prolongs QRS
- Any block in the Purkinje system → impulse must travel slowly through ventricular muscle
- Slows overall ventricular conduction → widens QRS beyond 0.12 sec
- Also causes the heart vector to remain pointed in one direction for a longer time during the slowly conducting portion
- This creates the tall, bizarre QRS patterns seen in bundle branch blocks
SECTION 8: VENTRICULAR VOLTAGE AND QRS AMPLITUDE
Increased QRS Voltage
- Normal amplitude of QRS in standard leads: about 1 mV peak-to-peak (varies widely)
- QRS voltage increases when:
- Hypertrophy of ventricular muscle → more muscle mass generating more current
- Thin chest wall → electrodes closer to the heart
- Increased conductance of surrounding tissues
- S wave in V1 + R wave in V5 or V6 > 35 mm (3.5 mV)
- R wave in aVL > 11 mm (1.1 mV)
- R wave in lead I > 15 mm
Decreased QRS Voltage
-
Multiple old myocardial infarcts (cardiomyopathy):
- Loss of muscle mass → less current generated → lower voltage
- Depolarization wave slows through fibrotic areas → prolonged QRS simultaneously
- Low-voltage ECG with wide QRS = classic pattern after multiple MIs
-
Infiltrative myocardial disease:
- Cardiac amyloidosis: Abnormal proteins infiltrate myocardium
- Classic pattern: low voltage in limb leads despite possibly increased wall thickness (due to amyloid deposition)
- Discordance between echo wall thickness and ECG voltage is a hallmark of amyloidosis
-
Pericardial effusion:
- Extracellular fluid in pericardial sac = highly conductive
- "Short-circuits" electrical potentials - current flows through pericardial fluid instead of reaching chest wall electrodes
- Dramatically reduces ECG voltages in all leads
- Large enough effusion → electrical alternans (alternating QRS axis/voltage with each beat as heart swings in fluid)
-
Pleural effusion:
- Same mechanism but less pronounced than pericardial effusion
- Fluid around lungs short-circuits electricity to body surface
-
Pulmonary emphysema:
- Increased air content in lungs → air is a poor electrical conductor (insulator)
- Lungs envelop heart to a greater extent
- Prevents spread of electrical voltage from heart to body surface
- Results in decreased ECG potentials in all leads
SECTION 9: PROLONGED AND BIZARRE QRS PATTERNS
Prolonged QRS (> 0.12 sec) - Causes
-
Ventricular hypertrophy or dilation:
- Larger muscle mass → longer path for depolarization wave to travel
- Normal QRS: 0.06-0.08 sec
- In hypertrophy/dilation: can reach 0.09-0.12 sec
-
Bundle branch block:
- Impulse must travel through slow ventricular muscle
- QRS: typically 0.14-0.20 sec
-
Premature ventricular contractions (PVCs):
- Ectopic impulse originates in ventricular muscle (not Purkinje system)
- Spreads entirely through slow ventricular muscle
- QRS extremely wide and bizarre
-
Multiple old infarcts with fibrosis:
- Multiple areas of slow conduction
- QRS prolonged + low voltage
SECTION 10: CURRENTS OF INJURY - THE ECG OF ISCHEMIA AND INFARCTION
The Concept of Current of Injury
- Injured muscle remains partially or fully depolarized even during diastole
- While surrounding normal muscle is repolarized and polarized (resting potential)
- This creates a voltage difference between injured and normal areas during diastole
- Current flows from the polarized (normal) area to the depolarized (injured) area during diastole = "current of injury"
How the Current of Injury Distorts the ECG Baseline
- Current of injury flows continuously during diastole (between beats)
- The true baseline (T-P segment) shifts due to this injury current
- However, the ECG machine continuously re-zeros itself around this shifted baseline
- The net result appears as a displacement of the ST segment relative to the T-P segment
- Positive injury potential (normal tissue near recording electrode, injured tissue away) → ST elevation in that lead
- Negative injury potential (injured tissue near recording electrode) → ST depression in that lead
The J Point - Zero Reference for Injury Potentials
- The J point = the exact moment when ventricular depolarization is complete (end of QRS)
- At the J point: ALL ventricular muscle is depolarized (normal + injured) → no current of injury flowing → this instant = true zero potential
- A horizontal line drawn through the J point = the zero voltage baseline
- Injury potential in any lead = the difference between the T-P segment level and the J-point baseline
Using J Point to Analyze the Injury Vector
- Draw horizontal line through J point in each lead (= true zero)
- Measure the injury potential above or below this line in leads I and III
- Plot these on the lead axes
- Draw perpendiculars from the tips
- The intersection = apex of the injury potential vector
- The vector points from injured (negative) area to normal (positive) area
SECTION 11: ECG CHANGES IN MYOCARDIAL INFARCTION
Stages of ECG Changes After Acute MI
| Time After MI | ECG Finding | Mechanism |
|---|---|---|
| Immediate (minutes) | Tall, peaked hyperacute T waves | Early ischemia → altered repolarization |
| Minutes to hours | ST elevation in leads facing infarct | Current of injury from acutely injured (still viable but injured) muscle |
| Hours to days | ST elevation + Q waves developing | Central infarct (dead) + injury zone around it |
| Days to weeks | ST elevation gradually resolves | Injury current diminishes as border zone heals or dies |
| Permanent (weeks+) | Pathological Q waves remain | Dead, non-conducting muscle mass (electrical "window") |
ST Elevation in Acute MI (STEMI)
- The acutely injured muscle is depolarized even during diastole → current of injury
- Leads facing the infarcted wall show ST elevation
- Leads on the opposite wall show reciprocal ST depression
- ST elevation in V1-V4 (anterior chest leads)
- Reciprocal ST depression in II, III, aVF
- ST elevation in II, III, aVF
- Reciprocal ST depression in I, aVL, V1-V3
- ST elevation in I, aVL, V5, V6
- Reciprocal ST depression in V1-V3 (because posterior wall is far from anterior leads)
- Tall R waves in V1, V2 (mirror image of Q waves that would appear from the back)
Current of Injury: Anterior vs. Posterior Wall Infarction
- Injury vector points anteriorly (toward the normal posterior wall and away from the injured anterior wall)
- Chest lead facing anterior wall: injury potential negative (below J-point baseline) → this appears as ST elevation in the clinical convention
- (Note: Guyton explains this from first principles - the positive end of the injury vector points to normal tissue)
- Injury potential negative in leads II and III (posterior infarct at apex)
- Vectorial analysis: resultant injury vector ~-95° (negative end pointing downward toward injured apex)
- Helps localize the infarct to the posterior-apical portion of LV
Permanent Q Waves After MI
- Dead muscle = electrically silent (no action potentials)
- Creates an electrical "window" in the ventricular wall
- Electrodes "looking through" this window record the opposite wall's potentials as negative
- Results in pathological Q waves in leads facing the infarcted area
- Q waves persist for life as a permanent marker of old MI
- Q waves develop in Lead I (or V1-V4) due to loss of anterior LV muscle
- Q waves develop in Lead III (and II, aVF) due to loss of posterior-apical muscle
Characteristics of Pathological Q Waves:
- Duration ≥ 0.04 sec (40 ms)
- Amplitude ≥ 25% of the R wave height in the same lead
- (Normal small septal q waves: narrow, < 0.04 sec, < 25% R wave height)
Progressive ECG Recovery After MI (Fig 12.21 pattern)
- Day 1: Strong injury current (ST elevation or T-P displacement)
- ~1 week: Injury potential diminishing
- 3 weeks: Injury potential gone; Q waves remain
- 1 year: Stable ECG with Q waves; recovery via new collateral coronary flow
- If blood supply never adequately restored → injury potential persists indefinitely (especially during exercise)
SECTION 12: ANGINA PECTORIS AND ECG DURING ISCHEMIA
Angina Pectoris
- "Angina pectoris" = chest pain from heart ischemia, felt in the pectoral region
- Typically radiates to left neck and down the left arm
- Caused by moderate-to-severe ischemia of the heart muscle
- Usually absent at rest; appears when heart is overworked (exercise, stress)
ECG During Angina Attack
- During ischemia: injured muscle produces a current of injury
- Manifests as:
- ST depression (subendocardial ischemia - most common type)
- ST elevation (transmural ischemia, as in Prinzmetal's variant angina from coronary spasm)
- T wave inversion in leads facing ischemic area
- ECG returns to normal when ischemia resolves (unlike in MI where Q waves are permanent)
- Exercise stress test deliberately provokes ischemia to detect these changes
SECTION 13: EFFECT OF SLOW CONDUCTION ON T WAVE (CONNECTION TO CHAPTER CONTENT)
Why T Wave Is Normally Concordant with QRS
- Ventricular depolarization: endocardium → epicardium (slow via Purkinje + muscle)
- Ventricular repolarization: epicardium → endocardium (epicardial cells repolarize first - shorter action potentials)
- Because repolarization travels in the reverse direction from depolarization → same polarity appears in each lead → T wave upright where QRS is upright
When Slow Conduction Distorts the T Wave
- If one ventricle or region is slow to depolarize (e.g., bundle branch block):
- Areas that depolarized late also repolarize late
- Repolarization sequence becomes distorted
- T wave axis may no longer be concordant with QRS
- T wave inversion or biphasic T waves appear in certain leads
- In bundle branch block: T waves are typically discordant (opposite direction) to the main QRS deflection
- E.g., in LBBB: large positive R in V5/V6 → T wave inverted in V5/V6 (secondary repolarization abnormality)
KEY NUMBERS TO REMEMBER - CHAPTER 12
| Parameter | Value |
|---|---|
| Normal mean QRS axis | +59° (range -30° to +90°) |
| Left axis deviation | more negative than -30° |
| Right axis deviation | more positive than +90° |
| Normal QRS duration | 0.06-0.08 sec |
| Prolonged QRS (bundle branch block) | ≥ 0.12 sec |
| Sokolow-Lyon LVH criterion (voltage) | S in V1 + R in V5/V6 > 35 mm |
| Pathological Q wave width | ≥ 0.04 sec |
| Pathological Q wave depth | ≥ 25% of R wave height |
| ST elevation in STEMI leads | Faces the infarcted wall |
| ST depression = reciprocal changes | Opposite wall leads |
| Injury vector positive end | Points toward normal muscle |
| J point definition | End of QRS = true zero voltage reference |
| Normal voltage (standard leads) | ~1 mV peak-to-peak |
| Cardiac amyloidosis ECG hallmark | Low voltage + increased wall thickness (discordance) |
Continue with Chapter 14
continue with chapter 15
GUYTON & HALL - TEXTBOOK OF MEDICAL PHYSIOLOGY
CHAPTER 15: Vascular Distensibility and Functions of the Arterial and Venous Systems
OVERVIEW
- Vascular distensibility and compliance - how vessels expand and store blood
- Arterial pressure pulsations - the generation, characteristics, and transmission of pulse pressure
- Venous functions - venous pressure, the venous pump, and blood reservoir role of veins
SECTION 1: VASCULAR DISTENSIBILITY
Definition and Formula
Vascular distensibility = Increase in volume / (Increase in pressure × Original volume)
- Units: fraction per mm Hg (or % per mm Hg)
- Example: If 1 mm Hg pressure rise causes a vessel originally containing 10 mL to expand by 1 mL → distensibility = 1/10 = 0.1 per mm Hg = 10% per mm Hg
Veins Are Far More Distensible Than Arteries
| Vessel Type | Relative Distensibility |
|---|---|
| Systemic veins | ~8× more distensible than arteries |
| Systemic arteries | Reference (1×) |
| Pulmonary arteries | ~6× more distensible than systemic arteries |
| Pulmonary veins | Similar to systemic veins |
- Arterial walls are thick and strong (contain more elastin and collagen) to withstand high systolic pressure
- Venous walls are thin and compliant because they operate at low pressures
- Arteries act as a pressure reservoir (Windkessel effect)
- During systole: arteries distend to accept the stroke volume → store pressure
- During diastole: artery walls recoil → continue to push blood forward
- Result: converts pulsatile cardiac output into a more continuous flow through capillaries
SECTION 2: VASCULAR COMPLIANCE (CAPACITANCE)
Definition and Formula
Vascular compliance = Increase in volume / Increase in pressure
Compliance vs. Distensibility - Critical Distinction
Compliance = Distensibility × Volume
- A vessel can be highly distensible but have low compliance if it has a very small volume
- Conversely: a less distensible vessel with a large volume can have high compliance
- Veins are 8× more distensible than arteries AND have ~3× more volume
- Therefore, venous compliance = 8 × 3 = 24× greater than arterial compliance
Volume-Pressure Curves of the Systemic Circulation
- Normal filling (~700 mL) → mean arterial pressure ~100 mm Hg
- At only 400 mL → pressure falls to zero
- Relatively small volume changes → large pressure changes (low compliance)
- The arterial curve is steep (small volume range, large pressure range)
- Normal filling: 2,000-3,500 mL of blood
- Change of several hundred mL is required to change venous pressure by only 3-5 mm Hg
- This explains why 500 mL blood transfusion can be given in minutes without greatly altering circulatory function
- The venous curve is flat (large volume range, small pressure change)
Effect of Sympathetic Stimulation on Volume-Pressure Curves
- Sympathetic stimulation → increases vascular smooth muscle tone → arteries and veins contract → pressure increases at same volume (curve shifts up and left)
- Sympathetic inhibition → vascular relaxation → pressure decreases at same volume (curve shifts down and right)
- This gives the nervous system powerful control over blood distribution and venous return
- During hemorrhage: sympathetic activation constricts veins → maintains venous return and cardiac output despite blood loss
SECTION 3: ARTERIAL PRESSURE PULSATIONS
Why Pulsations Occur
Normal Arterial Pressure Values (Young Adult at Rest)
| Pressure | Value |
|---|---|
| Systolic pressure | ~120 mm Hg |
| Diastolic pressure | ~80 mm Hg |
| Pulse pressure | ~40 mm Hg (systolic - diastolic) |
| Mean arterial pressure (MAP) | ~93 mm Hg |
Pulse Pressure - Definition and Determinants
Pulse pressure = Systolic pressure - Diastolic pressure
Pulse pressure ≈ Stroke volume / Arterial compliance
- Greater SV → more blood enters arteries per beat → greater pressure rise → wider pulse pressure
- Example: exercise increases SV → increases pulse pressure
- Less compliant (stiffer) arteries → same SV causes a greater pressure rise → wider pulse pressure
- Example: arteriosclerosis → stiff arteries → increased pulse pressure
- Increased pulse pressure: arteriosclerosis, aortic regurgitation, patent ductus arteriosus, high fever (vasodilation), exercise
- Decreased pulse pressure: aortic stenosis, heart failure (reduced SV), hypovolemia
Mean Arterial Pressure (MAP)
- At normal heart rates (~72 bpm), the heart spends more time in diastole than systole
- Therefore, pressure stays closer to diastolic for a greater part of each cycle
MAP ≈ Diastolic pressure + 1/3 × Pulse pressure Or: MAP ≈ 0.6 × Diastolic + 0.4 × Systolic
SECTION 4: ABNORMAL PRESSURE PULSE CONTOURS
Aortic Stenosis
- Narrowed aortic valve opening → restricted blood flow into aorta
- Reduced systolic pressure peak
- Slow, gradual rise to a low, rounded peak
- Narrow, flat pulse contour
- Pulse pressure is reduced
- Classic term: "pulsus parvus et tardus" (small and slow pulse)
Patent Ductus Arteriosus (PDA)
- Persistent connection between aorta and pulmonary artery
- During systole: blood ejected into aorta
- During diastole: blood rushes backward from aorta → through PDA → into pulmonary artery
- Result: diastolic pressure falls very low before the next heartbeat
- Wide pulse pressure (high systolic, very low diastolic)
- Classic: "bounding" or "water-hammer" pulse
- Pulse pressure may reach 80-100 mm Hg or more
Aortic Regurgitation (Aortic Insufficiency)
- Incompetent aortic valve → during diastole, blood leaks back from aorta into LV
- High systolic pressure (large SV because LV fills with both pulmonary venous blood + regurgitant flow)
- Very low diastolic pressure (aorta empties backward into LV)
- Extremely wide pulse pressure
- Classic signs: Corrigan's (water-hammer) pulse, Quincke's sign, pistol-shot femorals
Arteriosclerosis (Arterial Stiffening)
- Stiff, noncompliant arteries
- Same SV → much greater pressure rise in systole
- Elevated systolic pressure, normal or low-normal diastolic
- Significantly increased pulse pressure
- Pulse rises and falls steeply
- Accounts for the typical rise in systolic pressure with aging
SECTION 5: TRANSMISSION OF PRESSURE PULSES TO PERIPHERAL ARTERIES
Damping of Pulsations Along the Vascular Tree
| Vessel | Approximate Pressure Range |
|---|---|
| Aortic root | 80-120 mm Hg (PP = 40) |
| Large arteries | 80-123 mm Hg (PP slightly increases first) |
| Small arteries | Narrowing pulsation |
| Arterioles | PP almost gone |
| Capillaries | Nearly no pulsation |
- Two opposing effects:
- Damping due to viscous resistance and vessel wall compliance → reduces pulsations
- Reflected waves from peripheral branches → overlap with incoming wave → can temporarily amplify the pulse in peripheral arteries
- Result: radial artery systolic pressure is slightly higher (~5-10 mm Hg) than aortic root systolic pressure (important clinically - peripheral systolic BP slightly overestimates central aortic systolic BP)
- Beyond the arterioles: wall compliance and viscous resistance damp pulsations completely → capillary flow is nearly non-pulsatile
Clinical Significance
- Capillary flow is almost entirely non-pulsatile → smooth, continuous delivery of nutrients to tissues
- Exception: some capillaries in highly vascular organs (kidneys, skeletal muscle) still show slight pulsatility
SECTION 6: MEASUREMENT OF ARTERIAL PRESSURE
Direct (Invasive) Methods
- Catheter inserted into artery → connected to a pressure transducer
- Most accurate; used in ICU/surgery
- Can record beat-to-beat variations and waveform morphology
Auscultatory Method (Korotkoff Sounds)
- Place sphygmomanometer cuff around upper arm
- Place stethoscope over the brachial artery at the antecubital fossa
- Inflate cuff above systolic pressure → brachial artery completely occluded → no sounds heard
- Slowly deflate the cuff while listening:
| Cuff Pressure | Event |
|---|---|
| Above systolic | Artery completely closed → silence |
| Just below systolic | Artery opens at systolic peak → first Korotkoff sound = systolic BP |
| Between systolic and diastolic | Sounds change: tapping → rhythmical → harsher |
| Near diastolic | Sounds become muffled (Korotkoff phase IV) |
| At or below diastolic | Sounds disappear completely (Korotkoff phase V) = diastolic BP |
- Blood jetting through the partially occluded artery in turbulent flow
- Turbulence creates vibrations of the arterial wall heard through the stethoscope
- When the artery is wide open (normal flow), laminar flow produces no sound
Automated Oscillometric Method
- Uses electronic pressure sensors instead of stethoscope
- Detects pressure oscillations in the cuff caused by pulsatile blood flow
- Maximum oscillation amplitude correlates with MAP
- Systolic and diastolic derived algorithmically
- Used in most automated blood pressure devices
- Accuracy depends on proper cuff size and patient movement
Normal Blood Pressure Values and Age-Related Changes
- Birth: ~70/40 mm Hg (low, rises rapidly in first weeks)
- Young adults (20-30 years): ~120/80 mm Hg
- With aging:
- Systolic pressure rises progressively
- Diastolic pressure rises until age ~50-55, then may plateau or decline
- Pulse pressure increases with age (increasing arterial stiffness)
- Until age ~45-55: men have slightly higher BP than women (few mm Hg)
- After menopause: women's BP rises to match men's (loss of estrogen's vasodilatory effect)
- Systolic pressure rises more steeply in both sexes
- Due to progressive arterial stiffening (atherosclerosis)
- Widened pulse pressure is a marker of increased cardiovascular risk in the elderly
SECTION 7: VEINS AND THEIR FUNCTIONS
Five Key Functions of Veins
- Conduits - return blood from capillaries to the right heart
- Blood reservoir - store large volumes of blood that can be mobilized as needed
- Venous pump - propel blood toward the heart via skeletal muscle contractions + venous valves
- Regulation of cardiac output - by controlling venous return to the heart
- Regulation of arterial pressure - sympathetic venoconstriction shifts blood into the arterial side
SECTION 8: VENOUS PRESSURES
Central Venous Pressure (CVP) = Right Atrial Pressure
- All systemic veins drain into the right atrium
- Right atrial pressure = central venous pressure (CVP)
- Regulated by balance between:
- Heart's pumping ability (stronger pumping → lower RA pressure)
- Venous return from peripheral veins (more return → higher RA pressure)
- Range: -2 to +6 mm Hg
- Increased blood volume
- Increased venous tone (sympathetic venoconstriction) → peripheral veins constrict → blood shifted centrally
- Arteriolar dilation → decreased peripheral resistance → blood flows more rapidly from arteries to veins to RA
- Heart failure (impaired RV pumping)
- Tricuspid regurgitation
- Cardiac tamponade
- Hemorrhage/hypovolemia
- Increased heart pumping (sympathetic stimulation)
- Upright posture (blood pools in dependent veins)
Peripheral Venous Pressures
| Location | Approximate Pressure |
|---|---|
| Venules (just after capillaries) | ~15-20 mm Hg |
| Small veins | ~10 mm Hg |
| Large veins (proximal to thorax) | ~5-8 mm Hg |
| Superior/inferior vena cava | ~4-7 mm Hg |
| Right atrium | ~0 mm Hg |
- When standing upright, venous pressure in the foot rises to approximately +90 mm Hg due to the hydrostatic column of blood from the foot to the heart (~1.3 m tall)
- This increased pressure at the foot promotes capillary filtration → edema tendency in lower limbs during prolonged standing
SECTION 9: THE VENOUS PUMP (MUSCLE PUMP)
Mechanism
- Peripheral veins have one-way valves (venous valves) that only allow flow toward the heart
- When skeletal muscles contract → compress the veins in the muscle → pressure rises → blood squeezed toward heart (valves in the other direction closed)
- When muscles relax → veins refill from capillaries; valves prevent backflow
- Net effect: continuous forward propulsion of venous blood with muscular activity
Importance of the Venous Pump
- During exercise: Skeletal muscle pump can increase venous return dramatically → supports large increases in cardiac output
- During standing: Without the pump, blood pools in the lower extremities. The pump counteracts hydrostatic pressure and reduces venous/capillary pressure in the feet during walking
- Absence of pump (prolonged standing/immobility):
- Venous pressure in feet rises markedly (~90 mm Hg)
- Capillary filtration exceeds lymphatic drainage → edema of ankles and feet
Varicose Veins
- Caused by failure or incompetence of venous valves
- Veins become chronically distended, tortuous, and visible under the skin
- Common in lower extremities (great saphenous vein system)
- Risk factors: prolonged standing, pregnancy (increased abdominal pressure compresses pelvic veins), obesity, hereditary valve weakness
- Consequence: blood pools → increased venous/capillary pressure → edema, skin changes, venous stasis ulcers
SECTION 10: THE VEINS AS A BLOOD RESERVOIR
Blood Distribution in the Systemic Veins
| Reservoir | Approximate Blood Volume Stored | Special Features |
|---|---|---|
| Systemic veins/venules | ~2,000-3,500 mL | Major reservoir; large compliance |
| Spleen | ~200-400 mL | Can release blood during sympathetic stimulation; blood stored at high Hct |
| Liver sinusoids | ~300-500 mL | Large, highly compliant; contracts with sympathetic stimulation |
| Large abdominal veins | ~300 mL | |
| Subcutaneous venous plexuses | ~200-300 mL | Important in temperature regulation |
| Heart (atria, ventricles) | ~150-250 mL | Can dilate to hold more during high venous return |
Spleen as a Special Reservoir
- Stores blood in a highly concentrated form (higher hematocrit than systemic blood)
- During sympathetic stimulation or exercise: splenic capsule contracts → expels high-Hct blood into systemic circulation → increases oxygen-carrying capacity
- More important in animals (dogs can release ~400 mL); in humans the effect is smaller (~100-200 mL)
Clinical Applications of Venous Reservoir Function
- Because venous compliance is so high, transfusing 500 mL into a healthy person changes CVP by only ~3-5 mm Hg → person barely notices
- The veins simply expand to accommodate the extra volume
- Sympathetic activation → venoconstriction → blood mobilized from venous reservoirs → venous return maintained → cardiac output maintained despite blood loss
- First compensatory mechanism for blood loss
SECTION 11: EFFECT OF GRAVITY AND POSTURE ON VENOUS PRESSURE
Hydrostatic Pressure Effects
- Below the heart: Hydrostatic pressure adds to venous pressure
- Every 13.6 mm blood column height = 1 mm Hg extra pressure
- At the foot (~105 cm below heart) → ~+90 mm Hg extra venous pressure
- Above the heart: Hydrostatic pressure subtracts from venous pressure
- At the top of the head (~30 cm above heart) → venous pressure may be near zero or even slightly negative
- Jugular veins collapse above the heart level (no venous valves in neck to prevent backflow; maintained open by negative intrathoracic pressure)
Practical Consequences
- Edema formation in ankles during prolonged standing → high local venous and capillary pressure
- Fainting on prolonged standing: blood pools in dependent veins → reduced venous return → reduced CO → reduced cerebral perfusion → syncope
- Postural hypotension: On suddenly standing up, blood pools in lower limbs → transient fall in CO and BP → dizziness (compensated within seconds by baroreceptor reflex)
SECTION 12: MEASUREMENT OF VENOUS PRESSURE
Direct Measurement (CVP)
- Central venous catheter placed in the jugular vein or subclavian vein with tip at the junction of SVC and RA
- Normal CVP = 2-8 mm Hg (0-6 cm H₂O above the tricuspid valve level)
- Elevated CVP: right heart failure, fluid overload, cardiac tamponade, tension pneumothorax
- Low CVP: hypovolemia, vasodilation
Clinical Estimation (Jugular Venous Pressure - JVP)
- Patient positioned at 45° incline
- Observe the jugular vein for the level of pulsation above the sternal angle (angle of Louis)
- Normal: JVP level ≤ 4 cm above the sternal angle (≈ CVP ≤ 9 cm H₂O)
- Elevated JVP = elevated CVP = right heart failure, fluid overload
KEY NUMBERS TO REMEMBER - CHAPTER 15
| Parameter | Value |
|---|---|
| Veins distensibility vs. arteries | 8× more distensible |
| Venous compliance vs. arterial | 24× more compliant |
| Arterial system volume at 100 mm Hg MAP | ~700 mL |
| Venous system volume (normal) | 2,000-3,500 mL |
| Change in venous pressure per few hundred mL | only 3-5 mm Hg |
| Normal systolic/diastolic BP | 120/80 mm Hg |
| Normal pulse pressure | ~40 mm Hg |
| Normal MAP | ~93 mm Hg |
| MAP formula (practical) | Diastolic + 1/3 × pulse pressure |
| Pulse pressure formula | Stroke volume / arterial compliance |
| Pulmonary arteries distensibility | ~6× systemic arteries |
| Venous pressure at foot (standing) | ~90 mm Hg |
| Normal CVP (right atrial pressure) | ~0 mm Hg (-2 to +6 mm Hg) |
| JVP normal (above sternal angle at 45°) | ≤ 4 cm |
| Auscultatory BP accuracy vs. direct | Within ~10% |
| Sympathetic stimulation on CVP | Increases (venoconstriction) |
| Blood stored in systemic veins | ~64% of total blood volume |
| Transfused blood volume tolerated | Up to ~500 mL without major effect |
Continue with Chapter 16 notes (Microcirculation & Lymphatics)
GUYTON & HALL - TEXTBOOK OF MEDICAL PHYSIOLOGY
CHAPTER 16: The Microcirculation and Lymphatic System: Capillary Fluid Exchange, Interstitial Fluid, and Lymph Flow
OVERVIEW
- Structure of the capillary system and capillary wall
- How substances exchange across capillary walls
- The Starling forces governing fluid filtration and reabsorption
- The interstitial fluid compartment
- The lymphatic system and its role in fluid balance
- The causes and safety factors against edema
- The body has approximately 10 billion capillaries
- Total capillary surface area: 500-700 m² (~1/8th of a football field)
- No functional cell is more than 20-30 μm from a capillary
SECTION 1: STRUCTURE OF THE MICROCIRCULATION
The Microvascular Hierarchy
- Nutrient artery branches 6-8 times → become arterioles
- Arterioles (internal diameter 10-15 μm): highly muscular; major resistance vessels
- Arterioles branch 2-5 more times → reach 5-9 μm diameter at terminal arterioles
- Metarterioles (terminal arterioles): no continuous muscular coat; smooth muscle fibers encircle at intermittent points
- True capillaries arise from metarterioles; at each origin a precapillary sphincter encircles the entry
- Capillaries → venules → larger veins
Key Structures at the Microvascular Level
Arterioles
- Highly muscular - can change diameter markedly
- Act as the principal resistance vessels of the circulation
- Controlled by local tissue conditions (metabolic needs), autonomic nerves, and hormones
Metarterioles (Terminal Arterioles)
- No continuous muscular coat
- Smooth muscle fibers at intermittent points only
- In close contact with the tissues they serve
- Respond directly to local tissue conditions (nutrient concentrations, metabolic end products, H⁺ ions)
Precapillary Sphincters
- Single smooth muscle fiber encircling the entrance of each true capillary
- Can open and close the entrance to individual capillaries
- Control how many capillaries are open/perfused at any time
- Regulated by local tissue conditions → intermittent opening and closing = vasomotion
Vasomotion
- Intermittent contraction and relaxation of metarterioles and precapillary sphincters
- Frequency: 6-12 times/min (varies with metabolic needs)
- When O₂ delivery is adequate: sphincters close → capillary not perfused
- When O₂ deficient: sphincters open → capillary opens → O₂ delivered
- At rest: only 20-35% of all capillaries are open at any time
- During maximal exercise in skeletal muscle: virtually 100% open simultaneously
Pericytes
- Found in many capillaries, especially brain and kidneys
- Wrap around endothelial cells at intervals along the capillary wall
- Not smooth muscle cells, but contain contractile proteins
- Secrete factors regulating capillary growth and tissue perfusion
- In the brain: high-density pericytes contribute to the blood-brain barrier (restricts entry of pathogens and large molecules into CNS)
Venules
- Larger than arterioles
- Much weaker muscular coat than arterioles
- Pressure is much lower than arterioles
- Still capable of some constriction (important in edema formation)
SECTION 2: STRUCTURE OF THE CAPILLARY WALL
Basic Architecture
- Wall = single layer of endothelial cells (unicellular)
- Surrounded on the outside by a thin basement membrane
- Total wall thickness: ~0.5 μm (extremely thin)
- Internal diameter: 4-9 μm (barely large enough for RBCs to squeeze through single-file)
Capillary Pores - Routes of Exchange
- Thin, slitted, curving channels between adjacent endothelial cells
- Width: 6-7 nm (6-7 billionths of a meter)
- These narrow clefts act as the main route for water and small molecule exchange
- Represent only about 1/1000th of the total capillary surface area, yet allow for rapid exchange because they are concentrated along a thin path
- Large numbers of vesicles formed from the cell membrane by endocytosis
- Diameter: 25-70 nm each
- Can coalesce to form transient transcapillary channels from the luminal to the abluminal surface
- Called vesiculo-vacuolar organelles when they fuse into larger channels
- Important route for large molecule transport (including some proteins)
- Rapid vesicular transport: molecules captured on one side, transported across cytoplasm, released on other side
Organ-Specific Capillary Types
| Type | Location | Permeability | Structural Features |
|---|---|---|---|
| Continuous (tight) | Muscle, skin, lung, brain, CNS | Low permeability | Tight junctions, minimal pores; blood-brain barrier is the extreme form |
| Fenestrated | Kidney glomerulus, intestinal villi, endocrine glands, choroid plexus | Intermediate-high | Fenestrae (pores, 40-80 nm) with thin diaphragms; allows rapid filtration |
| Discontinuous (sinusoidal) | Liver, spleen, bone marrow | Very high | Large gaps (0.1-1 μm), incomplete basement membrane; allows entire cells and proteins to pass |
SECTION 3: EXCHANGE OF SUBSTANCES ACROSS THE CAPILLARY WALL
Three Mechanisms of Transcapillary Exchange
- By far the most important mechanism for exchange of nutrients and waste products
- Molecules move from areas of high concentration to low concentration
- Water-soluble substances (glucose, amino acids, ions) diffuse through the intercellular clefts and water-filled channels
- Lipid-soluble substances (O₂, CO₂, fatty acids, steroid hormones, ethanol) diffuse directly through the lipid bilayer of the endothelial cells → much more rapidly than water-soluble substances
- O₂ and CO₂ can diffuse through all parts of the capillary wall because they are highly lipid-soluble
- The total quantity of substance that diffuses = Fick's Law: J = P × A × ΔC
- J = diffusion rate
- P = permeability coefficient of the capillary wall for the substance
- A = surface area available
- ΔC = concentration difference across the membrane
- Driven by hydrostatic and osmotic pressure differences across the capillary wall (Starling forces - see Section 4)
- Moves water along with its dissolved small molecules
- Quantitatively small relative to diffusion, but critically important for fluid balance
- Plasmalemmal vesicles engulf fluid/solutes from one side → transport across cytoplasm → release other side
- Important for large molecules (albumin, immunoglobulins, insulin) that cannot fit through pores
- Responsible for the small but significant protein leakage from capillaries into the interstitium
SECTION 4: STARLING FORCES - FILTRATION AND REABSORPTION AT THE CAPILLARY
The Four Starling Forces
| Force | Symbol | Normal Value | Effect |
|---|---|---|---|
| Capillary hydrostatic pressure | Pc | 30 mm Hg (arterial end), 10 mm Hg (venous end), ~17-25 mm Hg (middle) | Pushes fluid OUT of capillary (filtration) |
| Interstitial fluid hydrostatic pressure | Pif | -3 mm Hg (loose subcutaneous tissue) | Slightly negative → pulls fluid OUT of capillary (filtration) |
| Plasma colloid osmotic pressure (oncotic pressure) | πp | 28 mm Hg | Pulls fluid INTO capillary (reabsorption) |
| Interstitial fluid colloid osmotic pressure | πif | 8 mm Hg | Pulls fluid OUT of capillary (filtration) |
The Starling Equation
Net filtration pressure = (Pc + πif) - (Pif + πp) Net filtration pressure = Filtration forces - Reabsorption forces
NFP = (Pc - Pif) - (πp - πif)
- Positive NFP = net filtration (fluid leaves capillary)
- Negative NFP = net reabsorption (fluid enters capillary)
Calculating NFP at Each End of the Capillary
| Force | Direction | Value |
|---|---|---|
| Capillary hydrostatic pressure (Pc) | Out | +30 mm Hg |
| Interstitial hydrostatic pressure (Pif) | (opposing filtration) | -(-3) = +3 mm Hg |
| Plasma oncotic pressure (πp) | In | -28 mm Hg |
| Interstitial oncotic pressure (πif) | Out | +8 mm Hg |
| NET filtration pressure | OUT | +13 mm Hg → FILTRATION |
| Force | Direction | Value |
|---|---|---|
| Capillary hydrostatic pressure (Pc) | Out | +10 mm Hg |
| Interstitial hydrostatic pressure (Pif) | +3 mm Hg | |
| Plasma oncotic pressure (πp) | In | -28 mm Hg |
| Interstitial oncotic pressure (πif) | Out | +8 mm Hg |
| NET filtration pressure | IN | -7 mm Hg → REABSORPTION |
- At the arterial end: fluid filters OUT of capillary into interstitium
- At the venous end: fluid is reabsorbed FROM interstitium BACK into capillary
- Net across the whole capillary: slightly more is filtered out than reabsorbed (net filtration ~2 mm Hg equivalent)
- The excess filtered fluid (~2 L/day) is returned to the circulation via lymphatics
Filtration Coefficient (Kf)
Net fluid filtration rate = Kf × Net filtration pressure
- Kf = hydraulic conductivity × surface area
- Units: mL/min per mm Hg per 100 g tissue
- Varies enormously between organs:
- Renal glomerulus: very high Kf (designed for massive filtration)
- Blood-brain barrier: very low Kf (designed to minimize fluid leakage)
SECTION 5: CAPILLARY HYDROSTATIC PRESSURE IN DETAIL
Values in Different Organs/Conditions
| Location | Capillary Pressure |
|---|---|
| Arterial end (typical) | 30-40 mm Hg |
| Middle of capillary (functional mean) | ~17-25 mm Hg |
| Venous end (typical) | 10-15 mm Hg |
| Renal glomerular capillaries | ~60 mm Hg (highest in body) |
| Renal peritubular capillaries | ~13 mm Hg (lowest) |
Why Glomerular Pressure is So High
- Afferent arteriole pressure = high (systemic arterial)
- Efferent arteriole provides resistance after the capillary bed
- High pressure maintained throughout glomerular capillary → drives massive filtration (~180 L/day GFR)
SECTION 6: PLASMA COLLOID OSMOTIC PRESSURE (ONCOTIC PRESSURE)
Definition
- The osmotic pressure exerted by large proteins in the plasma that are too large to cross the capillary membrane freely
- Principal proteins: albumin (~80% of total), globulins, fibrinogen
Normal Values
| Location | Colloid Osmotic Pressure |
|---|---|
| Plasma | 28 mm Hg total |
| - Due to albumin alone | ~22 mm Hg |
| - Due to globulins | ~6 mm Hg |
| Interstitial fluid | ~8 mm Hg (from leaked proteins) |
Gibbs-Donnan Effect
- Plasma proteins carry negative charges at physiological pH
- These negative charges attract cations (Na⁺, K⁺) → hold extra positive ions in plasma
- This adds an extra ~4 mm Hg to the effective oncotic pressure
- Total effective oncotic pressure: ~28 mm Hg (includes this electrostatic effect)
Clinical Significance of Reduced Oncotic Pressure
- Reduced oncotic pressure → less reabsorption at venous end
- More fluid stays in interstitium → edema
- Causes: malnutrition (kwashiorkor, marasmus), liver failure (reduced albumin synthesis), nephrotic syndrome (massive albumin loss in urine), protein-losing enteropathy
SECTION 7: INTERSTITIAL FLUID - COMPOSITION AND PRESSURE
Interstitial Space Structure
- NOT simply a watery solution between cells
- Consists of two components:
- Collagen fiber bundles - provide structural support; resist compression
- Proteoglycan filament gel - highly hydrophilic meshwork filling spaces between collagen; traps water
Interstitial Fluid Hydrostatic Pressure (Pif)
- Average: -3 mm Hg (slightly below atmospheric)
- Range by method: -2 to -6 mm Hg
- Lymphatics continuously pump fluid OUT of the interstitium → create a slight suction
- The negative pressure keeps the interstitium "dry" and prevents accumulation of free fluid
- Brain (enclosed by rigid skull): interstitial pressure positive (~10 mm Hg)
- Kidney (enclosed by fibrous capsule): positive (~13 mm Hg)
- Skeletal muscle (fibrous sheaths): slightly positive
- Eye (sclera): slightly positive
Interstitial Fluid Protein Concentration
- Most tissues: ~2 g/dL (much less than plasma's ~7.3 g/dL)
- Liver interstitium: ~6 g/dL (highly fenestrated sinusoidal capillaries)
- Intestinal interstitium: ~3-4 g/dL
- These proteins generate the interstitial colloid osmotic pressure of ~8 mm Hg
The Interstitium Has Free Fluid and Gel-Trapped Fluid
- Most interstitial fluid is trapped in the proteoglycan gel matrix and is not freely mobile
- Only when the interstitium becomes overfilled does free fluid appear → this free fluid then causes pitting edema
- The gel-trapped water resists the formation of large pools of free fluid (provides a safety buffer)
SECTION 8: EDEMA - CAUSES, TYPES, AND SAFETY FACTORS
Definition
Causes of Edema
- Venous obstruction (thrombosis, tumor)
- Heart failure (right-sided → peripheral edema; left-sided → pulmonary edema)
- Excessive blood volume (renal retention of Na⁺ and water)
- Dependent edema from gravity (prolonged standing)
- Severe malnutrition → low albumin → low oncotic pressure → edema
- Liver failure → reduced albumin synthesis → edema (especially ascites)
- Nephrotic syndrome → massive albuminuria → low plasma albumin → generalized edema
- Protein-losing enteropathy
- Allergic reactions (histamine → markedly increases permeability → angioedema, urticaria)
- Burns → destroy capillary walls → massive protein leakage → enormous edema
- Bacterial toxins (gram-negative endotoxins)
- Inflammatory mediators (bradykinin, prostaglandins, leukotrienes, IL-1, TNF-α)
- ARDS (acute respiratory distress syndrome) → pulmonary edema from capillary leak
- Obstruction prevents return of leaked proteins from interstitium
- Proteins accumulate → increase interstitial oncotic pressure → more fluid pulled out → edema
- Also: lymph cannot drain → fluid accumulates
- Causes: filariasis (Wuchereria bancrofti → elephantiasis), cancer invading lymph nodes, surgical removal of lymph nodes (e.g., mastectomy → arm edema), radiation therapy
Three Safety Factors Against Edema
- Normal interstitial fluid pressure: -3 mm Hg
- The proteoglycan gel matrix resists expansion at low pressures
- As filtration pressure increases, interstitial fluid pressure rises only a little (from -3 toward 0 mm Hg)
- Safety factor: +3 mm Hg (the rise from -3 to 0 mm Hg opposes further filtration)
- As interstitial pressure rises → lymphatic drainage dramatically increases (up to 20-fold when Pif rises from -6 to 0 mm Hg)
- Lymphatics can remove the extra filtered fluid before it accumulates
- Safety factor: ~7 mm Hg (lymph flow can compensate for increased filtration equivalent to ~7 mm Hg rise in filtration pressure)
- As more fluid filters into the interstitium → interstitial proteins are diluted (washed out)
- Interstitial protein concentration falls → interstitial oncotic pressure (πif) falls
- Falling πif → less force pulling fluid OUT → reduced net filtration
- Safety factor: ~7 mm Hg (can accommodate an equivalent 7 mm Hg increase in filtration pressure)
- Capillary pressure can rise from its normal ~17 mm Hg to ~34-35 mm Hg before edema appears
- Or: plasma oncotic pressure can fall to ~11 mm Hg before edema appears
Edema Formation Sequence After Safety Factors Are Overwhelmed
- Capillary filtration exceeds reabsorption + lymphatic drainage
- Interstitial fluid volume increases
- Interstitial pressure rises to 0 mm Hg and above (becomes positive)
- Free fluid appears in the interstitium (no longer gel-trapped)
- Pitting edema becomes clinically detectable
Pulmonary Edema - Special Considerations
- Pulmonary capillary pressure normally ~7 mm Hg (very low, below oncotic pressure)
- Pulmonary interstitial fluid pressure: -8 mm Hg (very negative due to expansile forces of lung tissue)
- When left heart fails → pulmonary capillary pressure rises
- If pulmonary capillary pressure rises above ~30 mm Hg → outstrips pulmonary oncotic pressure → acute pulmonary edema
- Fluid fills alveoli → impairs gas exchange → can be fatal
SECTION 9: THE LYMPHATIC SYSTEM
Overview of Lymphatic Function
- Returns excess interstitial fluid (and proteins) to the circulation
- Removes proteins that continuously leak from blood capillaries (critical - proteins cannot return via blood capillary reabsorption)
- Transports absorbed fats from the intestinal lacteals to the circulation
Structure of Lymphatic Capillaries
- Terminal lymphatic capillaries: blind-ended, highly permeable tubes in the interstitium
- Endothelial cells attached to surrounding connective tissue by anchoring filaments
- Adjacent endothelial cells overlap at their edges → form flap valves
- When tissue swells: anchoring filaments pull open flap valves → interstitial fluid (with proteins and particles) enters lymphatic
- When tissue is compressed: valves close → fluid propelled forward (not backward)
- One-way valves at every level of the lymphatic system prevent backflow
Formation and Composition of Lymph
- Lymph = interstitial fluid that has entered the lymphatic capillaries
- Composition closely mirrors interstitial fluid
- Protein concentration in lymph from different tissues:
- Most tissues: ~2 g/dL
- Liver lymph: up to 6 g/dL (liver capillaries are very leaky to proteins)
- Intestinal lymph: 3-4 g/dL
- Thoracic duct (mixed lymph): 3-5 g/dL (2/3 of all lymph comes from liver and intestines)
- Fats: After a fatty meal, lymph in the thoracic duct contains 1-2% fat (chylomicrons absorbed from intestinal lacteals via chyle)
- Bacteria: Large particles including bacteria can push through lymphatic endothelial junctions → enter lymph → filtered out and destroyed in lymph nodes
Lymph Flow Rate
- Total lymph flow: ~100 mL/hr through the thoracic duct + ~20 mL/hr through other channels
- Total: ~120 mL/hr = ~3 L/day returned to circulation via lymphatics
- This equals the approximate excess filtration from blood capillaries
Factors Increasing Lymph Flow
- Increased capillary hydrostatic pressure → more filtration → more interstitial fluid → higher Pif → more lymph flow
- Decreased plasma oncotic pressure
- Increased capillary permeability
- Increased interstitial oncotic pressure
- At normal Pif (-6 mm Hg): lymph flow is very low (nearly zero)
- As Pif rises from -6 to 0 mm Hg: lymph flow increases more than 20-fold
- Maximum lymph flow is reached when Pif reaches ~0 mm Hg
The Lymphatic Pump - How Lymph Moves
- Walls of larger lymphatic vessels (>1 mm diameter) contain smooth muscle
- Smooth muscle contracts rhythmically (~6-10 times/min) when distended by lymph
- Each lymphangion (segment between valves) contracts sequentially → propels lymph forward
- Analogous to the peristalsis in the intestine
- Skeletal muscle contractions (most important)
- Arterial pulsations (adjacent arteries compress lymphatics)
- Body movements
- Respiratory movements (changes in intrathoracic pressure)
- Tissue compression by external objects
Lymphatic Capillary Pump
- Anchoring filaments pull capillary walls open when tissue swells → fluid enters
- When tissue compressed → overlapping endothelial flap valves close → fluid propelled forward
- Endothelial cells themselves contain some actomyosin filaments → can rhythmically contract
Determinants of Lymph Flow Rate
- High Pif with blocked/absent lymphatics → edema (lymphedema)
- Active pump with low Pif → minimal flow (little fluid to move)
SECTION 10: LYMPHATIC SYSTEM CONTROL OF INTERSTITIAL FLUID HOMEOSTASIS
1. Interstitial Fluid Protein Concentration
- Blood capillaries continuously leak small amounts of protein
- These proteins cannot return via the venous end of capillaries (too large)
- Without lymphatics: proteins would accumulate → increasing πif → pulling more fluid out → progressive edema
- Lymphatics drain these proteins → return to blood → maintain low interstitial protein concentration
2. Interstitial Fluid Volume
- Lymphatics act as the overflow mechanism when filtration exceeds reabsorption
- Continuous drainage prevents accumulation of excess fluid
3. Interstitial Fluid Pressure
- By removing fluid, lymphatics maintain the slightly negative Pif (-3 mm Hg)
- This negative pressure keeps the interstitium "collapsed" around cells → prevents free fluid lakes from forming
The Homeostatic Equilibrium (Self-Regulating System)
- Proteins leak from capillaries → accumulate in interstitium → πif rises
- Rising πif → more fluid filtered out → interstitial volume ↑ → Pif rises
- Rising Pif → lymph flow dramatically increases
- Increased lymph flow → carries proteins AND fluid back to blood
- πif and Pif return toward normal
KEY NUMBERS TO REMEMBER - CHAPTER 16
| Parameter | Value |
|---|---|
| Number of body capillaries | ~10 billion |
| Total capillary surface area | 500-700 m² |
| Max distance of any cell from capillary | 20-30 μm |
| Arteriole diameter | 10-15 μm |
| Capillary internal diameter | 4-9 μm |
| Capillary wall thickness | ~0.5 μm |
| Intercellular cleft width | 6-7 nm |
| Normal capillary hydrostatic pressure (mean) | ~17-25 mm Hg |
| Capillary pressure (arterial end) | 30-40 mm Hg |
| Capillary pressure (venous end) | 10-15 mm Hg |
| Glomerular capillary pressure | ~60 mm Hg |
| Normal Pif (loose subcutaneous tissue) | -3 mm Hg |
| Plasma oncotic pressure (πp) | 28 mm Hg |
| Interstitial oncotic pressure (πif) | 8 mm Hg |
| Net filtration at arterial end | +13 mm Hg (out) |
| Net filtration at venous end | -7 mm Hg (in) |
| Normal total lymph flow | ~3 L/day (120 mL/hr) |
| Lymph flow increase when Pif reaches 0 | >20-fold |
| Exercise increase in lymph flow | 10-30 fold |
| Interstitial protein concentration (most tissues) | ~2 g/dL |
| Liver lymph protein concentration | up to 6 g/dL |
| Thoracic duct lymph protein | 3-5 g/dL |
| Total safety factor against edema | ~17 mm Hg |
| Edema safety factor 1 (Pif rise) | +3 mm Hg |
| Edema safety factor 2 (lymph flow) | ~7 mm Hg |
| Edema safety factor 3 (protein washout) | ~7 mm Hg |
| Pulmonary capillary pressure (normal) | ~7 mm Hg |
| Pulmonary edema threshold | ~30 mm Hg capillary pressure |
| Precapillary sphincter open at rest | 20-35% of capillaries |
| During maximal exercise | ~100% of capillaries open |
leave that , we wil continue that later , imagine they only a single mean electrical axis , for eg towards the left upper quadrant axis , now they said to fine win which directn will be the lead positive or negative , how to calculate that , ik that by planning that perpendicular lines we do it but i get confuse in that , explain in short and simple wayy
The One Rule You Need
A lead records POSITIVE if the mean electrical axis points TOWARD its positive electrode. Negative if it points AWAY.
Step 1 - Know Where Each Lead's Positive Electrode Points
        aVL (-30°)
           |
Lead I (0°) ←————————
           |
        aVF (+90°)

Lead II = +60°
Lead III = +120°
aVR = -150°
- Lead I = pointing LEFT (0°)
- Lead II = pointing LEFT-DOWN (60°)
- Lead III = pointing RIGHT-DOWN (120°)
- aVF = pointing straight DOWN (90°)
- aVL = pointing LEFT-UP (-30°)
- aVR = pointing RIGHT-UP (-150°) → always opposite to most leads
Step 2 - The Angle Test (No Drawing Needed)
"Is the axis pointing MORE toward or MORE away from this lead's positive pole?"
- Less than 90° → axis is in the same "half" as the positive pole → POSITIVE deflection
- More than 90° → axis is in the opposite "half" → NEGATIVE deflection
- Exactly 90° → axis is perpendicular to the lead → isoelectric (flat/biphasic)
Your Example: Axis in the Left Upper Quadrant (~-60°)
| Lead | Positive pole direction | Angle between -60° and the lead | <90° or >90°? | Result |
|---|---|---|---|---|
| Lead I | 0° | |-60° - 0°| = 60° | <90° | POSITIVE ✓ |
| Lead II | +60° | |-60° - 60°| = 120° | >90° | NEGATIVE ✗ |
| Lead III | +120° | |-60° - 120°| = 180° | >90° | NEGATIVE ✗ |
| aVF | +90° | |-60° - 90°| = 150° | >90° | NEGATIVE ✗ |
| aVL | -30° | |-60° - (-30°)| = 30° | <90° | POSITIVE ✓ |
| aVR | -150° | |-60° - (-150°)| = 90° | =90° | Isoelectric ~ |
The Even Simpler Visual Trick
- Imagine the lead as a LINE through the center (positive end and negative end)
- Ask: which side of the line does the arrow point toward?
- Arrow points toward positive side = positive QRS
- Arrow points toward negative side = negative QRS
- Arrow lies exactly on the line = isoelectric
Quick Memory Aid for Common Axes
| Axis | Lead I | Lead II | aVF | Pattern |
|---|---|---|---|---|
| Normal (+60°) | + | + (biggest) | + | All positive in I, II, aVF |
| Left axis (-60°) | + | - | - | Positive I, negative II and aVF |
| Right axis (+120°) | - | + | + | Negative I, positive II and aVF |
- If Lead I and aVF are both positive → Normal axis ✓
- If Lead I positive, aVF negative → Left axis deviation
- If Lead I negative, aVF positive → Right axis deviation
- If both negative → Extreme axis deviation (northwest)
Explain how to plot perpendicular lines if I still need the mathematical method
What You Are Actually Doing
The Setup - Draw This Once and Memorize It
        RA ————————————— LA
         \               /
          \             /
           \           /
            \         /
             \       /
              \     /
               \   /
                \ /
                 LL
                    -90°
                     |
         aVL        |
        (-30°)  \   |   /
                 \  |  /
    Lead I ———————CENTER——————— Lead I
    (0°, left)   /  |  \      (180°, right)
                /   |   \
               /    |    \
          Lead II  aVF   Lead III
          (+60°)  (+90°) (+120°)
                     |
                   +90°
The Step-by-Step Method
Step 1: Measure net QRS voltage in Lead I
- Add up all upward deflections (positive)
- Subtract all downward deflections (negative)
- Result = net voltage of Lead I (can be + or -)
Step 2: Measure net QRS voltage in Lead III
Step 3: Plot Lead I on its axis
- Draw the Lead I axis = horizontal line through center
- Positive end is to the LEFT (0°), negative end is to the RIGHT (180°)
- Mark a point +6 mm to the LEFT of center along this line
- Label this point A
    ← positive          negative →
    |___A___|___center___|_________|
         +6mm
Step 4: Plot Lead III on its axis
- Draw the Lead III axis = line at +120° through center (going lower-right)
- Mark a point +3 mm along the positive direction (+120° direction) from center
- Label this point B
Step 5: Draw perpendicular lines from A and B
-
From point A (on the Lead I axis): draw a line perpendicular to the Lead I axis
- Lead I is horizontal → its perpendicular is vertical
- So draw a vertical line upward AND downward through point A
-
From point B (on the Lead III axis): draw a line perpendicular to the Lead III axis
- Lead III is at 120° → its perpendicular is at 120° - 90° = 30°
- So draw a line at 30° through point B
Step 6: Mark where the two perpendicular lines intersect
Step 7: Draw the mean axis vector
- Draw an arrow from the CENTER of the diagram to point C
- This arrow IS the mean electrical axis
- Measure the angle of this arrow from the horizontal → that angle is your mean QRS axis in degrees
Visual Walkthrough With Numbers
STEP 1-2: Net voltages
Lead I  = +6 mm
Lead III = +3 mm

STEP 3: Plot on Lead I axis (horizontal)
         Mark +6 mm to the LEFT of center → point A

STEP 4: Plot on Lead III axis (lower-right diagonal, 120°)
         Mark +3 mm along the 120° direction → point B

STEP 5: Draw perpendiculars
         From A: draw a VERTICAL line (perpendicular to horizontal Lead I)
         From B: draw a line at 30° (perpendicular to the 120° Lead III axis)

STEP 6: Where these two lines cross = point C

STEP 7: Arrow from center → C = MEAN AXIS
         Measure its angle → ~+59° (normal axis)
Why This Works (The Logic)
The One Thing That Confuses Everyone
You draw the perpendicular FROM the plotted point, and it must be perpendicular TO that lead's axis.
| Lead | Lead Axis Direction | Perpendicular Direction |
|---|---|---|
| Lead I | 0° (horizontal) | 90° (vertical) |
| Lead II | 60° | 150° (or -30°) |
| Lead III | 120° | 30° (or 210°) |
| aVF | 90° (vertical) | 0° (horizontal) |
| aVL | -30° | 60° |
- Perpendicular from Lead I point = vertical line
- Perpendicular from aVF point = horizontal line
- They cross at a right angle immediately → super easy to find the intersection
Quick Summary in 3 Lines
- Measure net QRS in two leads → plot each value along its lead's axis
- From each plotted point, draw a line perpendicular to that lead's axis
- Where the two perpendiculars cross → draw arrow from center to that point = mean electrical axis
give pdf of chapters from 9 to 14 (include 9, 10,11,12,14) add diagrams, and everything
mkdir -p /home/daytona/workspace/guyton-notes && ls /home/daytona/workspace/guyton-notes && python3 -c "import reportlab; print('reportlab OK', reportlab.Version)" && python3 -c "import requests; print('requests OK')" && python3 -c "from PIL import Image; print('PIL OK')"
nwo can i get it ? from chapter 9-15 except 13 , without leaving any point