
Explain in detail about all types of edema with its example with detailed explaination.
types of edema pathophysiology diagram transudate exudate
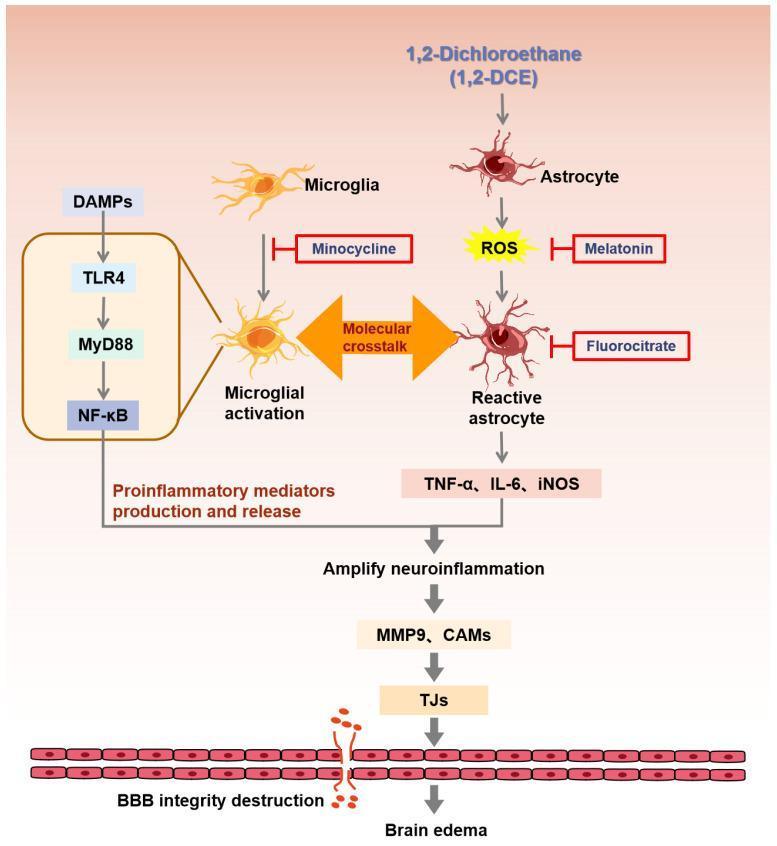
This pathophysiology diagram illustrates the molecular signaling pathways of 1,2-Dichloroethane (1,2-DCE) induced neuroinflammation and brain edema. The schematic depicts 1,2-DCE exposure triggering two parallel cellular responses: microglial activation and astrocyte transformation into reactive astrocytes. Microglia activation is shown occurring via the TLR4/MyD88/NF-κB pathway stimulated by DAMPs, while astrocytes generate reactive oxygen species (ROS). A central feature of the diagram is the 'molecular crosstalk' between these two cell types, which amplifies the neuroinflammatory response. This cascade leads to the overproduction and release of proinflammatory mediators, including TNF-α, IL-6, and iNOS. These cytokines further increase the levels of MMP-9 and cell-adhesion molecules (CAMs), which target and degrade tight junction proteins (TJs) in the blood-brain barrier (BBB). The final stages of the process show BBB integrity destruction leading to cerebral edema. The diagram also identifies potential therapeutic inhibitors: minocycline (blocking microglial activation), and melatonin or fluorocitrate (inhibiting reactive astrocyte pathways).
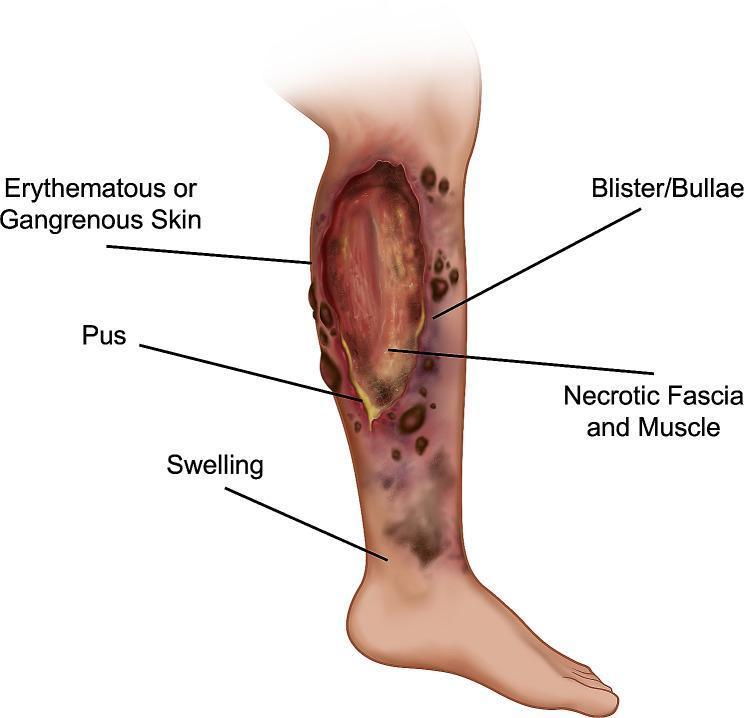
This medical illustration depicts the clinical manifestations of necrotizing fasciitis (NF) on a human lower extremity. The diagram serves as a pathophysiology diagram and clinical guide, labeling key indicators of aggressive soft tissue infection. Centrally, a large ulceration reveals necrotic fascia and muscle, characterized by deep tissue exposure and devitalized appearance. The surrounding cutaneous tissue exhibits significant erythema and gangrenous discoloration, indicating ischemia and advancing tissue death. Associated clinical features include multiple hemorrhagic blisters (bullae), areas of active pus discharge (purulent exudate), and diffuse swelling (edema) extending toward the ankle. This illustration is designed for medical education to assist in the rapid identification of surgical emergencies involving deep-seated infections of the subcutaneous tissue and superficial fascia. Key educational concepts include tissue necrosis, infectious progression, and the distinction between superficial cellulitis and deep-space necrotizing infections.
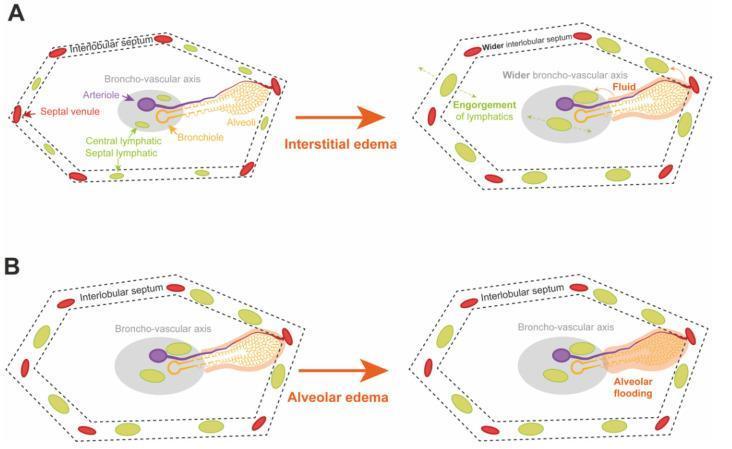
This pathophysiology diagram illustrates the development and progression of pulmonary edema within a secondary pulmonary lobule, a key concept in respiratory medicine and post-lung transplant pathology. The visual is divided into two comparative sequences. Panel A demonstrates the transition to Interstitial Edema, characterized by the widening of the interlobular septum and the broncho-vascular axis. It highlights the engorgement of both central and septal lymphatic vessels as they attempt to clear excess fluid, explaining the reticular pattern seen on CT imaging. Panel B depicts the progression to Alveolar Edema, representing high-grade primary graft dysfunction (PGD). This stage shows 'alveolar flooding,' where fluid accumulates within the alveolar spaces due to saturated lymphatic clearance and increased membrane permeability. Key anatomical structures labeled include the bronchiole, arteriole, septal venule, and lymphatic channels. This educational resource illustrates the structural basis for radiological findings like ground-glass opacities (GGO) and the macroscopic 'glassy' appearance of edematous lung tissue.
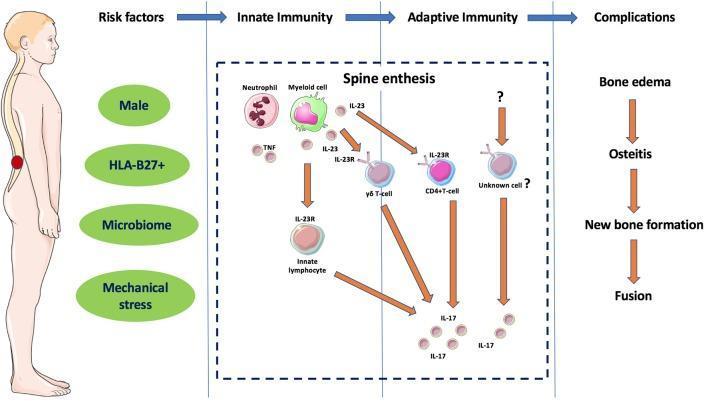
A pathophysiology diagram illustrating the immunopathogenesis of Ankylosing Spondylitis (AS). The diagram is organized into four sequential phases: Risk Factors, Innate Immunity, Adaptive Immunity, and Complications. Key risk factors listed include Male gender, HLA-B27+, Microbiome, and Mechanical stress. The central 'Spine enthesis' section details a cellular cascade where Neutrophils and Myeloid cells release TNF and Interleukin-23 (IL-23). IL-23 binds to IL-23 receptors (IL-23R) on Innate Lymphocytes, gamma-delta (γδ) T-cells, and CD4+ T-cells. These activated cells, along with unidentified cell types, secrete Interleukin-17 (IL-17). This cytokine signaling leads to the final 'Complications' pathway, which progresses from bone edema to osteitis, new bone formation, and ultimately spinal fusion (ankylosis). An anatomical illustration on the left highlights the lumbar spine as the primary site of clinical manifestation. The diagram demonstrates the transition from tissue-specific innate immune activation to secondary adaptive immune responses in genetically predisposed individuals.
pitting edema lower extremity dependent edema
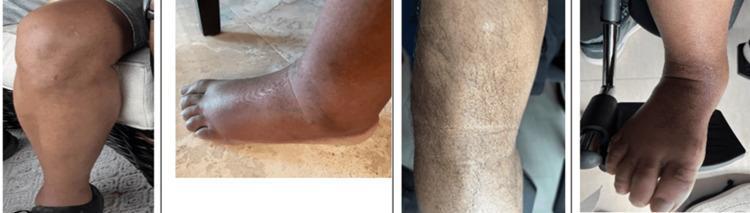
Clinical photograph sequence illustrating the temporal progression of dermatological and vascular symptoms in a patient with POEMS syndrome. The composite consists of four images captured over a ten-month period. The first image (January) shows a baseline lower extremity with normal skin texture and hair distribution. The second image (February) demonstrates significant non-pitting dependent edema involving the foot and ankle, obscuring typical anatomical contours. The final two images (October) showcase late-stage manifestations including diffuse hypertrichosis (abnormal increase in hair growth) and prominent cutaneous hyperpigmentation across the lower leg. The fourth panel reveals a reduction in edema, consistent with clinical management through limb elevation and the use of compression/support hosiery. These visual markers—polyneuropathy, organomegaly, endocrinopathy, monoclonal protein, and skin changes—serve as key diagnostic indicators for multisystem plasma cell dyscrasias.
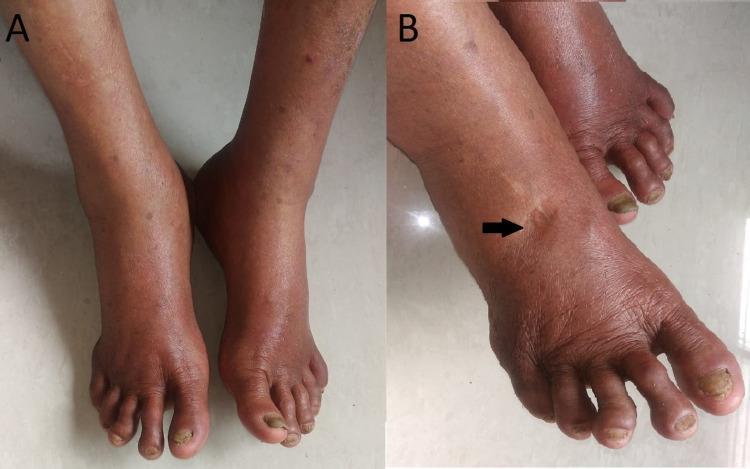
A two-panel clinical photograph illustrating bilateral lower extremity edema. Image A shows a superior view of both feet and ankles, demonstrating significant, symmetrical swelling (pedal edema) that obscures normal bony landmarks. The skin appears taut with subtle reddish-brown hyperpigmentation and scattered macules. Image B provides a lateral-oblique view of the dorsal foot where a black arrow points to a distinct, localized indentation, confirming the 'pitting' phenomenon. The skin in this region is stretched and shiny. Secondary findings include thickening and yellowish discoloration of the toenails, characteristic of onychomycosis. This visual documentation is used in medical education to teach the clinical physical examination of fluid retention and peripheral edema associated with systemic or inflammatory conditions such as post-viral sequelae (e.g., Chikungunya).
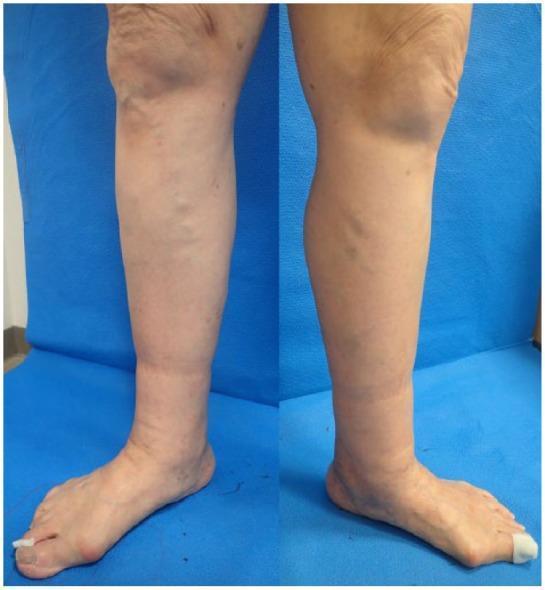
Clinical photograph of the lower extremities of a 79-year-old female presenting with bilateral lower leg edema. The image displays a side-by-side view of the left and right legs from the knee to the foot. Key findings include diffuse non-pitting edema primarily localized below the knees, most prominent in the calf and ankle regions, resulting in an increased limb circumference and a taut, shiny skin appearance. Prominent varicose veins are visible along the medial aspect of both legs, with greater severity noted on the left. The clinical presentation is consistent with CEAP classification grade C3 (venous edema) and secondary lymphedema, indicated by the loss of normal anatomical contours at the ankles. These visual features are characteristic of chronic venous insufficiency and comorbid lymphatic drainage impairment (phlebolymphedema). This material is intended for instruction on vascular assessment, clinical grading of chronic venous disease, and the differential diagnosis of lower extremity swelling.
lymphedema elephantiasis filariasis massive leg edema
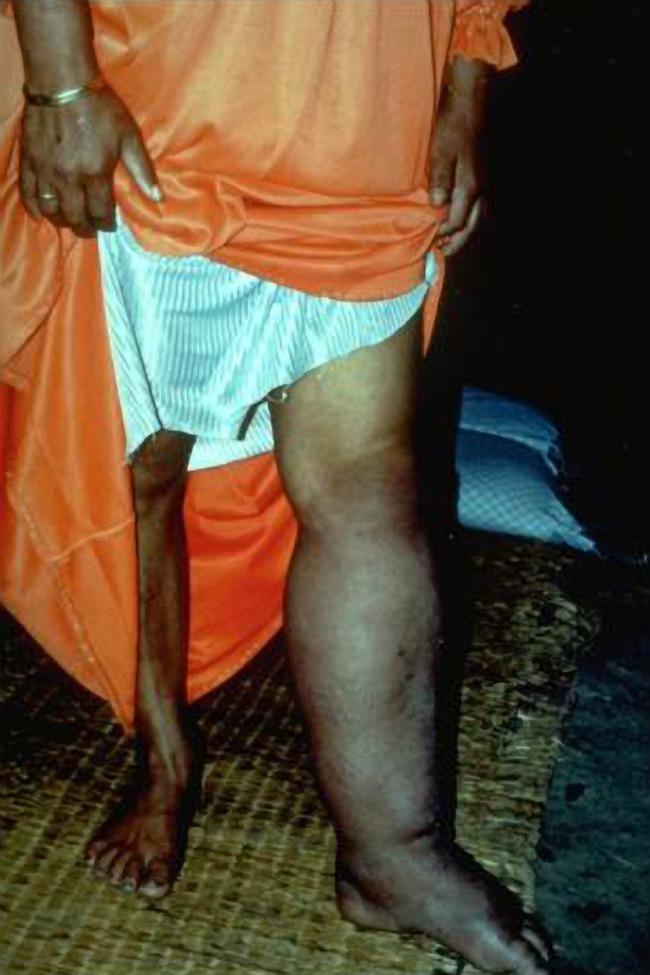
This clinical photograph displays a comparative view of a patient's lower extremities, illustrating severe, unilateral lymphedema, a condition commonly associated with lymphatic filariasis (elephantiasis). The patient's left leg exhibits massive, non-pitting edema extending from the thigh to the foot, resulting in a significantly increased circumference and a loss of normal anatomical contour. The skin on the affected limb is notably darker, showing a dusky, hyperpigmented coloration and a taut, thickened texture compared to the contralateral limb. In stark contrast, the right leg appears normal in size and skin tone, emphasizing the severity of the pathology on the left. This visual serves as an educational example of chronic lymphatic obstruction caused by parasitic filarial nematodes, demonstrating the late-stage physical manifestations and skin changes associated with lymphatic dysfunction and secondary tissue fibrosis.
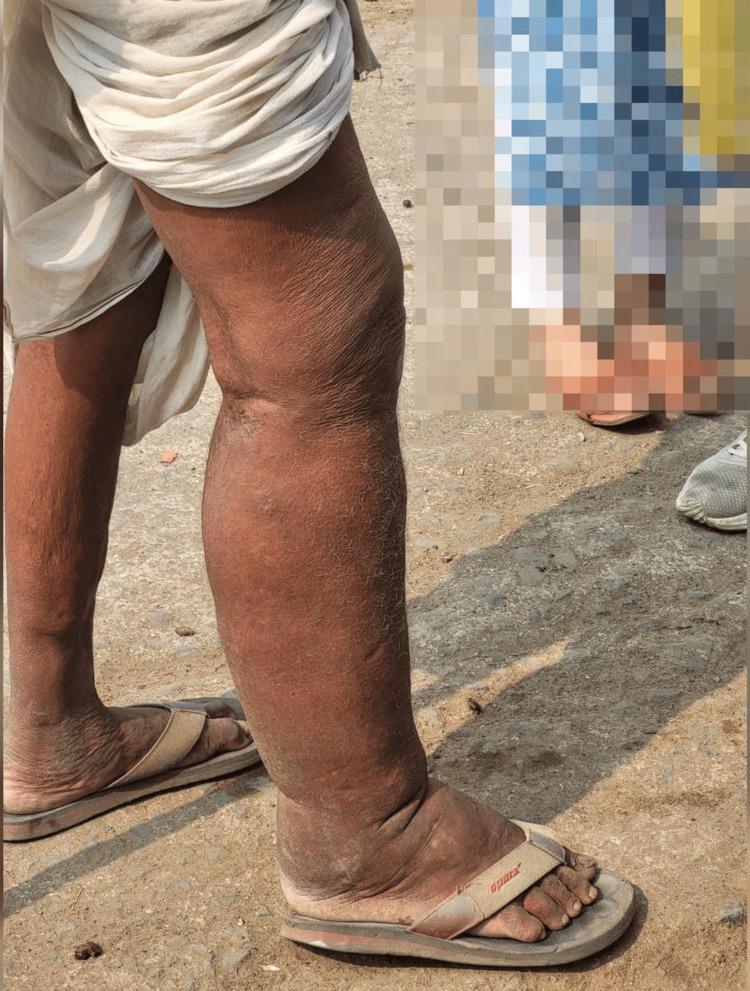
Clinical photograph of a 58-year-old male presenting with asymmetric lower extremity swelling, characteristic of chronic lymphatic filariasis (elephantiasis). The image shows a comparative view of the legs where the right lower limb exhibits advanced stage lymphedema. Key findings include massive non-pitting edema extending from the thigh to the foot, resulting in a distorted, cylindrical limb shape. The skin on the affected right leg is significantly thickened, displaying hyperkeratosis, prominent skin folds, and a rough, brawny texture (pachydermia) compared to the relatively normal appearance of the left leg. The foot shows significant swelling with obscured anatomical contours and secondary skin changes. This visual demonstrates the chronic obstructive stage of a filarial infection, where lymphostasis leads to tissue fibrosis and permanent dermal thickening. The clinical context suggests a history of recurrent adenolymphangitis in an endemic region, illustrating the progression from early pitting edema to late-stage irreversible lymphedema.
pulmonary edema lungs frothy fluid alveolar flooding
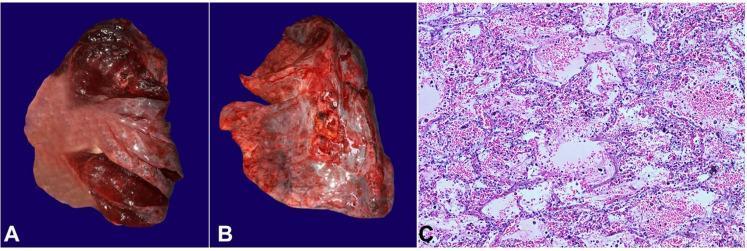
This composite image illustrates the gross and microscopic pathology of acute pulmonary edema and hemorrhage. Panels A and B provide a gross view of unfixed human lungs, showing a boggy, heavy, and markedly edematous appearance. The pleural surfaces are congested with visible darkening and focal areas of discoloration. Panel B specifically demonstrates the cut surface of the parenchyma with the exudation of frothy, serosanguinous fluid, a hallmark of severe pulmonary congestion. Panel C is a low-magnification photomicrograph (H&E stain) of the lung tissue. It reveals diffuse alveolar and interstitial edema, characterized by the accumulation of pale pink, proteinaceous fluid within the alveolar spaces. There is significant disruption of the normal alveolar architecture, accompanied by focal areas of intra-alveolar hemorrhage, evidenced by the presence of numerous red blood cells within the air spaces. These findings are clinically relevant in the context of congestive heart failure, fluid overload, or acute respiratory distress syndrome, illustrating the mechanical and histological consequences of pulmonary vascular congestion.
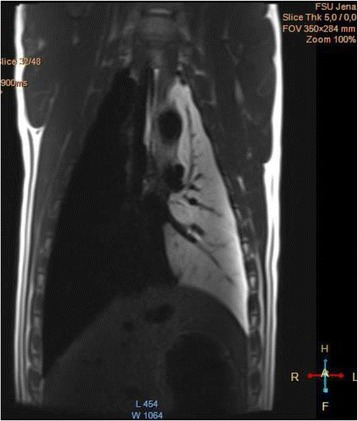
**Imaging Modality:** In-vivo Magnetic Resonance Imaging (MRI), T2-weighted sequence (TE: 84 ms / TR: 900 ms). **Anatomical Region:** Coronal section of the porcine thoracic cavity, including the lungs, mediastinum, and diaphragm. **Observed Findings:** * **Right Lung (image left):** Exhibits normal ventilation characterized by uniform signal void (hypointensity), typical of air-filled pulmonary parenchyma on standard MRI sequences. * **Left Lung (image right):** Demonstrates diffuse, high T2 signal intensity (hyperintensity) consistent with total lung flooding or massive alveolar edema. The fluid-filled parenchyma provides high contrast against the mediastinal structures. * **Key Landmarks:** Clear visualization of the diaphragmatic contour, spinal column, and central thoracic vasculature. Branching pulmonary structures are visible within the hyperintense flooded lung, likely representing air bronchograms or vascular displacement. **Clinical/Diagnostic Context:** This image serves as a comparative model for pulmonary edema or alveolar flooding, illustrating the significant contrast in T2 signal between aerated and fluid-saturated lung tissue. The unilateral distribution highlights the experimental or localized nature of the pathology.
All Types of Edema - Comprehensive Explanation
Starling Forces - The Physiological Basis
| Force | Effect |
|---|---|
| Capillary hydrostatic pressure | Pushes fluid OUT into the interstitium |
| Plasma colloid osmotic pressure (oncotic pressure) | Pulls fluid BACK into vessels |
Classification of Edema by Mechanism
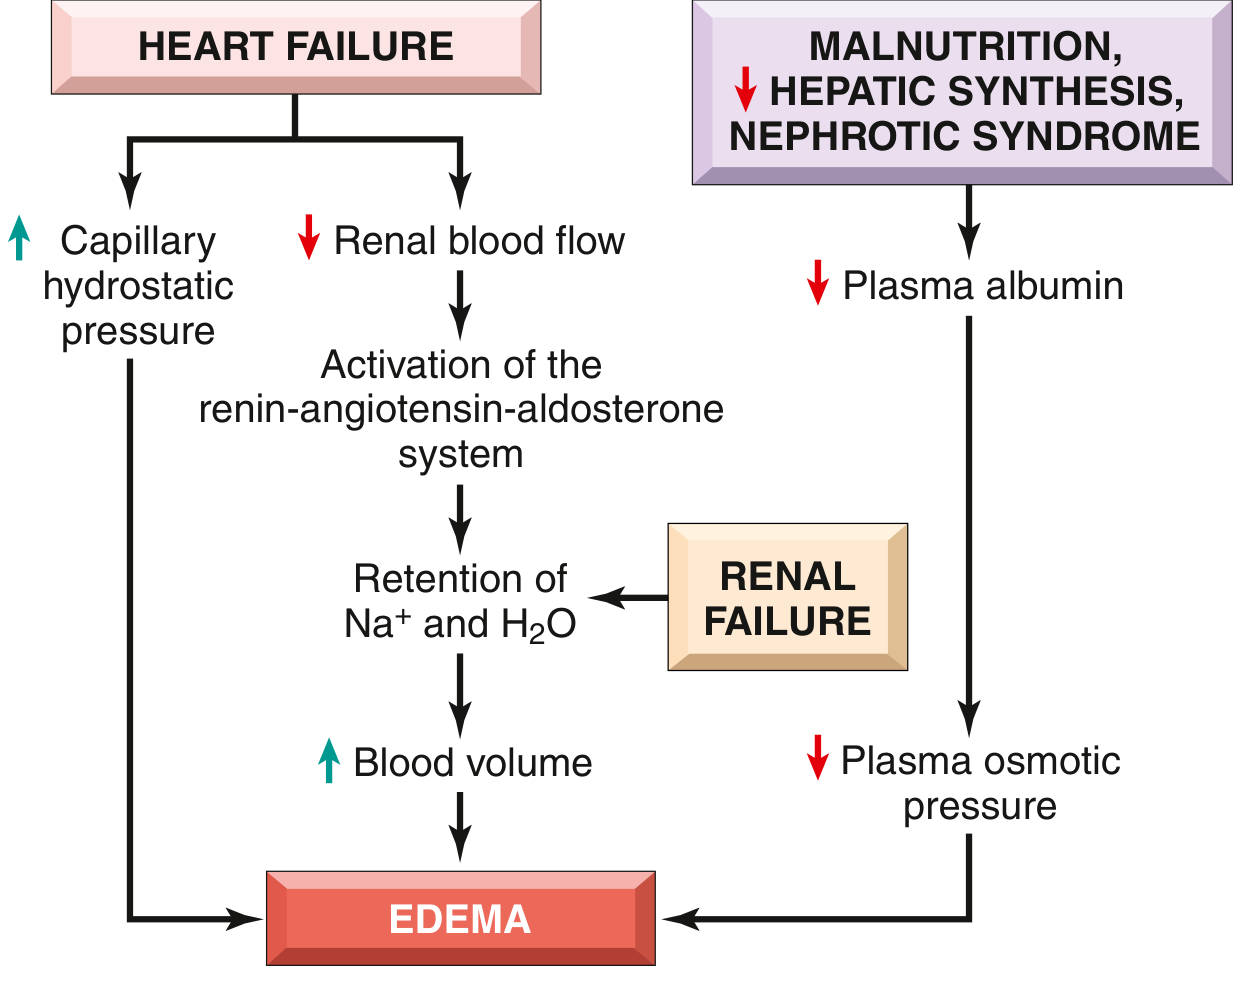
1. Edema Due to Increased Hydrostatic Pressure
Examples:
- The failing heart cannot pump blood forward efficiently, causing blood to pool in the venous circulation
- This increases capillary hydrostatic pressure throughout the body
- Simultaneously, reduced cardiac output causes renal hypoperfusion, activating the renin-angiotensin-aldosterone (RAAS) axis
- RAAS causes sodium and water retention (secondary hyperaldosteronism), expanding plasma volume
- The failing heart cannot cope with this extra volume, worsening the cycle
- Result: Widespread peripheral edema (bilateral pedal edema, sacral edema) and pulmonary edema
- Classic sign: Bilateral pitting edema of the ankles that worsens during the day and improves overnight
- A clot in the deep veins of the leg obstructs venous return locally
- Hydrostatic pressure rises only downstream (distal) from the thrombus
- Result: Unilateral leg edema - redness, warmth, and tenderness in one leg only
- This localized pattern distinguishes it from bilateral cardiac edema
- The stiff, thickened pericardium restricts cardiac filling
- Right heart filling is impaired, raising systemic venous pressure
- Result: Ascites (peritoneal fluid) and peripheral edema
- Cirrhosis increases resistance to portal blood flow
- Elevated portal pressure drives fluid into the peritoneal cavity
- Result: Ascites (fluid in the abdominal cavity)
- When legs are kept in a dependent position for long periods (e.g., long flights, bed rest), venous pooling raises hydrostatic pressure
- Calf-muscle pump action normally aids venous return; without it, edema accumulates
- Result: Bilateral ankle swelling, typically non-inflammatory and resolves with elevation
2. Edema Due to Reduced Plasma Osmotic Pressure (Hypoproteinemia)
Examples:
- Glomerular damage (e.g., minimal change disease, membranous nephropathy) allows albumin to leak into the urine (proteinuria >3.5 g/day)
- Plasma albumin falls (hypoalbuminemia), reducing oncotic pressure
- Simultaneously, renal hypoperfusion triggers RAAS, causing Na+ and water retention - which worsens edema further rather than fixing it, because the root cause (low albumin) persists
- Classic sign: Periorbital edema (puffiness around the eyes) that is worst in the morning - because the loose connective tissue around the eyelids fills easily, and fluid redistributes while lying flat overnight
- Also causes ascites, pleural effusion, and generalized swelling
- The liver synthesizes albumin; severe cirrhosis (from alcohol, viral hepatitis, etc.) drastically reduces albumin synthesis
- Hypoalbuminemia reduces oncotic pressure
- Combined with portal hypertension (increased hydrostatic pressure), this is a "double-hit" mechanism
- Result: Massive ascites, bilateral leg edema, and sometimes pleural effusion (hepatic hydrothorax)
- Severely inadequate dietary protein intake reduces albumin synthesis
- Occurs in children with calorie-adequate but protein-deficient diets
- Classic sign: Pot-belly in children - massive ascites with a protuberant abdomen - alongside edematous limbs, yet the child appears thin in the face and upper body
- This is distinct from marasmus (pure calorie deficiency) which does NOT cause edema
- Conditions like Crohn's disease, intestinal lymphangiectasia, or Menetrier's disease cause loss of protein through the gut wall
- Plasma albumin falls, reducing oncotic pressure
- Result: Generalized edema and ascites
3. Inflammatory Edema (Increased Vascular Permeability)
Examples:
- Immediately after a bee sting or insect bite, histamine from mast cells causes local vasodilation and increased permeability
- Result: Localized wheal (raised, pale, firm swelling surrounded by erythema - flare), which is warm and tender
- In cellulitis (bacterial skin infection), the entire area of infected skin becomes red, hot, swollen, and tender
- Involves deeper dermis and subcutaneous tissues (unlike urticaria which is more superficial)
- Can be allergic (IgE-mediated), hereditary (C1-esterase inhibitor deficiency), or drug-induced (ACE inhibitors block bradykinin breakdown)
- Result: Dramatic swelling of face, lips, tongue, or larynx - laryngeal involvement is life-threatening
- ACE inhibitor-induced angioedema can occur years after starting the drug
- Acute Respiratory Distress Syndrome causes diffuse alveolar damage with massive increase in lung vascular permeability
- Protein-rich fluid floods the alveoli, impairing gas exchange
- Distinguished from cardiogenic pulmonary edema by absence of high wedge pressure
- Thermal injury causes release of vasoactive mediators and direct endothelial damage
- Massive local (and even systemic) edema results from protein-rich fluid leaking out
4. Lymphedema (Lymphatic Obstruction)
Examples:
- Filarial parasites (Wuchereria bancrofti) infect and obstruct the inguinal lymphatics and lymph nodes
- Chronic obstruction causes massively progressive edema of the lower extremity and external genitalia
- Over years, the skin becomes thickened, rough, and hyperkeratotic
- Called "elephantiasis" because the limb resembles an elephant's leg
- Axillary lymph node dissection (for breast cancer staging/treatment) and/or radiotherapy disrupts lymphatic drainage of the arm
- Result: Chronic, progressive non-pitting swelling of the entire arm on the affected side
- A common and debilitating complication after mastectomy
- Infiltration of superficial lymphatics of the breast by cancer cells obstructs local drainage
- Characteristic finely pitted ("orange peel") appearance of the overlying skin results from tethering of skin at hair follicles while surrounding skin is edematous
- Any condition causing lymph node scarring (e.g., recurrent erysipelas, filariasis, lymph node tuberculosis) can produce progressive lymphedema
5. Edema Due to Sodium and Water Retention
Examples:
- Inflamed glomeruli fail to filter Na+ properly; RAAS-independent Na+ retention occurs
- Plasma volume expands
- Result: Sudden periorbital edema and hypertension in a child 1-3 weeks after streptococcal throat infection
- The kidneys lose the ability to excrete water and sodium
- Fluid accumulates, raising hydrostatic pressure and diluting plasma proteins
- Result: Generalized edema, hypertension, and risk of pulmonary edema
- Excess aldosterone causes the kidney to retain Na+ and water
- Usually causes hypertension rather than overt edema (because a "pressure natriuresis" phenomenon limits fluid accumulation)
- However, at extremes, peripheral edema can develop
6. Pulmonary Edema
Two Main Types:
- Caused by left heart failure or mitral stenosis
- Elevated left atrial pressure → elevated pulmonary venous pressure → elevated pulmonary capillary pressure
- When pulmonary capillary pressure exceeds plasma oncotic pressure (~25-28 mmHg), fluid floods the interstitium then the alveoli
- Symptoms: Breathlessness (dyspnea), orthopnea (breathless when lying flat), pink frothy sputum
- X-ray: "Bat-wing" perihilar opacification, Kerley B lines (horizontal lines at lung bases from fluid in interlobular septa), cardiomegaly
- Patients with chronic mitral stenosis can tolerate pulmonary capillary pressures of 40-45 mmHg before pulmonary edema develops because lymphatics hypertrophy to compensate
- Increased vascular permeability (ARDS, pneumonia, inhaled toxins like chlorine gas)
- Normal wedge pressure (no left heart failure)
- Protein-rich exudate floods alveoli
7. Cerebral Edema
Two Main Types:
- Caused by disruption of the blood-brain barrier (BBB)
- Fluid shifts from the intravascular compartment into the extracellular spaces of the brain
- Can be localized (tumor, abscess, focal inflammation) or generalized (severe meningitis, global ischemia)
- Examples:
- Brain tumor - perilesional vasogenic edema (bright T2/FLAIR on MRI)
- Bacterial meningitis - generalized BBB breakdown causes widespread vasogenic edema
- Eclampsia (PRES) - posterior reversible encephalopathy syndrome; vasogenic edema predominantly in the occipital/parieto-occipital white matter
- BBB breakdown allows even large proteins to escape; fluid is protein-rich
- Treatment: Dexamethasone (reduces tumor-associated vasogenic edema); osmotherapy
- Intracellular swelling due to failure of Na+/K+-ATPase pumps (from ischemia, hypoxia, toxins)
- Na+ and water flood INTO cells (neurons, glia)
- The blood-brain barrier is initially INTACT - the extracellular space actually shrinks
- Examples:
- Acute ischemic stroke - neurons swell within minutes of ischemia due to pump failure
- Drowning / global hypoxia - widespread cytotoxic edema across the brain
- Hyponatremia - osmotic driving of water into brain cells
- Does not respond to corticosteroids; managed with osmotherapy (mannitol, hypertonic saline) and addressing underlying cause
In practice, most severe brain injuries involve both types together - initial cytotoxic followed by BBB breakdown causing vasogenic edema.
8. Localized vs. Generalized Edema
| Feature | Localized | Generalized |
|---|---|---|
| Distribution | One limb, organ, or body part | Whole body, symmetrical |
| Common causes | DVT, lymphedema, cellulitis, allergy | CHF, nephrotic syndrome, cirrhosis, renal failure |
| Example | Unilateral leg swelling from DVT | Bilateral ankle edema from CHF |
9. Pitting vs. Non-Pitting Edema
| Feature | Pitting | Non-Pitting |
|---|---|---|
| Mechanism | Fluid displaced by pressure | Fibrosis/protein deposition; fluid cannot be displaced |
| Test | Finger pressure leaves an indent for >2 seconds | No indent on pressing |
| Causes | CHF, nephrotic syndrome, venous insufficiency, hypoproteinemia | Lymphedema, myxedema (hypothyroidism), lipedema |
10. Special Forms of Edema
Anasarca
- Severe, generalized edema involving profound swelling of subcutaneous tissues AND accumulation of fluid in body cavities (pleural effusion, ascites, pericardial effusion)
- Seen in advanced nephrotic syndrome, severe heart failure, or end-stage liver disease
- The patient appears massively swollen from head to toe
Myxedema (Hypothyroidism)
- Hypothyroidism causes accumulation of hydrophilic glycosaminoglycans (mucopolysaccharides) in the dermis
- This pulls in water, causing a characteristic non-pitting edema of the face (puffy, dull face), hands, and lower legs
- The term "myxedema" literally means "mucous edema"
- Periorbital puffiness is a hallmark clinical feature
Idiopathic Edema
- Cyclical edema in women, especially during the luteal phase of the menstrual cycle
- Associated with excessive capillary permeability and abnormal aldosterone response to standing
- Responds partially to diuretics and aldosterone antagonists
Hydrocele (Scrotal)
- Accumulation of serous fluid within the tunica vaginalis surrounding the testis
- Usually a transudate; can be congenital (patent processus vaginalis in infants) or acquired (after infection, trauma, or tumor)
Summary Table
| Type | Mechanism | Fluid | Pitting | Example |
|---|---|---|---|---|
| Increased hydrostatic pressure | Venous back-pressure | Transudate | Pitting | CHF, DVT |
| Decreased oncotic pressure | Low albumin | Transudate | Pitting | Nephrotic syndrome, kwashiorkor |
| Increased permeability | Inflammation | Exudate | Pitting | Cellulitis, ARDS, angioedema |
| Lymphatic obstruction | Blocked lymphatics | Protein-rich | Non-pitting | Filariasis, post-mastectomy |
| Na+/H2O retention | Renal/hormonal | Mixed | Pitting | Renal failure, hyperaldosteronism |
| Pulmonary edema | ↑ pulm. cap. pressure or permeability | Transudate/Exudate | N/A (lungs) | LV failure, ARDS |
| Vasogenic cerebral edema | BBB breakdown | Protein-rich | N/A (brain) | Tumor, meningitis, eclampsia |
| Cytotoxic cerebral edema | Cell swelling | Intracellular | N/A (brain) | Stroke, hypoxia, hyponatremia |
| Myxedema | GAG accumulation | Mucous | Non-pitting | Hypothyroidism |