
Did u make notes
- Are you asking about notes on a specific topic (medical, tax, exam prep, etc.)?
- Did you want me to create notes on something?
- Or were you referring to notes from a previous session?
Oky I'm a nursing student of 2nd sem I'll give u the topics
Physiology of digestive system for 10 marks question
digestive system physiology diagram gastrointestinal tract
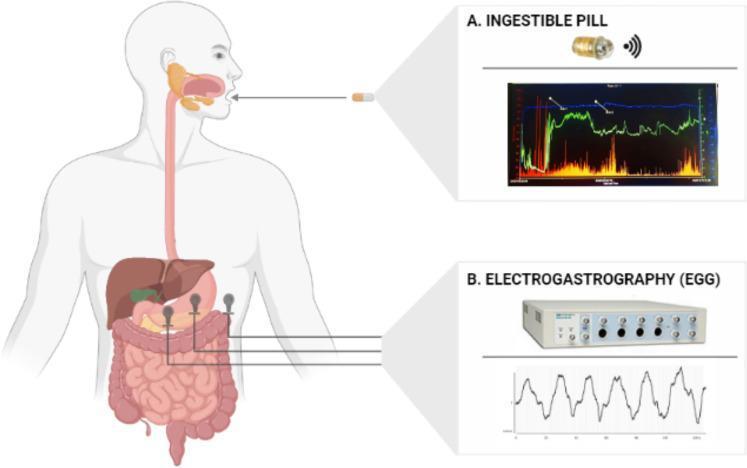
This medical infographic illustrates non-invasive methods for monitoring gastrointestinal (GI) physiology. A central anatomical diagram shows the human digestive tract, including the esophagus, stomach, and intestines. Part A highlights an ingestible wireless capsule (SmartPill) being swallowed, accompanied by a MotiliGI software graph. The graph displays real-time longitudinal monitoring of intraluminal parameters across the GI tract: temperature (blue line), pH levels (green line), and pressure (orange bars). Part B illustrates surface electrogastrography (EGG) setup. It depicts a 1-channel bipolar electrode montage with three cutaneous electrodes placed on the abdominal wall over the stomach region. This is connected to a data acquisition device (PowerLab) that records gastric myoelectric activity. Below the device, a typical EGG waveform shows rhythmic electrical oscillations corresponding to the stomach's slow-wave activity (approximately 0.05 Hz). These tools are used in clinical gastroenterology to evaluate gastric emptying, intestinal transit times, and myoelectric motility disorders such as gastroparesis.
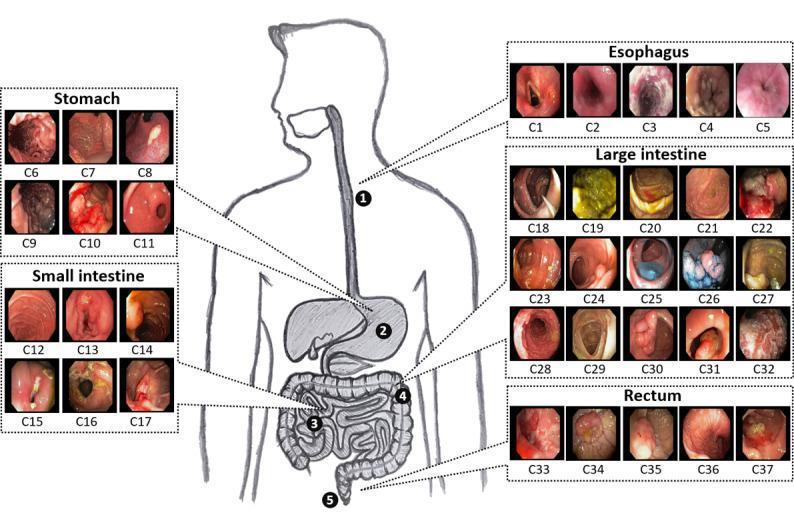
An educational anatomical diagram and infographic illustrating the human gastrointestinal (GI) tract and corresponding endoscopic findings. Centered is a line drawing of a human torso showing the digestive system with numbered regions: 1 (Esophagus), 2 (Stomach), 3 (Small Intestine), 4 (Large Intestine), and 5 (Rectum). Surrounding this central figure are five categorized panels containing 37 endoscopic image frames (C1-C37). The Esophagus panel (C1-C5) shows variations in luminal appearance and mucosal texture. The Stomach panel (C6-C11) displays clinical signs such as dark necrotic patches, erythematous lesions, and possible blood clots. The Small Intestine panel (C12-C17) illustrates healthy pinkish mucosa alongside abnormalities like stenotic lesions and discoloration. The Large Intestine panel (C18-C32) is the most extensive, showing a spectrum of pathologies including polyps, inflammatory changes, and varied fecal matter. The Rectum panel (C33-C37) depicts distal GI findings including nodular tissue and masses. The graphic serves to classify endoscopic data by anatomical district, demonstrating high intraclass variance and various disease manifestations suitable for medical AI training and gastroenterology education.
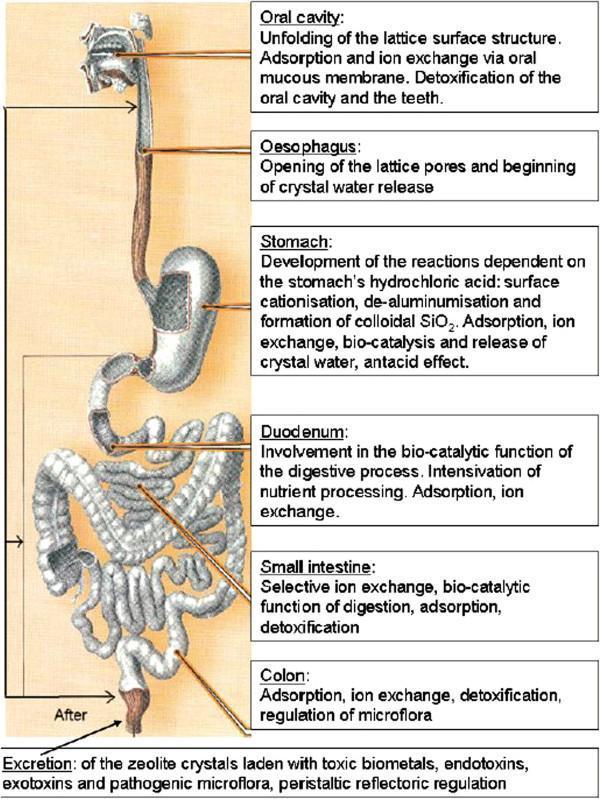
This medical illustration depicts the pathway of natural zeolites through the human gastrointestinal tract, highlighting the structural and biochemical changes that occur at each digestive stage. The diagram uses an anatomical illustration of the digestive system from the oral cavity to the rectum, with descriptive labels for each major organ. In the oral cavity, surface lattice unfolding and ion exchange facilitate detoxification. In the esophagus, lattice pores open. Within the stomach, the acidic environment (HCl) triggers surface cationisation, de-aluminumisation, and formation of colloidal SiO2, alongside antacid effects. The duodenum and small intestine sections describe bio-catalytic functions, nutrient processing, and selective ion exchange. In the colon, the zeolite regulates microflora and undergoes further detoxification. The process concludes at excretion, where zeolite crystals—laden with adsorbed toxic biometals, endotoxins, and pathogenic microflora—are eliminated. This pathophysiology diagram serves as an educational tool for understanding the proposed detoxifying mechanisms of orally administered zeolites in clinical and pharmacological contexts.
📝 Physiology of the Digestive System
Nursing 2nd Semester | 10 Marks Notes
1. INTRODUCTION
- Motility - movement of food along the tract
- Secretion - release of digestive juices and enzymes
- Digestion - breakdown of food into absorbable units
- Absorption - uptake of nutrients into the blood
2. MOTILITY
Types of Muscle in GIT
- Most of the GIT wall = smooth (unitary) muscle - cells connected via gap junctions allowing coordinated contractions
- Exceptions: pharynx, upper 1/3 of esophagus, external anal sphincter = striated muscle
Types of Contractions
| Type | Function | Location |
|---|---|---|
| Phasic | Periodic contractions + relaxation | Esophagus, gastric antrum, small intestine |
| Tonic | Constant contraction (no relaxation) | Upper stomach, sphincters |
Sphincters of the GIT
- Upper Esophageal Sphincter - separates pharynx and esophagus
- Lower Esophageal Sphincter (LES) - separates esophagus and stomach; prevents gastric reflux
- Pyloric Sphincter - separates stomach and duodenum
- Ileocecal Sphincter - separates ileum and cecum
- Internal and External Anal Sphincters - maintain fecal continence
Esophageal Motility - Swallowing (Deglutition)
- Oropharyngeal phase - voluntary; tongue pushes bolus into pharynx
- Esophageal phase - involuntary; primary peristalsis carries bolus down
- As the bolus approaches LES, LES opens (via VIP neurotransmitter from vagus nerve) and the orad stomach relaxes (receptive relaxation) to receive food
- If primary peristalsis fails to clear esophagus → secondary peristalsis (from enteric nervous system) completes clearance
Clinical Note: In achalasia, the LES fails to relax and peristalsis is impaired → dysphagia (difficulty swallowing) and esophageal dilation above the sphincter.
Gastric Motility
- Receptive relaxation of the orad (upper) stomach to receive food from esophagus
- Mixing contractions (caudad region) - reduce bolus size and mix with gastric secretions
- Gastric emptying - propels chyme into duodenum; rate is regulated by hormones to allow adequate time for digestion
Small Intestinal Motility
- Segments of intestine alternately contract and relax
- Mix chyme with digestive enzymes and expose it to mucosa
- No net forward movement - only mixing
- Coordinated wave of contraction behind, relaxation in front of bolus
- Propels chyme forward (caudad direction)
- Coordinated by the enteric nervous system
Slow waves in duodenum = 12/min; in ileum = 9/min. Between meals, Migrating Myoelectric Complexes (MMC) occur every 90 minutes to sweep residual chyme forward.
- Parasympathetic (vagus nerve) → INCREASES contractions
- Sympathetic (celiac & superior mesenteric ganglia) → DECREASES contractions
3. SECRETION
3A. Salivary Secretion
- Hypotonic (less Na⁺, Cl⁻ than plasma; more K⁺, HCO₃⁻ than plasma)
- Contains: α-amylase (starts carbohydrate digestion), lingual lipase, mucin (lubricant), IgA, kallikrein
- Begins digestion of starch (amylase) and fats (lingual lipase)
- Lubricates food (mucin)
- Antibacterial protection (IgA)
At HIGH flow rates → saliva resembles plasma (less modification time). At LOW flow rates → saliva is most hypotonic (more modification by ducts).
3B. Gastric Secretion
| Stimulant | Type | Receptor | 2nd Messenger |
|---|---|---|---|
| Histamine | Paracrine (from ECL cells) | H₂ receptor | cAMP |
| Acetylcholine (ACh) | Neurocrine (vagus nerve) | M₃ (muscarinic) receptor | IP₃/Ca²⁺ |
| Gastrin | Hormone (from G cells in antrum) | CCK-B receptor | IP₃/Ca²⁺ |
- Cimetidine blocks H₂ receptors → reduces acid secretion
- Proton pump inhibitors (PPIs) block H⁺/K⁺ ATPase directly
- Cephalic phase - stimulated by sight, smell, thought of food (via vagus nerve)
- Gastric phase - stimulated by stomach distension, protein/amino acids in stomach; gastrin secreted by G cells
- Intestinal phase - small amount of stimulation as chyme enters duodenum; inhibition by secretin and CCK when fat/acid enters duodenum
3C. Pancreatic Secretion
- Enzymatic component (acinar cells) - digestive enzymes
- Aqueous HCO₃⁻ component (ductal/centroacinar cells) - neutralizes acid chyme from stomach
| Nutrient | Pancreatic Enzyme | Note |
|---|---|---|
| Carbohydrates | Amylase | Secreted as active enzyme |
| Proteins | Trypsin, Chymotrypsin, Carboxypeptidase, Elastase | Secreted as inactive pro-enzymes; activated by enterokinase in duodenum |
| Fats | Lipase-colipase, Phospholipase A₂, Cholesterol ester hydrolase | Secreted as active enzymes |
- Secretin (from S cells of duodenum) → stimulated by acid in duodenum → increases HCO₃⁻ secretion
- CCK (from I cells of duodenum) → stimulated by fats and proteins → increases enzyme secretion
- Vagus (parasympathetic) → stimulates secretion
- Sympathetic → inhibits secretion
3D. Bile Secretion
- Produced by: Liver hepatocytes
- Stored in: Gallbladder (concentrated)
- Released by: CCK stimulation (when fat enters duodenum)
- Bile salts emulsify fats → form micelles → essential for fat digestion and absorption
4. DIGESTION AND ABSORPTION
4A. Carbohydrate Digestion and Absorption
- Mouth: Salivary α-amylase starts starch digestion (inactivated by stomach acid)
- Pancreas: Pancreatic amylase digests starch → maltose, maltotriose, α-limit dextrins
- Brush border (small intestine): Maltase, sucrase, lactase, trehalase → monosaccharides
- Glucose & Galactose: Secondary active transport via SGLT1 (Na⁺-glucose cotransporter) on apical membrane; exits basolateral membrane via GLUT2 (facilitated diffusion)
- Fructose: Facilitated diffusion via GLUT5 (apical) and GLUT2 (basolateral) - no energy required
Lactose intolerance = deficiency of lactase enzyme → undigested lactose → osmotic diarrhea, bloating, gas
4B. Protein Digestion and Absorption
- Stomach: Pepsin (activated from pepsinogen by HCl) → breaks proteins into large peptides
- Pancreas: Trypsin, chymotrypsin, carboxypeptidase → smaller peptides and amino acids
- Brush border: Aminopeptidases, dipeptidases → free amino acids
- Absorption: Amino acids absorbed by Na⁺-dependent cotransport (similar to glucose)
4C. Fat (Lipid) Digestion and Absorption
- Emulsification: Bile salts break fat into small droplets → increases surface area
- Digestion: Pancreatic lipase-colipase hydrolyzes triglycerides → monoglycerides + free fatty acids
- Micelle formation: Products combine with bile salts to form micelles (water-soluble)
- Absorption: Micelles approach brush border → lipids diffuse across the membrane
- Inside cell → reassembled into triglycerides → packaged into chylomicrons → enter lymphatics (lacteals) → blood
5. HORMONES OF THE DIGESTIVE SYSTEM (Summary Table)
| Hormone | Secreted By | Stimulus | Action |
|---|---|---|---|
| Gastrin | G cells (stomach antrum) | Protein, distension, vagus | Stimulates HCl secretion |
| Secretin | S cells (duodenum) | Acid in duodenum | Stimulates HCO₃⁻ from pancreas |
| CCK | I cells (duodenum) | Fat + protein in duodenum | Stimulates pancreatic enzymes + bile release |
| GIP | K cells (duodenum) | Glucose + fat | Stimulates insulin release |
| Motilin | Small intestine | Fasting state | Triggers MMC (housekeeping contractions) |
6. LARGE INTESTINE FUNCTIONS
- Absorption of water and electrolytes from chyme
- Storage of feces
- Defecation reflex - mass movements push feces into rectum → stretch receptors → urge to defecate → internal anal sphincter relaxes (involuntary) + external anal sphincter relaxes (voluntary)
QUICK SUMMARY FOR 10 MARKS ANSWER
- Introduction (2-3 lines on GIT and its 4 functions)
- Motility (peristalsis, segmentation, sphincters)
- Secretion (saliva, gastric acid/HCl, pancreatic enzymes, bile)
- Digestion (carbohydrates, proteins, fats - where and how)
- Absorption (mechanisms - SGLT1, GLUT2, chylomicrons)
- Hormonal regulation (gastrin, secretin, CCK)
- Large intestine and defecation
Tip: Draw a simple table showing digestive enzymes and their sites of action - it impresses examiners and covers multiple points clearly.