
Iron profile clinical explanation
Reading File
Now let me search the medical library for iron profile content in parallel.
Finding Sources
Finding Sources
Excellent results. Let me now read the key sections from multiple sources in parallel.
Reading File
Reading File
Reading File
Now let me get the ACD vs IDA comparison table and the Tietz section on iron methods.
Reading File
Reading File
Finding Sources
Let me get the Family Medicine section on iron studies and also the ferritin/soluble transferrin receptor details.
Reading File
Finding Sources
I now have comprehensive data from multiple authoritative sources. Let me also fetch the microscopic images of IDA from the pathology book to include visuals.
Loading Image
Reading File
I now have all the information needed to write a thorough clinical explanation of the iron profile. Let me compile this into a comprehensive answer.
Iron Profile - Clinical Explanation
The iron profile is a panel of blood tests that together assess the body's iron status - covering stores, transport, utilization, and deficiency or overload. Each component has a distinct physiological meaning, and interpreting them together is far more informative than any single test alone.
The Components and Their Normal Ranges
| Test | Reference Range | What It Measures |
|---|---|---|
| Serum Iron | 70-200 µg/dL (13-36 µmol/L) | Fe³⁺ bound to serum transferrin |
| TIBC (Total Iron-Binding Capacity) | 250-435 µg/dL (45-78 µmol/L) | Maximum iron transferrin can carry |
| Transferrin | 2.0-3.6 g/L | Major iron-carrying protein |
| Transferrin Saturation (TSAT) | 15-45% | Proportion of transferrin sites occupied by iron |
| Serum Ferritin | Men ~100 µg/L; Women ~30 µg/L | Indirect marker of total body iron stores |
Understanding Each Test
1. Serum Iron
Serum iron measures only the Fe³⁺ bound to transferrin in plasma - it does not reflect iron in hemoglobin, ferritin, or low-molecular-weight complexes (citrate, oxalate). There is marked diurnal variation - levels are higher in the morning and fall later in the day. For this reason, samples should be drawn on a fasting morning specimen. Serum iron rises transiently after meals, iron ingestion, or transfusions, and is also elevated in acute hepatitis, chronic liver failure, and ineffective erythropoiesis. It falls with inflammation, infection, and ascorbate deficiency. As Harrison's Principles of Internal Medicine states, the normal range is 9-27 µmol/L (50-150 µg/dL).
2. TIBC and Transferrin
Only about one-third of transferrin's iron-binding sites are occupied under normal conditions - the rest represent the unsaturated iron-binding capacity (UIBC). TIBC is therefore a surrogate measure of transferrin concentration. Key points:
- TIBC rises in iron deficiency (the body upregulates transferrin synthesis to scavenge more iron)
- TIBC falls in chronic inflammation, malignancy, malnutrition, chronic liver disease, and nephrotic syndrome (all conditions reducing transferrin synthesis or increasing losses)
- TIBC does not have a diurnal variation, making it more stable than serum iron
- Some authorities consider transferrin measurement the best single test to distinguish IDA from ACD, though it is less sensitive in hospitalized patients
3. Transferrin Saturation (TSAT)
TSAT is calculated as:
TSAT (%) = [Serum Iron / TIBC] × 100
The reference range is approximately 15-45%. TSAT provides context to serum iron. A single low serum iron reading means little if TIBC is also low (as in ACD); TSAT integrates both values. Key thresholds:
- < 15% → iron deficiency (most guidelines use 15-20% depending on population)
- > 45% → screening threshold for hemochromatosis
- > 55% in men, > 50% in women → iron overload
4. Serum Ferritin
Ferritin is the main intracellular iron storage protein. Serum ferritin correlates closely with total body iron stores. Adult males average ~100 µg/L (corresponding to ~1 g iron stores); premenopausal females average ~30 µg/L (~300 mg stores).
Clinical cutoffs:
- < 10-15 µg/L - virtually diagnostic of iron deficiency anemia
- < 30 µg/L - 92% sensitivity and 98% specificity for iron deficiency (Textbook of Family Medicine 9e, p.233)
- > 100 µg/L - < 10% of individuals at this level have iron deficiency
- > 200 µg/L - indicates at least some iron in tissue stores (Harrison's)
Critical caveat - ferritin is an acute-phase reactant. It rises several-fold above baseline in inflammation, infection, malignancy, and liver disease (impaired clearance). A "normal" ferritin in an inflamed patient may actually coexist with true iron deficiency. A practical rule: divide the ferritin by 3 in a patient with chronic inflammation - if the result is < 20 µg/L, suspect coexisting iron deficiency.
Iron Profile in Key Clinical Conditions
| Condition | Serum Iron | TIBC/Transferrin | TSAT | Ferritin |
|---|---|---|---|---|
| Iron Deficiency Anemia (IDA) | ↓ | ↑ | ↓ (<15%) | ↓ |
| Anemia of Chronic Disease (ACD) | ↓ | ↓ | ↓ (>15%) | Normal to ↑ |
| ACD + IDA combined | ↓ | ↓ | ↓ | Normal to ↑ (masks IDA) |
| Iron Overload / Hemochromatosis | ↑ | ↓ | ↑ (>45-60%) | ↑ |
| Sideroblastic Anemia | ↑ | Normal/↑ | ↑ | ↑ |
| Thalassemia Trait | Normal | Normal | Normal | Normal |
| Chronic Liver Disease | ↑ | ↓ | ↑ | ↑ (impaired clearance) |
Sources: Tietz Textbook of Laboratory Medicine 7e; Quick Compendium of Clinical Pathology 5e
Blood Film in Iron Deficiency
The peripheral blood smear in IDA shows the classic hypochromic, microcytic picture with pencil (cigar) cells (elliptocytes), anisocytosis, and poikilocytosis. The arrows in the image below point to pencil cells:
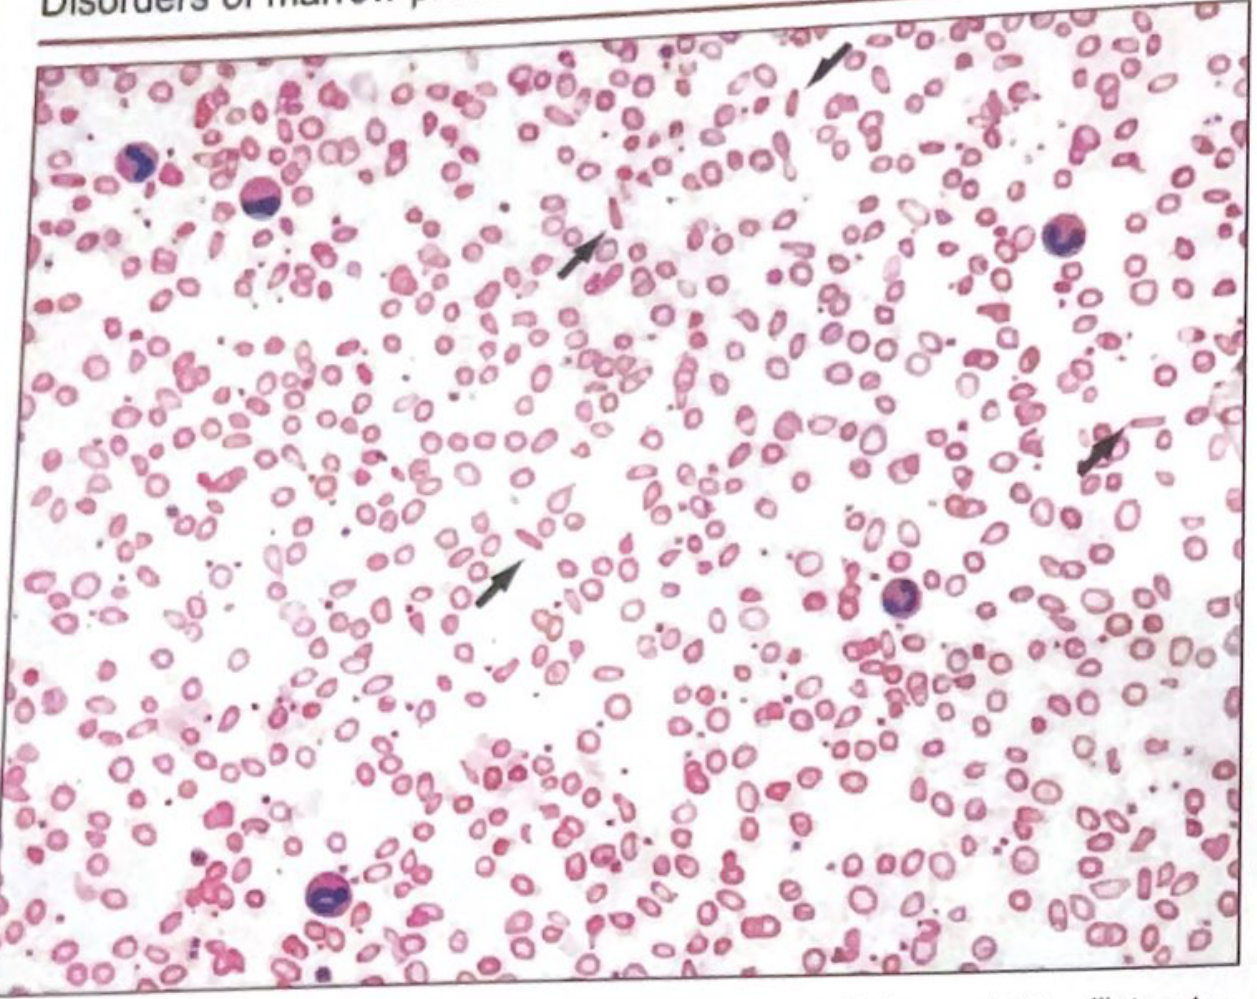
Iron deficiency anemia: hypochromic red cells and frequent thin elliptocytes (pencil cells) - Quick Compendium of Clinical Pathology 5e
Differentiating IDA from ACD - The Core Clinical Challenge
ACD (also called anemia of inflammation) superficially mimics IDA with a low serum iron and low TSAT. The key distinction is:
- Ferritin is high or normal in ACD - the reticuloendothelial system has abundant iron stores but serum hepcidin is elevated, blocking iron release to erythroblasts
- Ferritin is low in IDA - stores are genuinely depleted
When the two coexist (ACD + IDA), ferritin may be misleadingly "normal" despite true iron depletion. In this scenario, two additional markers are useful:
Soluble Transferrin Receptor (sTfR)
sTfR is expressed on red cell precursors and increases when cells are iron-starved. Unlike ferritin, it is not an acute-phase reactant and does not rise with inflammation.
- Elevated sTfR → suggests IDA even in a patient with chronic disease
- Normal sTfR → favors ACD alone
- The sTfR-to-log(ferritin) ratio is the most sensitive index for detecting iron deficiency in patients with concurrent inflammation
Zinc Protoporphyrin (ZPP) and Free Erythrocyte Protoporphyrin (FEP)
When iron is unavailable for heme synthesis, zinc substitutes for iron in protoporphyrin IX, creating ZPP. Both ZPP and FEP are elevated in IDA and useful as supporting markers.
Stages of Iron Depletion
Iron deficiency develops in three progressive stages:
- Pre-latent (Iron Store Depletion): Bone marrow iron stores fall. Ferritin drops. CBC still normal.
- Latent (Iron-Deficient Erythropoiesis): Serum iron falls, TIBC rises, TSAT falls. Erythrocytes still normochromic/normocytic. ZPP/sTfR rise.
- Iron Deficiency Anemia: Hemoglobin falls below normal. Classic microcytic, hypochromic anemia with elevated RDW and pencil cells.
The earliest and most sensitive test is a decrease in serum ferritin, even before any change in CBC. - Quick Compendium of Clinical Pathology 5e, p.225
Iron Overload - Hereditary Hemochromatosis
Screening is based on the iron profile. A TSAT ≥ 45% (some guidelines use > 50-60% in men) is the initial screening threshold with ~90% sensitivity for symptomatic homozygous HFE hemochromatosis. Patients with a repeat TSAT > 45% should undergo HFE gene testing. Ferritin > 300 µg/L in men and > 200 µg/L in women is suggestive of iron overload (in the absence of inflammation/liver disease). In iron overload, TIBC/transferrin is decreased because transferrin is already nearly fully saturated and further synthesis is suppressed.
Practical Pre-analytical Notes
- Serum iron must be drawn fasting in the morning due to diurnal variation
- Iron contamination from collection tubes is a common source of false elevation
- Hemolysis can falsely elevate serum iron
- TIBC and ferritin are unaffected by the time of day
Sources: Harrison's Principles of Internal Medicine 22E (2025) | Tietz Textbook of Laboratory Medicine 7e | Quick Compendium of Clinical Pathology 5e | Textbook of Family Medicine 9e | Brenner & Rector's The Kidney
This is a shared conversation. Sign in to Orris to start your own chat.