Explain ecg
Reading File
Finding Sources
Finding Sources
Searching Images
ECG electrocardiogram waves P QRS T diagram explanation
Reading File
Reading File
Loading Image
Loading Image
Reading File
Loading Image
Loading Image
Reading File
I now have comprehensive content from authoritative textbooks. Let me compile the full ECG explanation.
Electrocardiogram (ECG)
What Is an ECG?
The electrocardiogram (ECG or EKG) is a graphical recording of the electrical activity generated by the heart, captured at the body surface. It detects differences in electrical potential between skin electrodes and translates them into waveforms that reflect each phase of cardiac depolarization and repolarization. It is one of the most fundamental diagnostic tools in medicine — non-invasive, instantaneous, and rich with information about cardiac rhythm, conduction, ischemia, and structure.
The Cardiac Electrical Sequence
The ECG is a mirror of the heart's conduction system:
- SA Node — The sinoatrial node (in the right atrium) spontaneously depolarizes and initiates each heartbeat. This is not visible on the surface ECG.
- Atria depolarize → generates the P wave
- AV Node — Impulse slows here intentionally to allow atrial filling of the ventricles. This produces the PR interval delay.
- His bundle → Bundle branches → Purkinje fibers — Rapid conduction to ventricular muscle
- Ventricles depolarize → generates the QRS complex
- Ventricles repolarize → generates the ST segment + T wave
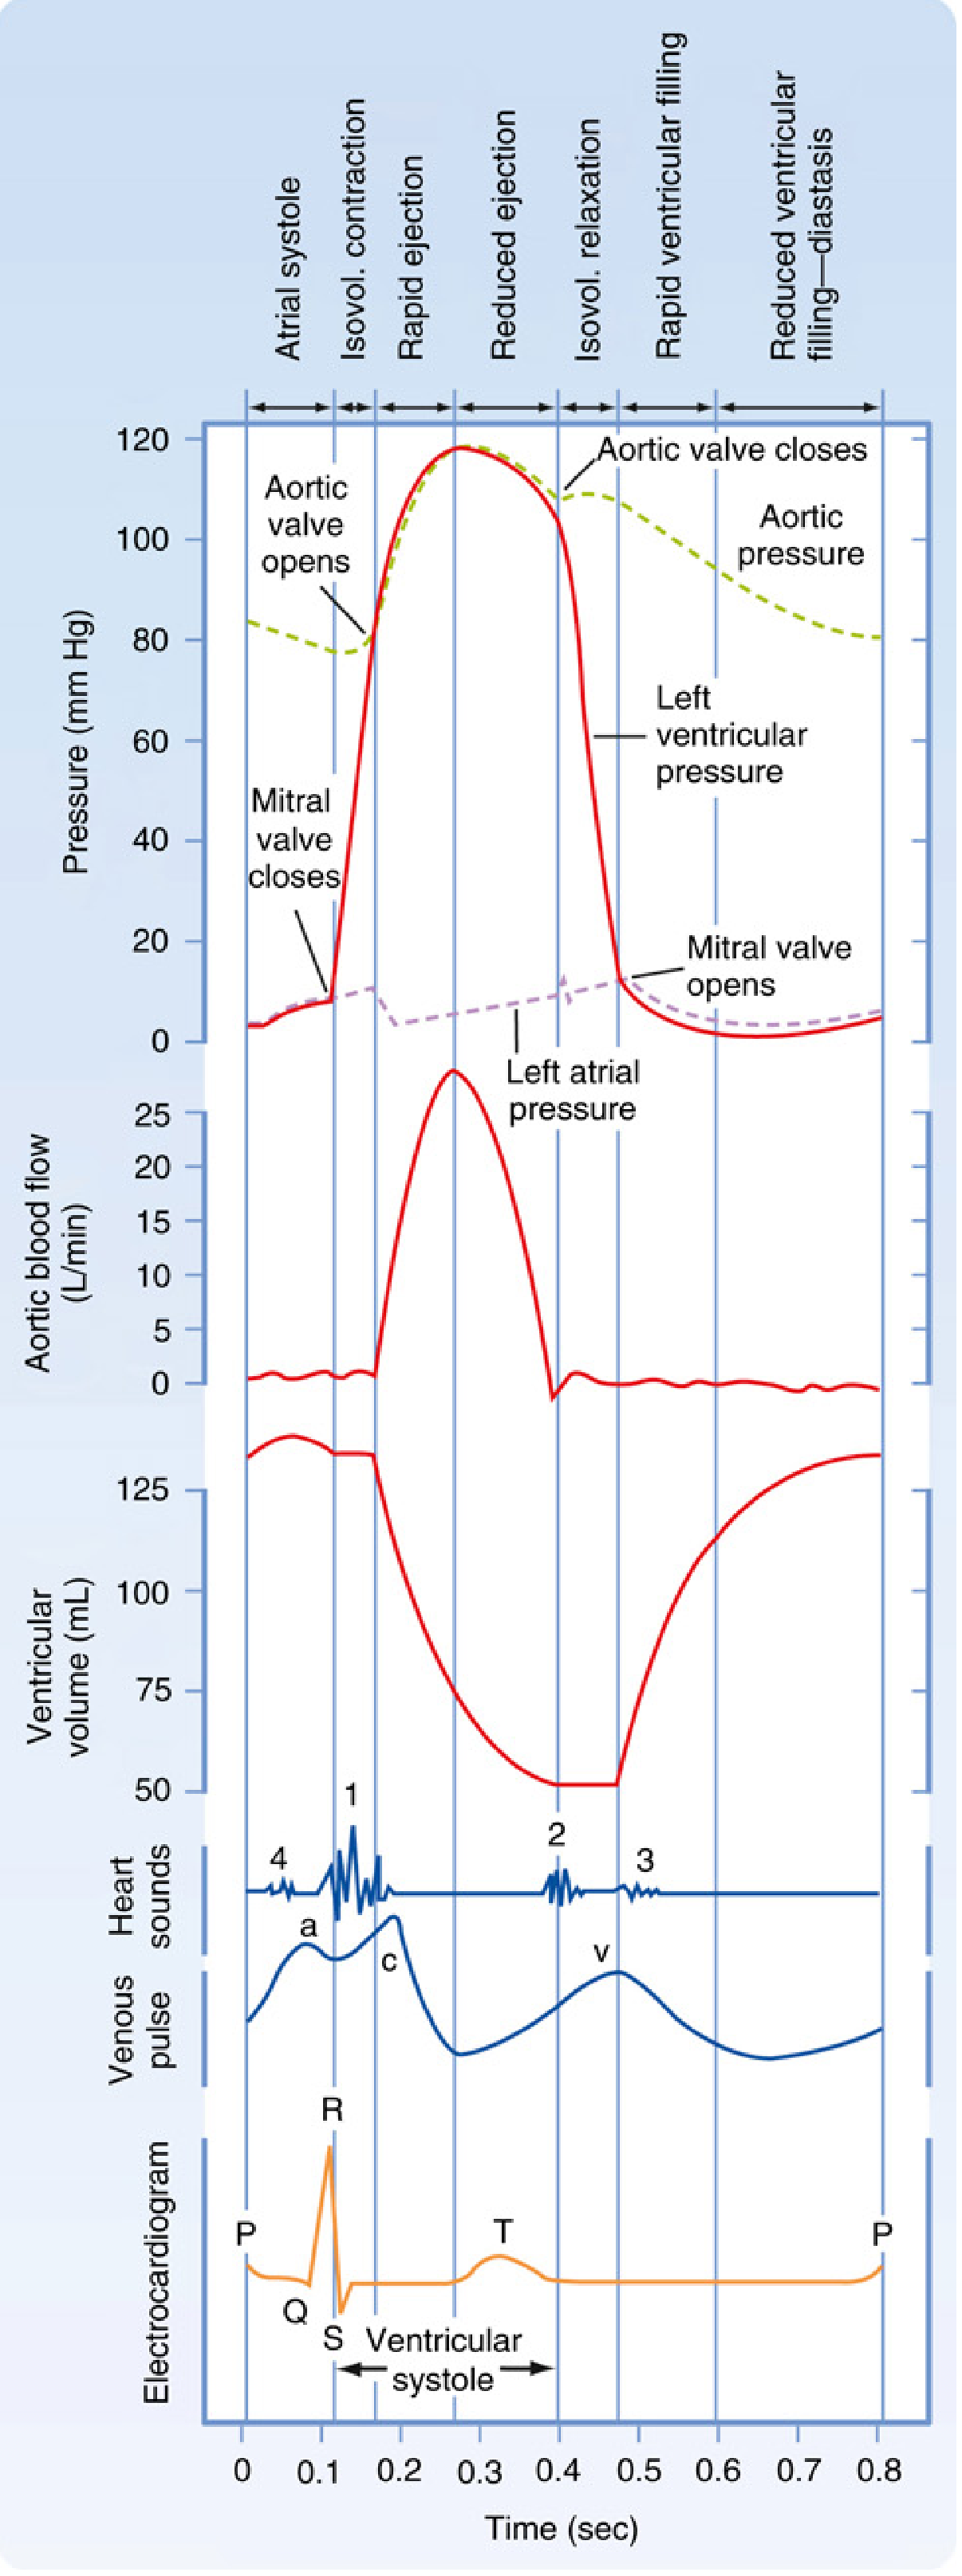
The ECG Cardiac Cycle Diagram
This diagram shows how ECG waveforms align with mechanical events (pressures, volumes, valve opening/closing):
The ECG Waves Explained
| Wave / Interval | What It Represents | Normal Value |
|---|---|---|
| P wave | Atrial muscle depolarization | Duration < 0.12 sec (120 ms) |
| PR interval | Conduction through atria + AV node + His-Purkinje | 0.09–0.20 sec |
| QRS complex | Ventricular muscle depolarization | 0.075–0.11 sec |
| ST segment | Early ventricular repolarization (isoelectric normally) | Isoelectric |
| T wave | Ventricular repolarization | Upright in most leads |
| QT interval | Total ventricular electrical activity | QTc: ♂ 390–450 ms; ♀ 390–460 ms |
| J point | Junction between end of QRS and start of ST segment | — |
| U wave | Rare; possibly Purkinje repolarization | — |
| RR interval | Time between two R waves → used to calculate heart rate | — |
Heart Rate formula: HR (bpm) = 60,000 ÷ RR interval (ms)
Why is the QRS taller than the P wave?
Ventricular muscle mass vastly exceeds atrial mass, so ventricular depolarization (QRS) generates far greater electrical amplitude. Atrial repolarization exists but is buried under the QRS complex for the same reason.
ECG Paper and Calibration
A standard ECG is recorded on graph paper with two grid sizes:
- Small box (1 mm) = 0.04 sec horizontally; 0.1 mV vertically
- Large box (5 mm) = 0.2 sec horizontally; 0.5 mV vertically
- Standard speed: 25 mm/sec
- Recording duration: 10 seconds (each of 4 groups of leads = 2.5 sec)
- Calibration: 10 mm = 1 mV (standard)
The 12-Lead ECG
A standard ECG records 12 simultaneous views ("leads") of the heart's electrical activity from different angles:
Limb leads (frontal plane):
- I, II, III — Bipolar leads between limb electrodes
- aVR, aVL, aVF — Augmented unipolar leads (right arm, left arm, left foot)
Precordial (chest) leads (horizontal plane):
- V1–V6 — Placed across the chest wall from right sternal border to lateral chest wall
Each lead "sees" the same electrical event from a different angle, providing spatial information about which part of the heart is affected.
Here is a normal 12-lead ECG:
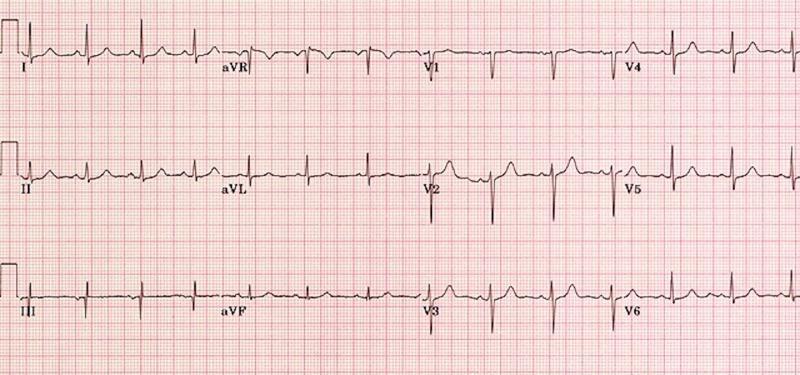
Normal Findings on ECG
| Parameter | Normal |
|---|---|
| Heart rate | 50–100 bpm |
| Rhythm | Regular (sinus rhythm: P before every QRS) |
| P wave | Upright in leads I, II, aVF; inverted in aVR |
| QRS axis | −30° to +90° |
| R-wave progression | Increases from V1 to V5 (small r in V1, large R in V5–V6) |
| ST segment | Isoelectric |
| T wave | Upright in I, II, V3–V6; normally inverted in aVR and V1 |
What Can an ECG Detect?
| Condition | ECG Finding |
|---|---|
| Myocardial infarction (STEMI) | ST elevation in territory leads |
| NSTEMI / Ischemia | ST depression, T-wave inversions |
| Atrial fibrillation | Absent P waves, irregularly irregular rhythm |
| Heart block | Prolonged or absent PR, dissociation of P and QRS |
| Bundle branch block | Wide QRS (> 120 ms) |
| Hyperkalemia | Peaked T waves → wide QRS → sine wave pattern |
| Hypokalemia | Flat T waves, prominent U waves |
| Hypothermia | J waves (Osborn waves) in V1–V3 |
| Long QT syndrome | Prolonged QTc |
| Left ventricular hypertrophy | Tall QRS voltages |
| Pulmonary embolism | S1Q3T3 pattern, sinus tachycardia |
Clinical Use
The ECG is recorded in virtually every cardiac, respiratory, and emergency evaluation. It is essential for diagnosing arrhythmias, chest pain, syncope, palpitations, electrolyte disturbances, and drug toxicity (e.g., QT prolongation from medications).
Sources: Goldman-Cecil Medicine, 26e; Miller's Anesthesia, 10e
This is a shared conversation. Sign in to Orris to start your own chat.