
Transvription in eukaryotes and prokaryote, trasulation in both
transcription prokaryote eukaryote RNA polymerase promoter
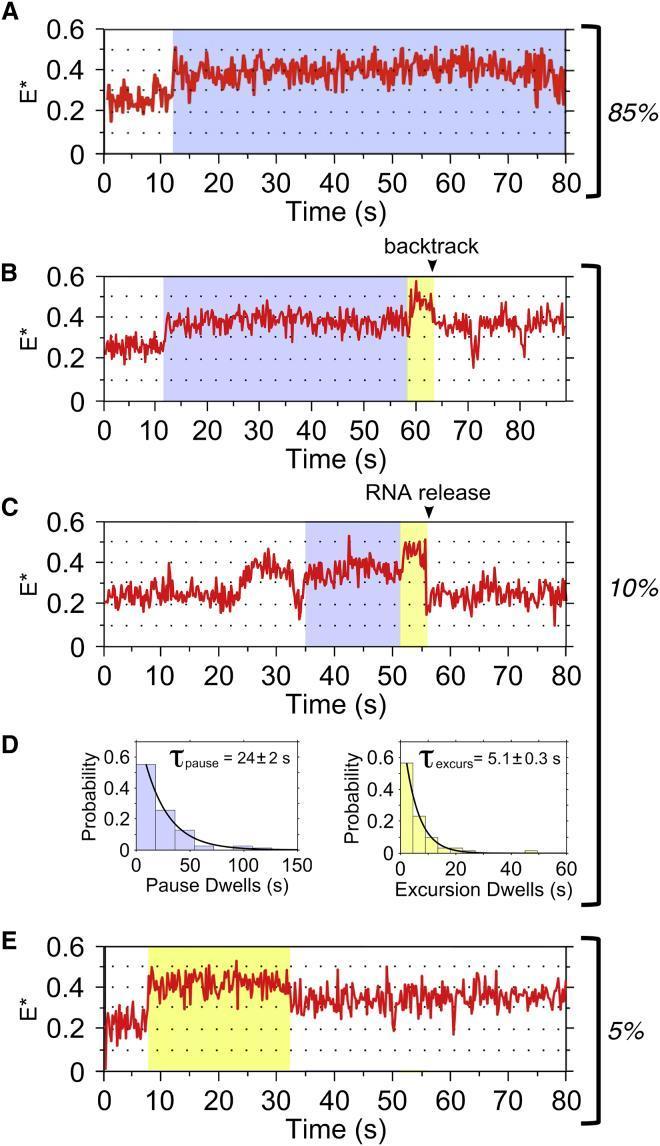
This figure presents single-molecule fluorescence resonance energy transfer (smFRET) data analyzing bacterial RNA polymerase transcription kinetics. Panels A, B, C, and E show representative time traces of FRET efficiency (E*) as a function of time (seconds), monitoring DNA scrunching during initial transcription. A baseline state (E* ~0.22) represents the open promoter complex (RPo). In Trace A (85% of cases), E* increases to a stable scrunched state (~0.37). Traces B and C (10%) demonstrate pausing at E* ~0.37 (blue shaded area) before a transient excursion to a higher FRET state (~0.45, yellow shaded area), assigned to a 7-nt RNA complex. Trace B shows 'backtracking' to the 0.37 state, while Trace C shows 'RNA release' back to the RPo baseline. Trace E (5%) shows a direct transition to the 0.45 state. Panel D contains two dwell-time histograms with single-exponential fits. The left histogram quantifies the paused state duration (τpause = 24 ± 2 s), and the right histogram quantifies the excursion state duration (τexcurs = 5.1 ± 0.3 s). The data illustrates the biophysical mechanism of transcriptional pausing and backtracking regulated by the σ3.2 finger during RNA synthesis.
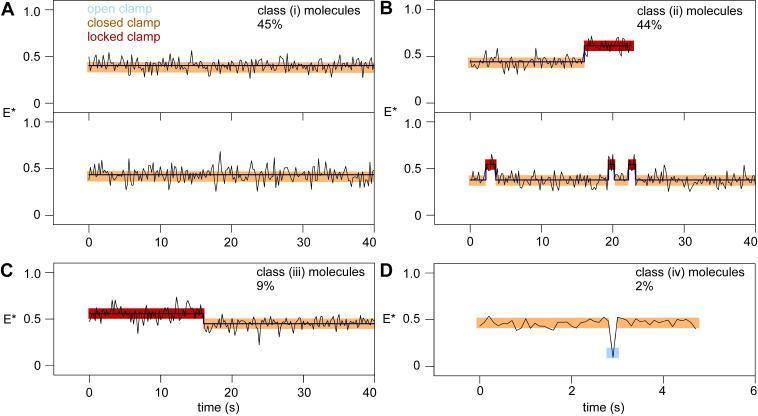
This figure presents single-molecule fluorescence resonance energy transfer (smFRET) time trajectories of RNA polymerase (RNAP) clamp dynamics during promoter binding and unwinding. The data is categorized into four classes based on the E* (apparent FRET efficiency) trajectories, which serve as a proxy for clamp conformational states. Class I (45%) shows a stable closed-clamp state (E* ≈ 0.40, highlighted in orange). Class II (44%) demonstrates a transition from a closed-clamp state to a higher E* 'locked-clamp' state (E* ≈ 0.48, highlighted in red). Class III (9%) begins in a locked-clamp state and reverts to a closed-clamp state. Class IV (2%) is rare, showing fluctuations between closed and 'open-clamp' states (E* ≈ 0.20, highlighted in cyan). The trajectories were analyzed using a Hidden Markov Model (HMM), with colored bands representing distinct structural states. This visualization illustrates the 'bind-unwind-load-and-lock' mechanism of bacterial transcription initiation, emphasizing that the RNAP clamp remains closed or locked throughout the promoter unwinding process.
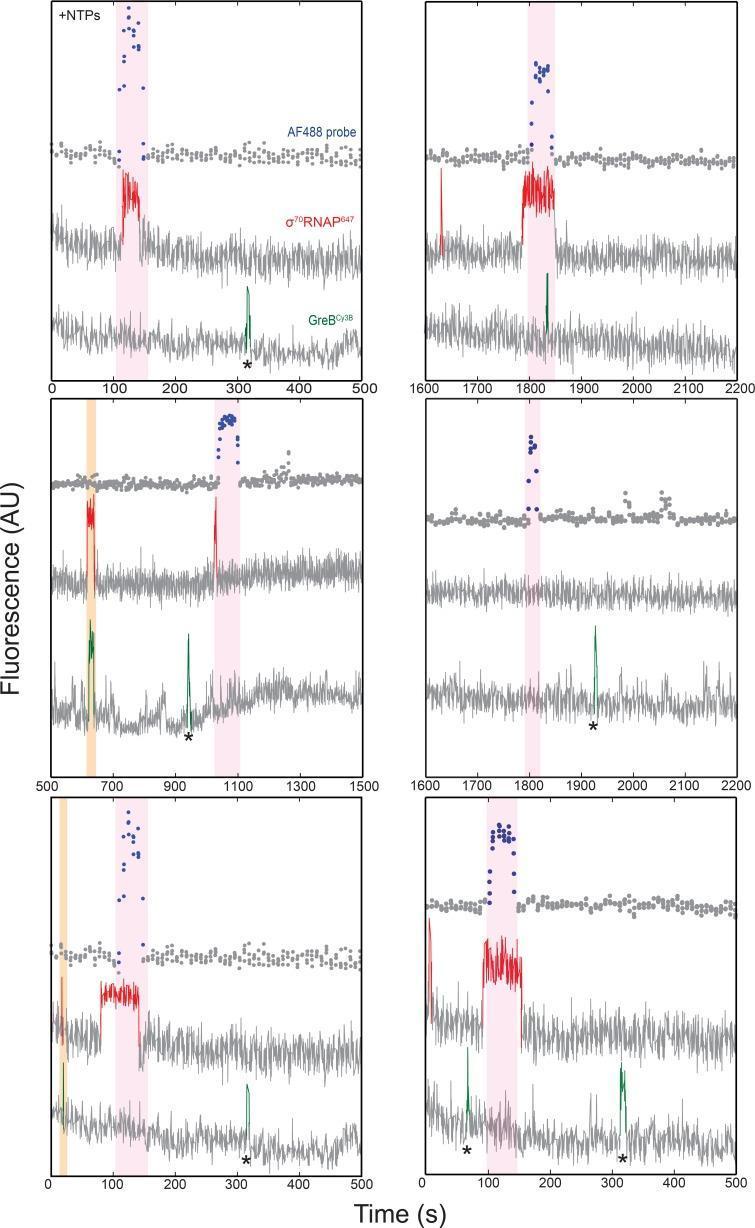
This scientific visualization presents fluorescence intensity records from single-molecule CoSMoS (Colocalization Single-Molecule Spectroscopy) experiments, used to study transcription initiation mechanisms at the rRNA promoter rrnB P1. The image contains six separate panels, each plotting fluorescence in Arbitrary Units (AU) over time in seconds (s). Within each panel, three distinct signal traces are vertically stacked: 1. Top (Grey): AF488-oligo probe signal, indicating transcript hybridization. 2. Middle (Red): σ70RNAP647 signal, indicating RNA polymerase holoenzyme presence at the DNA template. 3. Bottom (Green): GreBCy3B signal, indicating the presence of the transcript cleavage factor GreB. Two types of molecular interactions are highlighted with colored vertical bars: - Pink bars indicate transcription initiation events, characterized by a persistent increase in the red σ70RNAP647 trace followed by a spike in the top grey AF488 probe trace (successful transcription). - Orange bars indicate co-localization events where σ70RNAP647 and GreBCy3B arrive and depart simultaneously from the DNA, representing the formation of a polymerase-GreB complex that fails to initiate transcription (inhibitory interaction). These records demonstrate how GreB binding to the RNAP holoenzyme before DNA association introduces a barrier to initiation, effectively repressing rRNA synthesis.
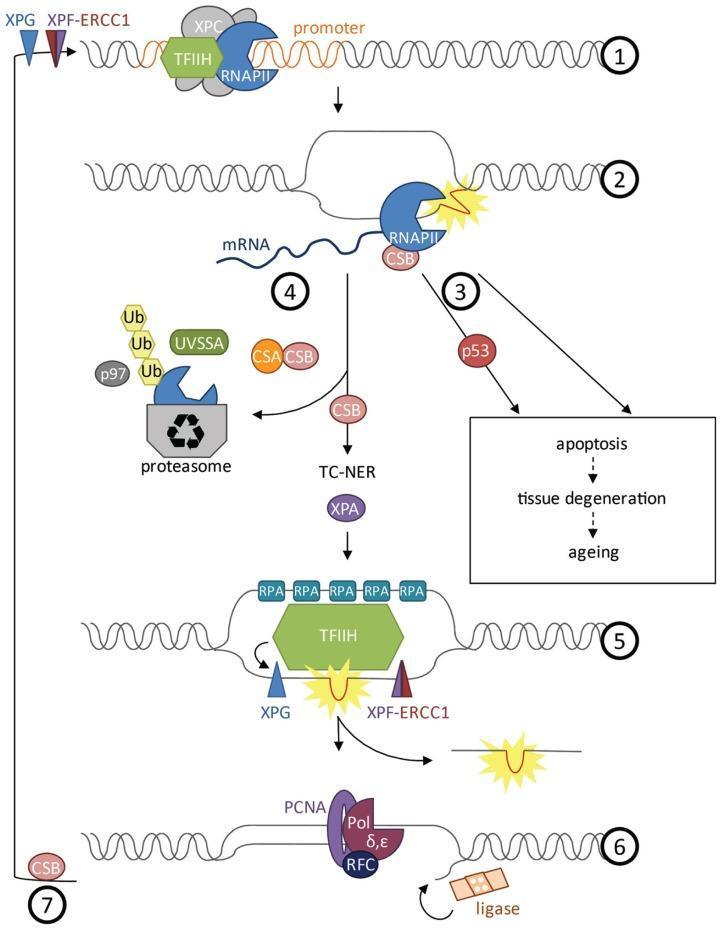
A detailed molecular pathophysiology diagram illustrating the Transcription-Coupled Nucleotide Excision Repair (TC-NER) pathway in human cells. The seven-step flowchart depicts the cellular response to DNA damage during transcription. (1) Initiation: RNA Polymerase II (RNAPII), TFIIH, and XPC assemble at the promoter. (2) Elongation and Stall: RNAPII and CSB encounter a DNA lesion (yellow starburst). (3) Signaling: Stalled polymerase triggers p53-dependent or independent apoptosis, contributing to aging and tissue degeneration. (4) Preparation for Repair: RNAPII undergoes polyubiquitylation (Ub) involving UVSSA and p97, leading to its degradation by the proteasome to clear the site. (5) Excision: TFIIH unwinds the DNA helix while RPA coats single-stranded segments. Endonucleases XPG and XPF-ERCC1 perform dual incisions to remove the damaged oligonucleotide. (6) Resynthesis: DNA polymerases delta/epsilon (Pol δ,ε), aided by PCNA and RFC, fill the gap, and DNA ligase seals the remaining nick. (7) Restoration: Re-initiation of transcription following successful repair. This diagram serves as an educational tool for genetics and molecular oncology, focusing on DNA maintenance mechanisms.
translation ribosome tRNA aminoacyl peptidyl elongation steps
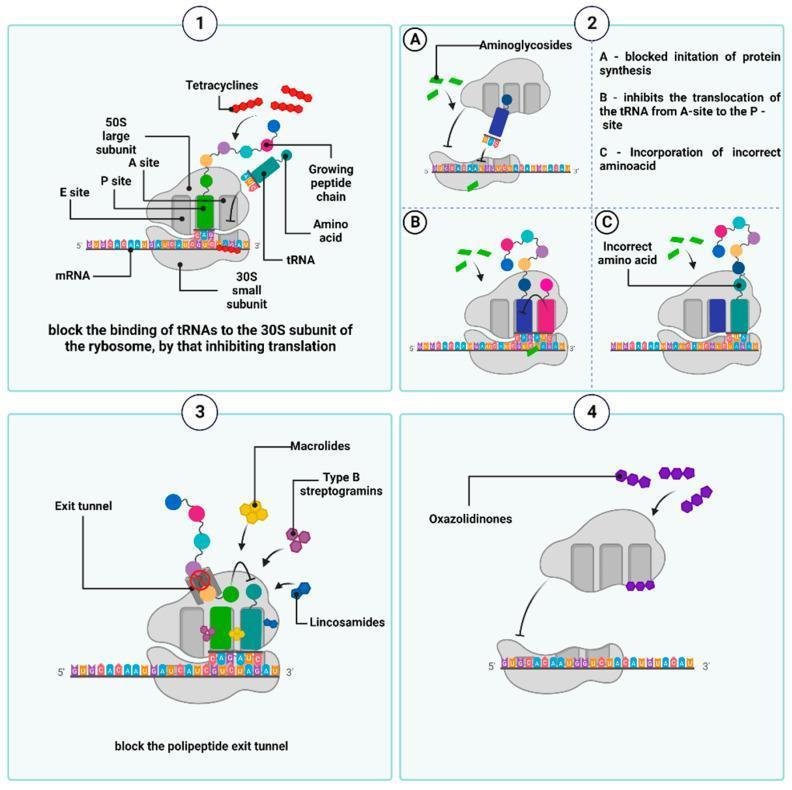
Educational pathophysiology diagram illustrating the mechanisms of action for four classes of protein synthesis inhibitors acting on the bacterial ribosome. The diagram is divided into four numbered quadrants: (1) Tetracyclines, represented by red linked circles, are shown binding to the 30S small subunit, which physically blocks aminoacyl-tRNA from binding to the A-site, thereby inhibiting translation. (2) Aminoglycosides, depicted as green bars, demonstrate three distinct mechanisms: (A) blocking the initiation of protein synthesis, (B) inhibiting tRNA translocation from the A-site to the P-site, and (C) causing mRNA misreading, leading to the incorporation of incorrect amino acids. (3) Macrolides, Lincosamides, and Type B Streptogramins are shown blocking the polypeptide exit tunnel of the 50S large subunit, preventing the extension of the growing peptide chain. (4) Oxazolidinones, shown as purple circles, bind to the 50S subunit at the peptidyl transferase center, inhibiting the formation of the 70S initiation complex and blocking early translation steps. Each panel illustrates key components including the 50S and 30S subunits, mRNA, tRNA, and the growing peptide chain.
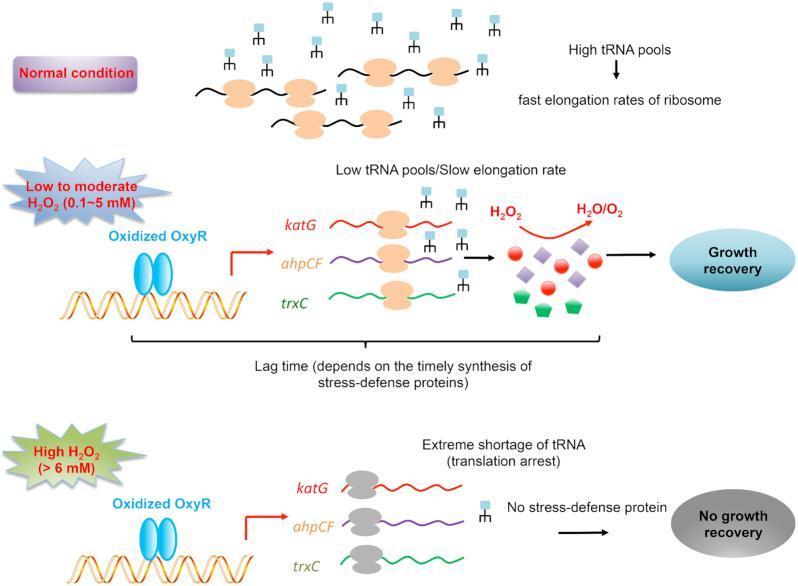
This pathophysiology diagram illustrates the impact of oxidative stress (H2O2) on the translational elongation rate in Escherichia coli, highlighting the role of tRNA pools. The schematic is divided into three tiers: 1) Normal condition: High tRNA pools facilitate fast ribosome elongation rates on mRNA. 2) Low to moderate H2O2 (0.1-5 mM): Oxidized OxyR transcription factor activates stress-defense genes (katG, ahpCF, trxC). However, low tRNA availability causes slow elongation, leading to a lag time before stress-defense proteins accumulate to neutralize H2O2, eventually allowing growth recovery. 3) High H2O2 (>6 mM): Despite OxyR activation, an extreme tRNA shortage leads to translation arrest. Ribosomes (depicted in gray) fail to synthesize stress-defense proteins, resulting in no growth recovery and cell death. The diagram teaches the concept of translational elongation as a physiological bottleneck during oxidative stress response, where the timely synthesis of protective enzymes is critical for maintaining redox homeostasis and bacterial survival.
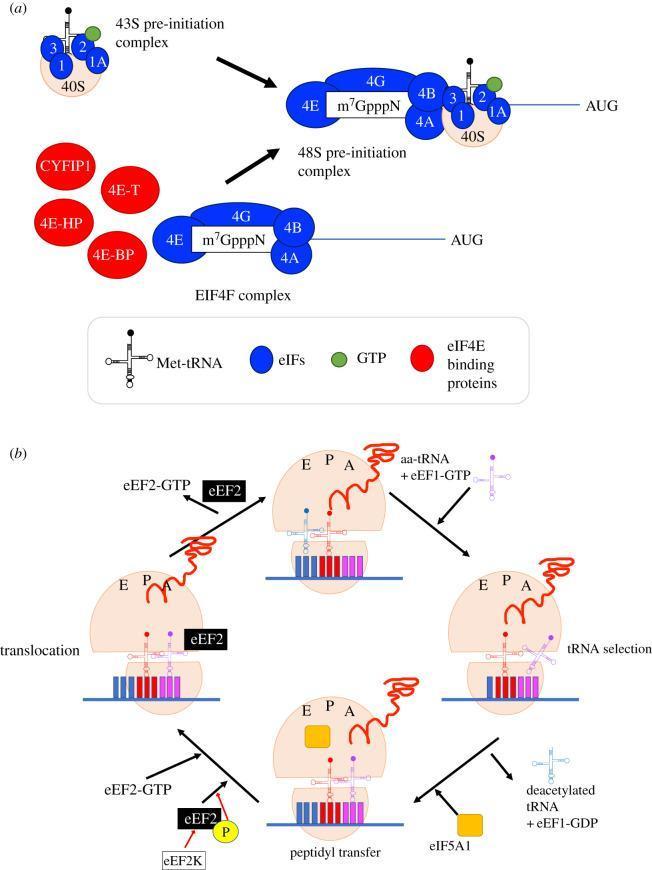
This pathophysiology diagram illustrates the eukaryotic translation process, divided into initiation and elongation phases. Panel (a) focuses on translation initiation, showing the assembly of the 43S pre-initiation complex (comprising the 40S subunit, Met-tRNA, and eIFs 1, 1A, 2, and 3) and the eIF4F complex (eIF4E, 4G, 4A, and 4B) at the mRNA 5' cap (m7GpppN). These components converge to form the 48S pre-initiation complex, which scans for the AUG start codon. Regulatory eIF4E-binding proteins (CYFIP1, 4E-T, 4E-HP, 4E-BP) are shown as competitive inhibitors. Panel (b) depicts the elongation cycle: tRNA selection, where an aa-tRNA enters the A site via eEF1-GTP; peptidyl transfer, involving eIF5A1 and the transfer of the polypeptide chain; and translocation, mediated by eEF2-GTP. The diagram highlights the movement of tRNAs through the ribosomal E, P, and A sites. Regulatory phosphorylation of eEF2 by eEF2K is also shown, illustrating translational control mechanisms relevant to cellular proteostasis.
Transcription and Translation: Prokaryotes vs. Eukaryotes
TRANSCRIPTION
Prokaryotic Transcription
- A single DNA-dependent RNA polymerase handles all RNA synthesis (mRNA, rRNA, tRNA).
- The holoenzyme consists of a core enzyme (α₂ββ'ω subunits) plus a sigma (σ) factor.
- The sigma factor recognizes specific promoter sequences (consensus sequences at -10 and -35 upstream of the start site) and binds the polymerase to initiate transcription. Different sigma factors coordinate transcription under special conditions (heat shock, starvation, sporulation).
- Rifampin (antibiotic) inhibits bacterial RNA polymerase and is used to treat tuberculosis.
- Initiation - Sigma factor binds the promoter; RNA polymerase unwinds the DNA.
- Elongation - Ribonucleotides are added complementary to the template strand (3'→5'), synthesizing RNA in the 5'→3' direction.
- Termination - Mediated by signals in the DNA; RNA polymerase dissociates.
- mRNA is often polycistronic (one mRNA encodes multiple proteins; operons).
- No introns - the transcript is immediately ready for translation.
- No post-transcriptional modifications (no cap, no poly-A tail).
- mRNA is translated as it is being transcribed.
Eukaryotic Transcription
| Polymerase | Products | Inhibited by |
|---|---|---|
| RNA Pol I | 28S, 18S, 5.8S rRNA | - |
| RNA Pol II | mRNA (protein-coding genes), snRNA | α-amanitin (low dose) |
| RNA Pol III | tRNA, 5S rRNA | α-amanitin (high dose) |
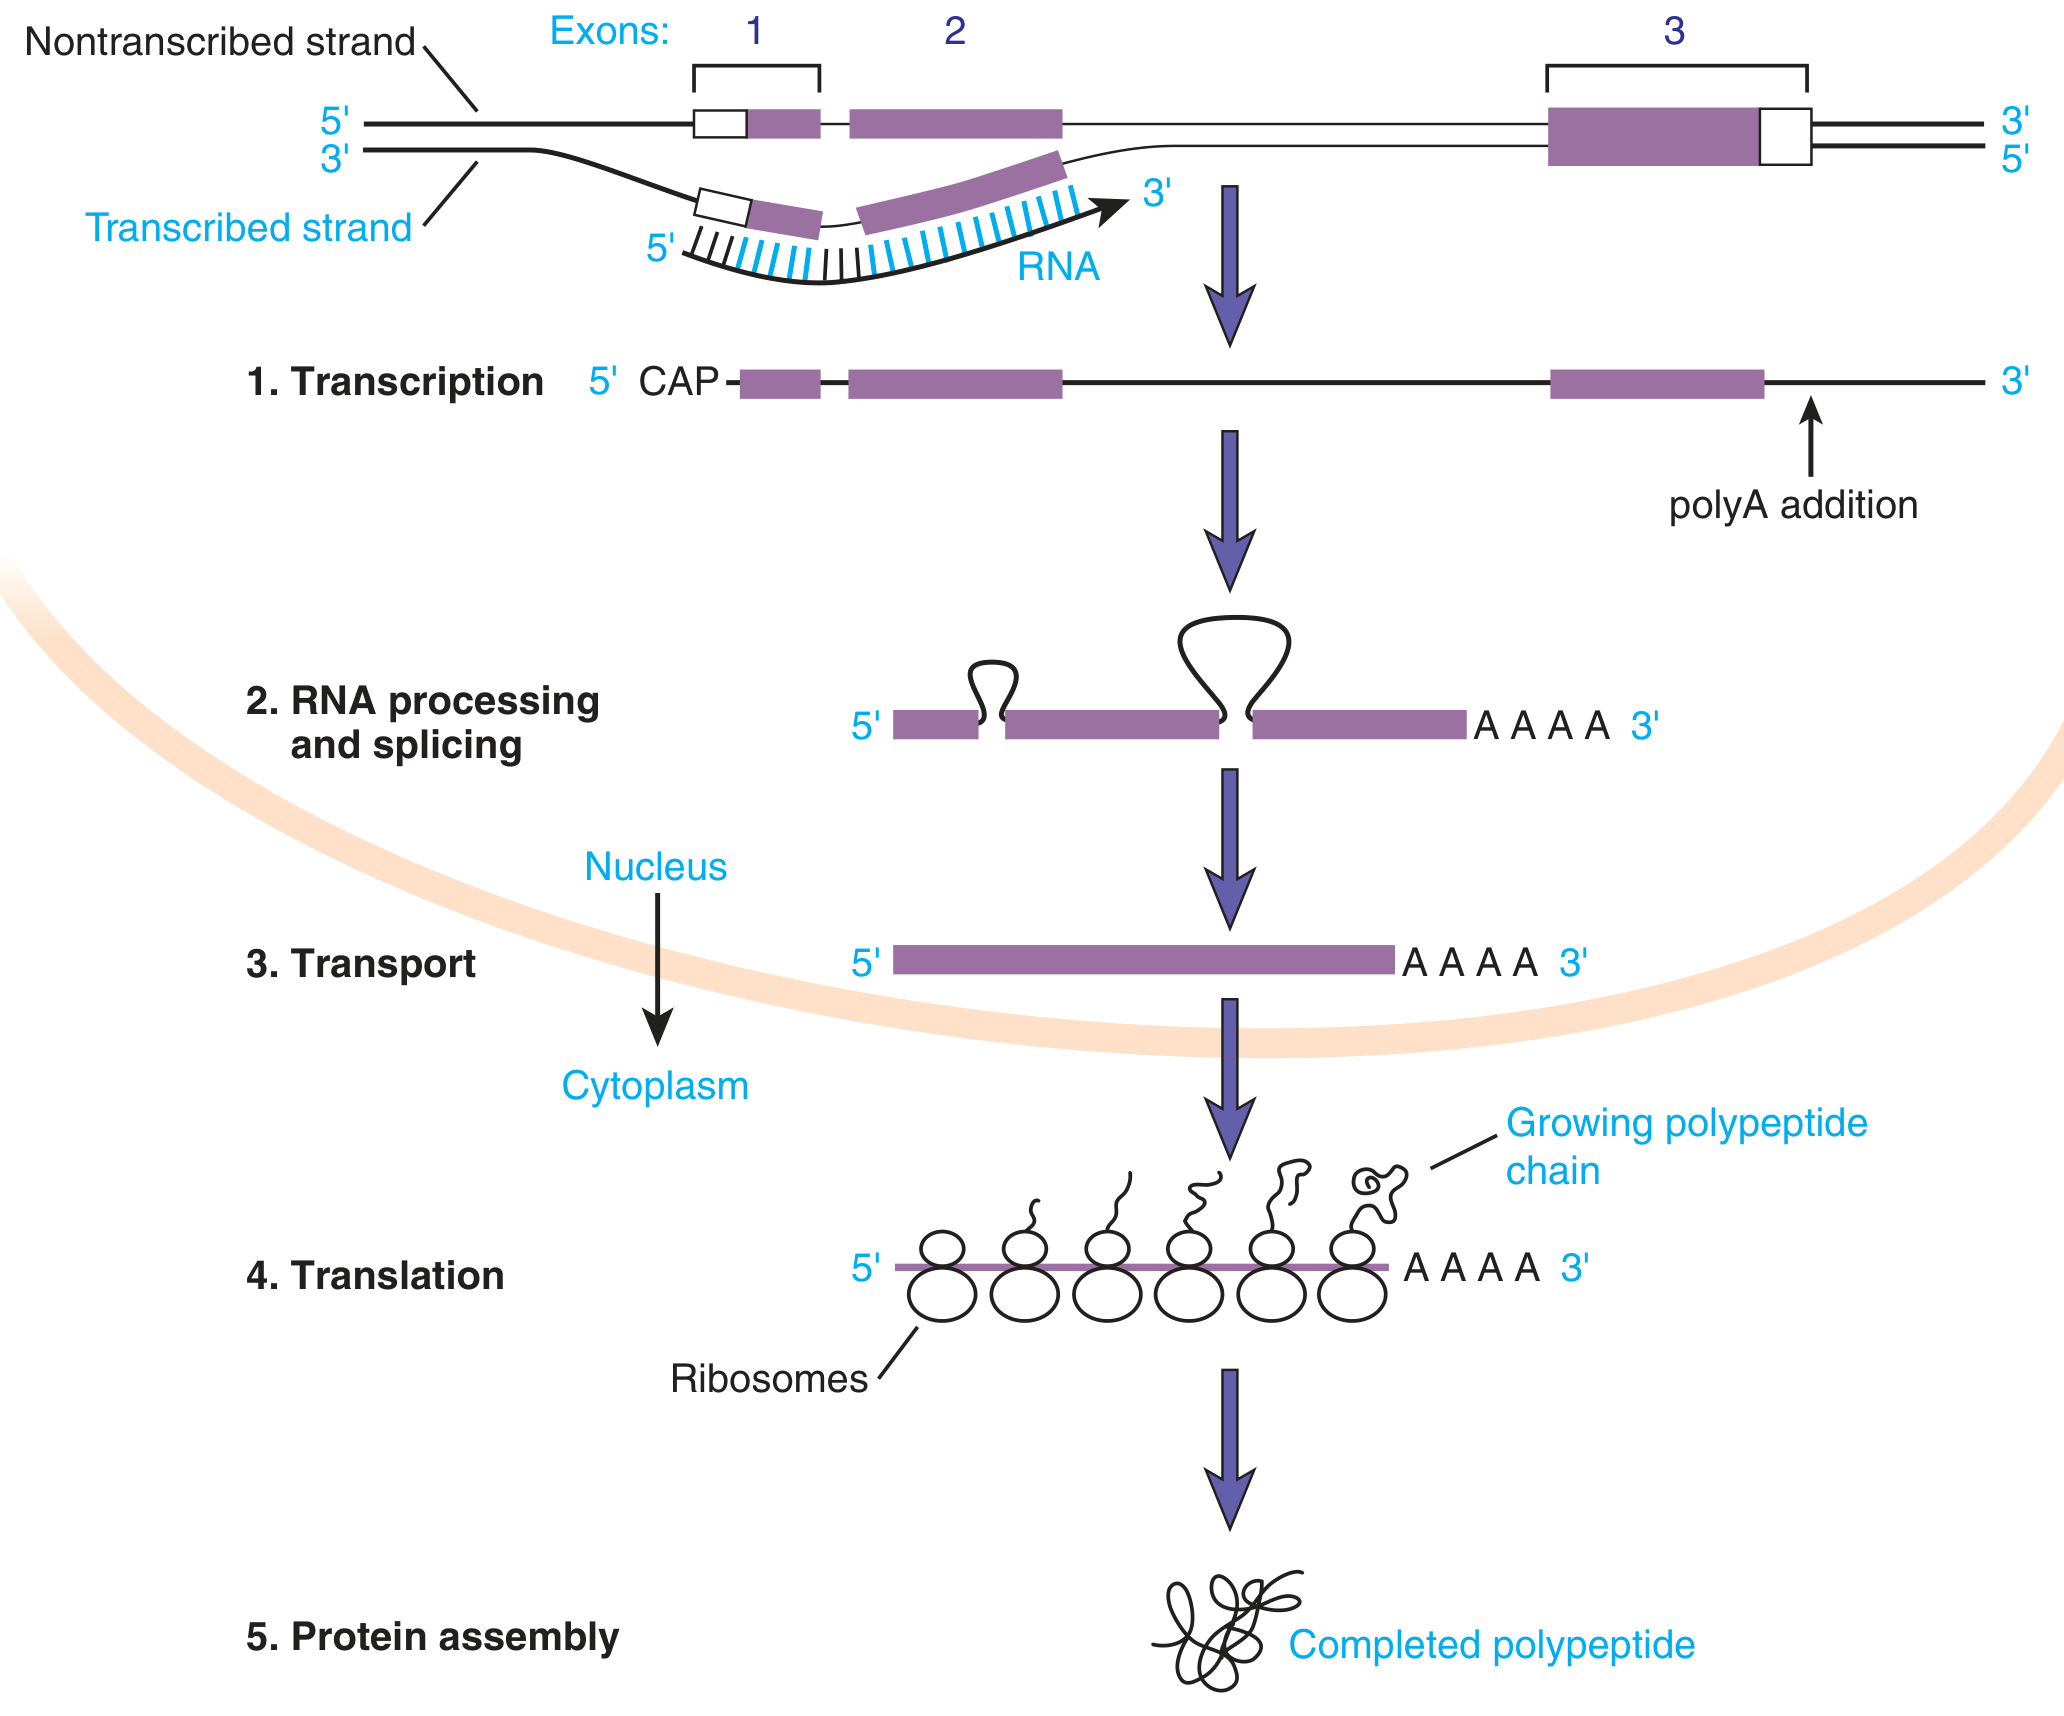
- Initiation - RNA Pol II (for mRNA) is recruited to the transcriptional start site in the 5' UTR. The nontranscribed strand (5'→3') is the sense/coding strand; the transcribed strand (3'→5') is the antisense/template strand. General transcription factors (TFIIA, B, D, etc.) form a pre-initiation complex at the TATA box (~-25 upstream).
- Elongation - RNA is synthesized 5'→3', proceeding through both exons and introns.
- Termination - Less well-defined in eukaryotes; the transcript extends beyond the coding region before processing.
| Modification | Details |
|---|---|
| 5' cap | Addition of 7-methylguanosine cap [M(7)GPPP] - protects mRNA, aids ribosome binding |
| 3' poly-A tail | Cleavage at AAUAAA signal, then ~200 adenine residues added - increases mRNA stability |
| RNA splicing | Introns are removed; exons are rejoined by the spliceosome |
- Monocistronic (one mRNA = one protein; one AUG start codon per ribosome).
- Contains 5' UTR, coding sequence, 3' UTR.
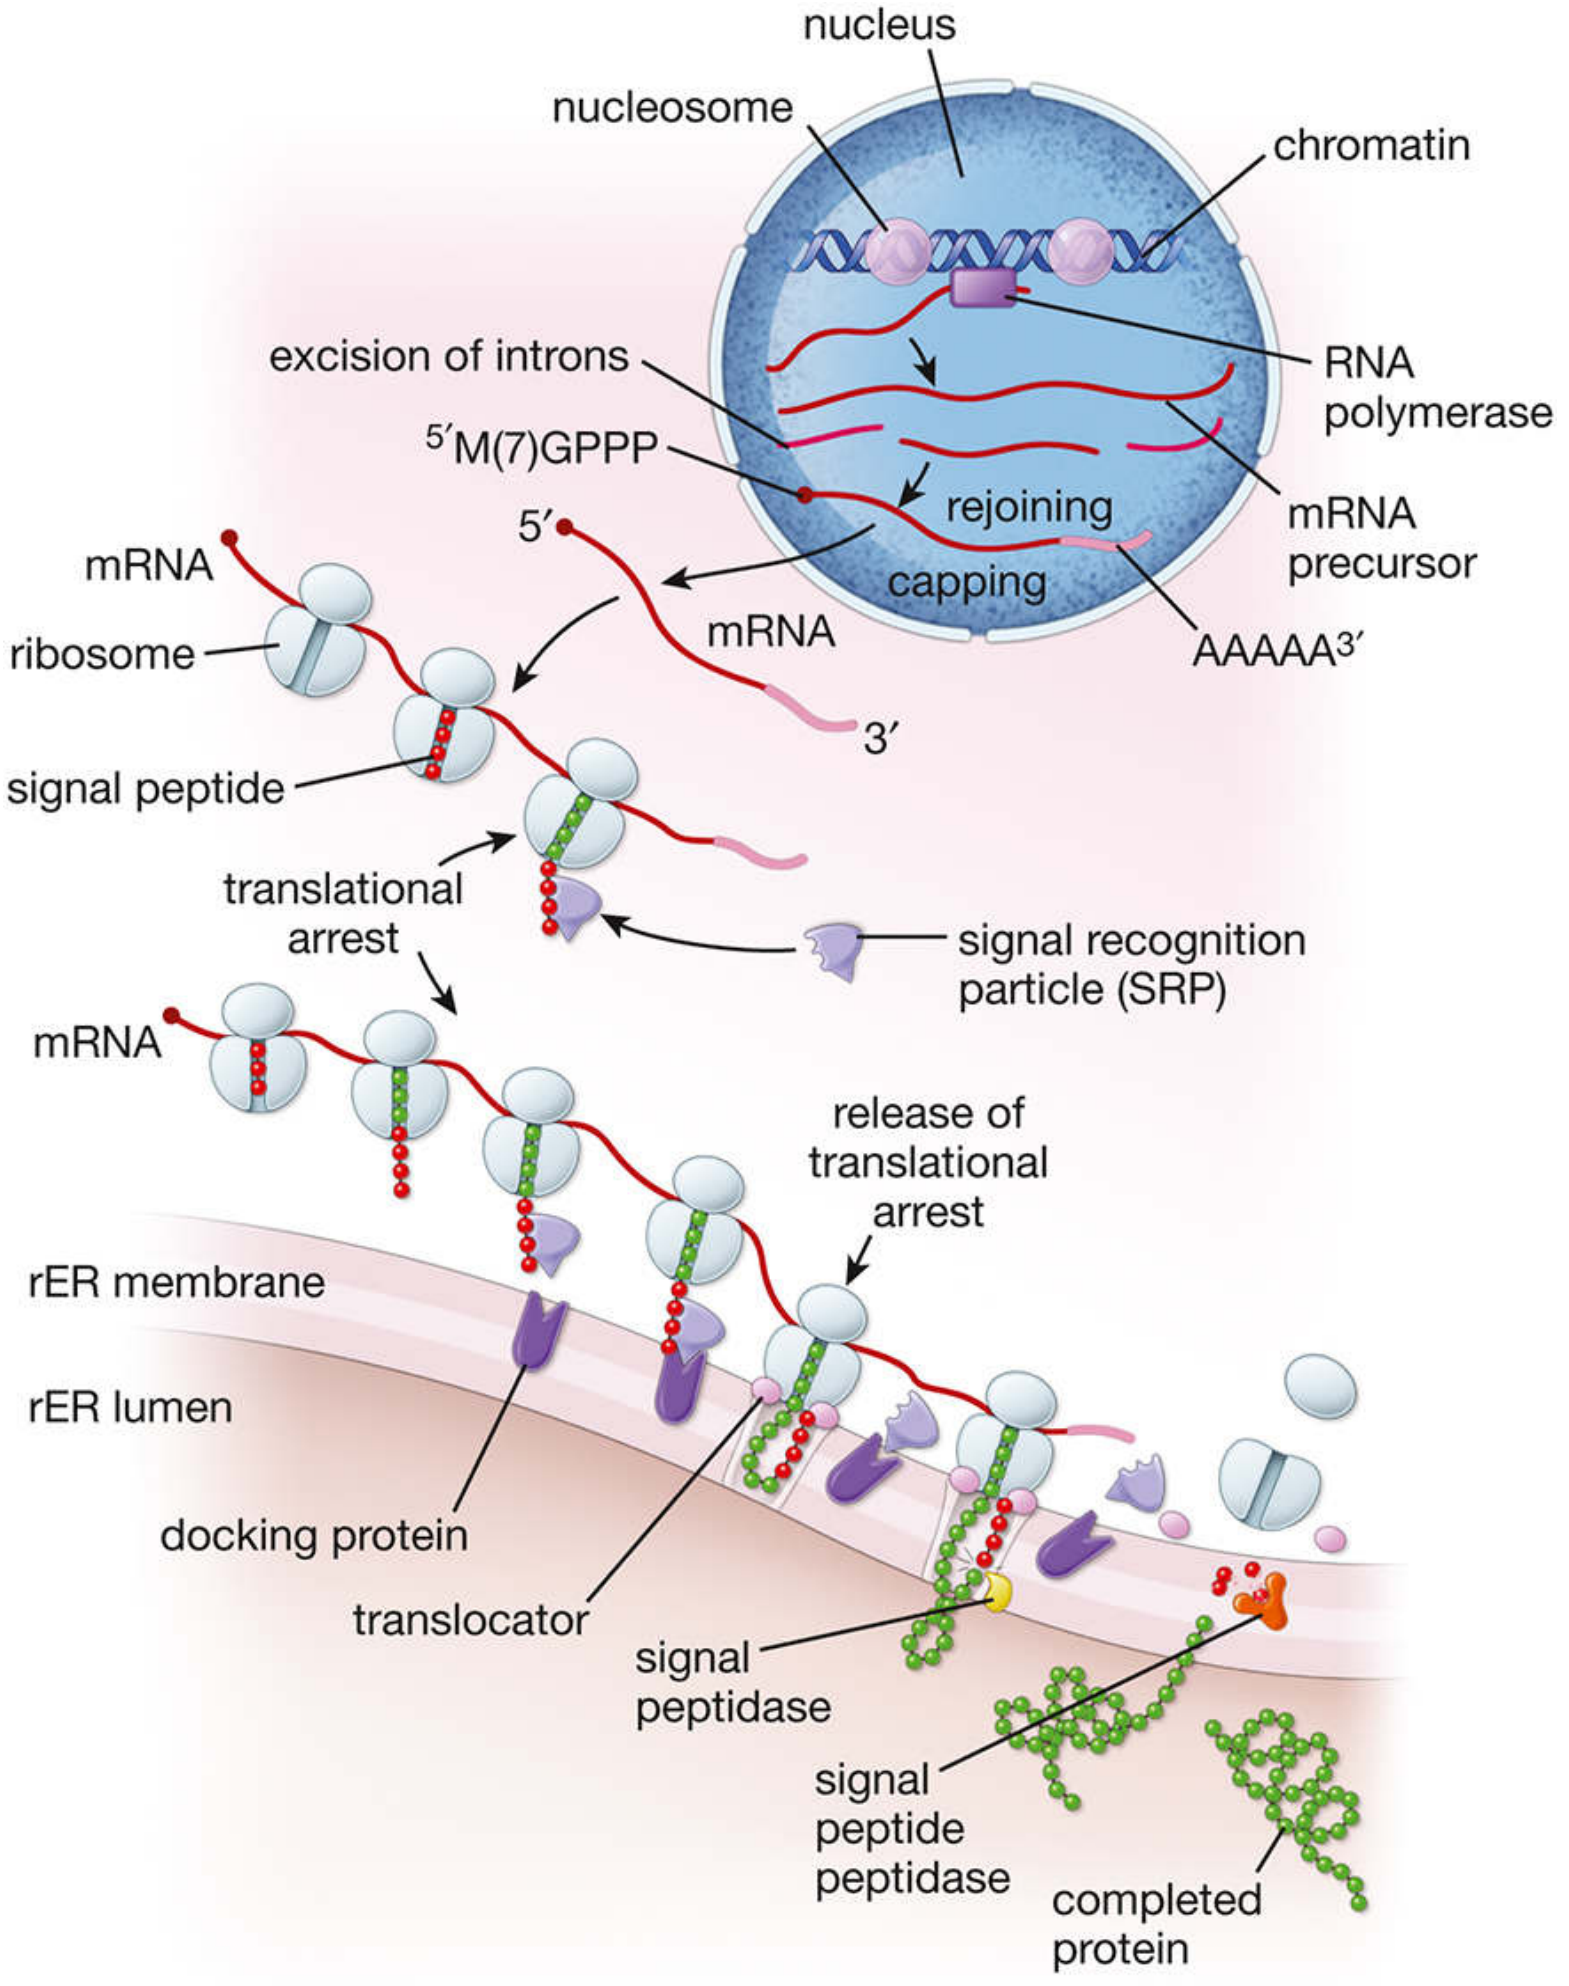
Transcription Comparison Table
| Feature | Prokaryotes | Eukaryotes |
|---|---|---|
| Location | Cytoplasm | Nucleus |
| RNA polymerase | Single (+ sigma factor) | Three (Pol I, II, III) |
| Promoter | -10 and -35 consensus | TATA box (~-25) |
| Coupling with translation | Yes (simultaneous) | No (separated by nuclear envelope) |
| Pre-mRNA processing | None | 5' cap, poly-A tail, splicing |
| Introns | Absent (mostly) | Present |
| mRNA type | Polycistronic | Monocistronic |
| Template strand direction | 3'→5' | 3'→5' |
| RNA synthesis direction | 5'→3' | 5'→3' |
TRANSLATION
The Genetic Code
- Each codon = 3 nucleotides → 4³ = 64 possible codons.
- Encodes 20 amino acids + 3 stop codons (UAA, UAG, UGA) + 1 start codon (AUG = methionine).
- The code is degenerate (redundant): most amino acids are encoded by more than one codon. This provides some protection against mutations.
- The code is non-overlapping and read in a fixed reading frame set by the AUG start codon.
Prokaryotic Translation
- 30S: 16S rRNA + ~21 proteins
- 50S: 23S + 5S rRNA + ~31 proteins
- A site (aminoacyl): incoming charged tRNA
- P site (peptidyl): tRNA carrying growing chain
- E site (exit): discharged tRNA leaves
- 30S subunit binds mRNA at the Shine-Dalgarno sequence (~5-10 nt upstream of AUG) - base-pairs with 16S rRNA.
- Special initiator tRNA: fMet-tRNA (formyl-methionine) enters the P site at the AUG start codon.
- 50S subunit joins → complete 70S initiation complex.
- Requires initiation factors: IF1, IF2 (GTP-dependent), IF3.
- Charged aminoacyl-tRNA enters the A site (via EF-Tu·GTP).
- Peptidyl transferase (catalytic activity of 23S rRNA in 50S) forms a peptide bond between the amino acid in A site and the growing chain in P site.
- Translocation - ribosome moves 3 nucleotides (one codon) along mRNA in 5'→3' direction (via EF-G·GTP). Peptidyl-tRNA shifts from A→P; empty tRNA shifts from P→E and exits.
- When a stop codon (UAA, UAG, UGA) enters the A site, release factors (RF1, RF2, RF3) bind.
- The completed polypeptide is released; the 70S complex dissociates.
- Key feature: The 70S ribosome can shuffle along mRNA to the next AUG start codon - allowing translation of polycistronic mRNAs.
Eukaryotic Translation
- 40S: 18S rRNA
- 60S: 28S + 5.8S + 5S rRNA
- More complex, involving >12 eukaryotic initiation factors (eIFs).
- The 43S pre-initiation complex (40S + Met-tRNA_Met + eIF1, 1A, 2·GTP, 3) assembles.
- The eIF4F complex (eIF4E + eIF4G + eIF4A) binds the 5' m7G cap of mRNA.
- The 43S complex loads onto mRNA and scans in 5'→3' direction until it finds the AUG in a Kozak context (GCC(A/G)CCAUGG).
- GTP hydrolysis leads to 60S joining → 80S initiation complex; Met-tRNA_Met occupies the P site.
- eIF4E-binding proteins (4E-BPs) can inhibit translation by sequestering eIF4E.
- Same basic mechanism as prokaryotes.
- eEF1 (GTP) delivers aminoacyl-tRNA to A site.
- Peptidyl transferase in 60S subunit forms peptide bond.
- eEF2 (GTP) drives translocation.
- Stop codon recognized by eRF1 (mimics tRNA; recognizes all 3 stop codons).
- eRF3 (GTP) facilitates polypeptide release.
- Eukaryotic ribosomes do NOT shuffle to the next AUG - each mRNA is monocistronic.
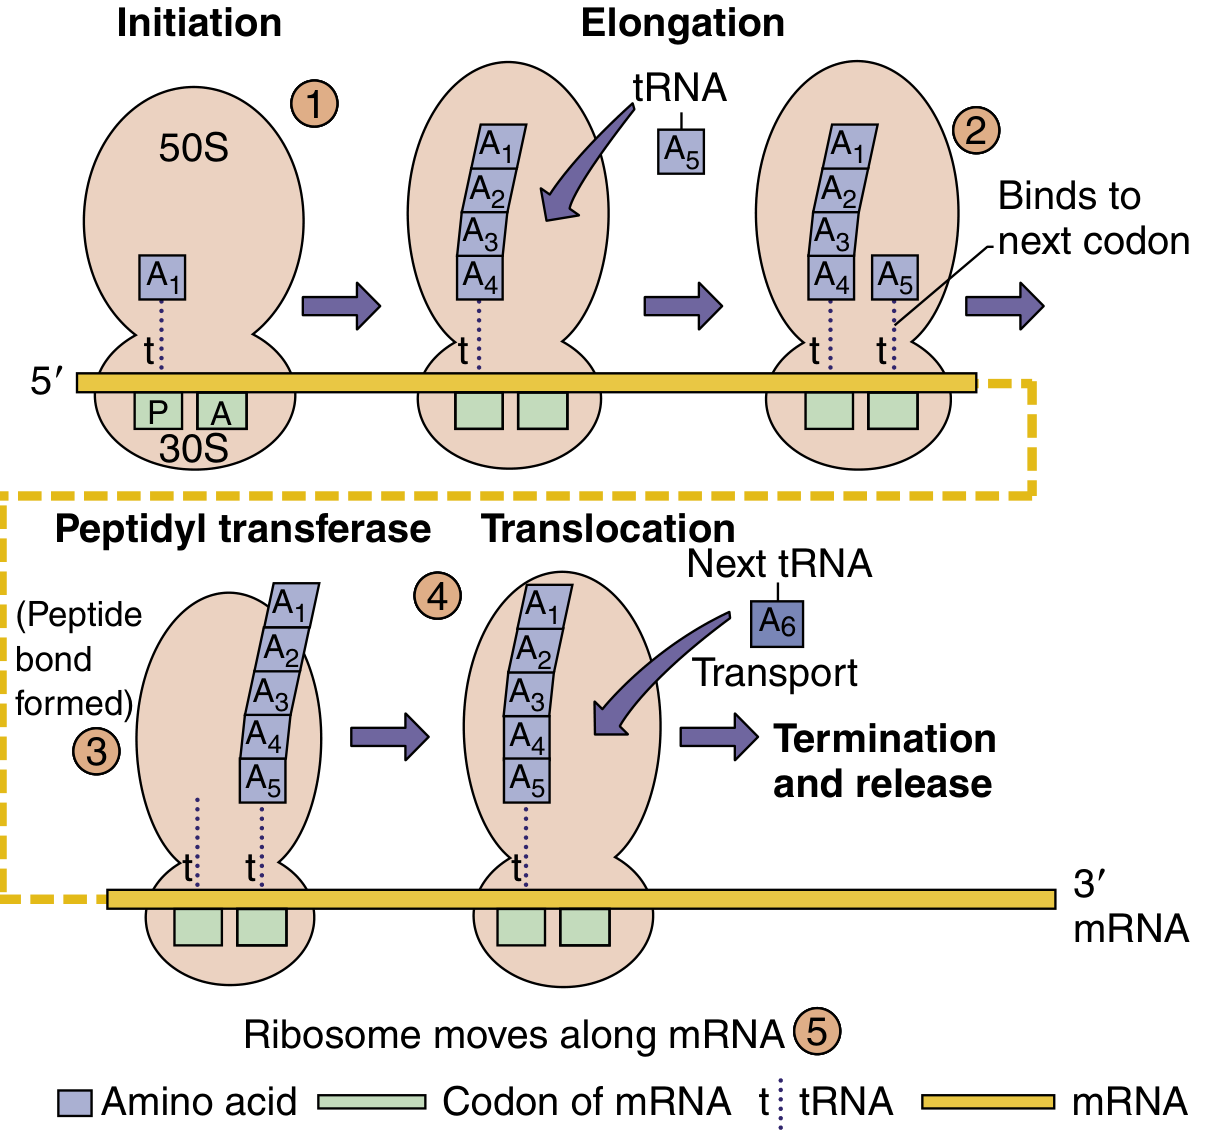
Translation Comparison Table
| Feature | Prokaryotes | Eukaryotes |
|---|---|---|
| Ribosome size | 70S (30S + 50S) | 80S (40S + 60S) |
| Initiator tRNA | fMet-tRNA (formyl-methionine) | Met-tRNA_Met (unformylated) |
| mRNA recognition | Shine-Dalgarno sequence | 5' cap scanning + Kozak sequence |
| Initiation factors | IF1, IF2, IF3 | >12 eIFs (eIF1, 1A, 2, 3, 4E, 4G, 4A, 5, 5B...) |
| mRNA type | Polycistronic | Monocistronic |
| Coupling with transcription | Yes | No |
| Location | Cytoplasm | Cytoplasm (free or rER-bound) |
| Elongation factors | EF-Tu, EF-G | eEF1, eEF2 |
| Release factors | RF1, RF2, RF3 | eRF1, eRF3 |
| A, P, E sites | Yes | Yes |
ANTIBIOTICS TARGETING TRANSLATION
| Antibiotic | Subunit Target | Mechanism |
|---|---|---|
| Aminoglycosides (streptomycin) | 30S | Causes mRNA misreading; blocks initiation; inhibits translocation |
| Tetracyclines | 30S | Block aminoacyl-tRNA binding to A site |
| Macrolides (erythromycin) | 50S | Block peptide exit tunnel; inhibit translocation |
| Lincosamides (clindamycin) | 50S | Block peptide exit tunnel |
| Chloramphenicol | 50S | Inhibits peptidyl transferase |
| Linezolid (oxazolidinone) | 50S | Inhibits 70S initiation complex formation |
- 30S: Aminoglycosides, Tetracyclines
- 50S: Chloramphenicol, Erythromycin (macrolides), Lincosamides (clindamycin)
KEY DIFFERENCES - QUICK SUMMARY
| Process | Prokaryote | Eukaryote |
|---|---|---|
| Transcription location | Cytoplasm | Nucleus |
| Translation location | Cytoplasm | Cytoplasm |
| Coupling | Transcription + translation coupled | Separated in space and time |
| mRNA processing | None | 5' cap, poly-A, splicing |
| Ribosome | 70S | 80S |
| Initiator amino acid | fMet | Met |
| mRNA | Polycistronic | Monocistronic |
| Transcription inhibitor | Rifampin | α-amanitin |
- Thompson & Thompson Genetics and Genomics in Medicine, 9th ed., pp. 52-53
- Medical Microbiology 9e, pp. 155-156
- Histology: A Text and Atlas with Correlated Cell and Molecular Biology, pp. 174-175
Lac operon and tryptophan operon
The Lac Operon and the Tryptophan Operon
WHAT IS AN OPERON?
- Promoter (P) - where RNA polymerase binds
- Operator (O) - a DNA sequence where a repressor can bind to block transcription
- Structural genes - the actual protein-coding sequences
- Regulatory gene (I) - encodes the repressor protein (often separately located)
1. THE LAC OPERON
Concept: Inducible operon (negative + positive control)
Structural Genes of the Lac Operon
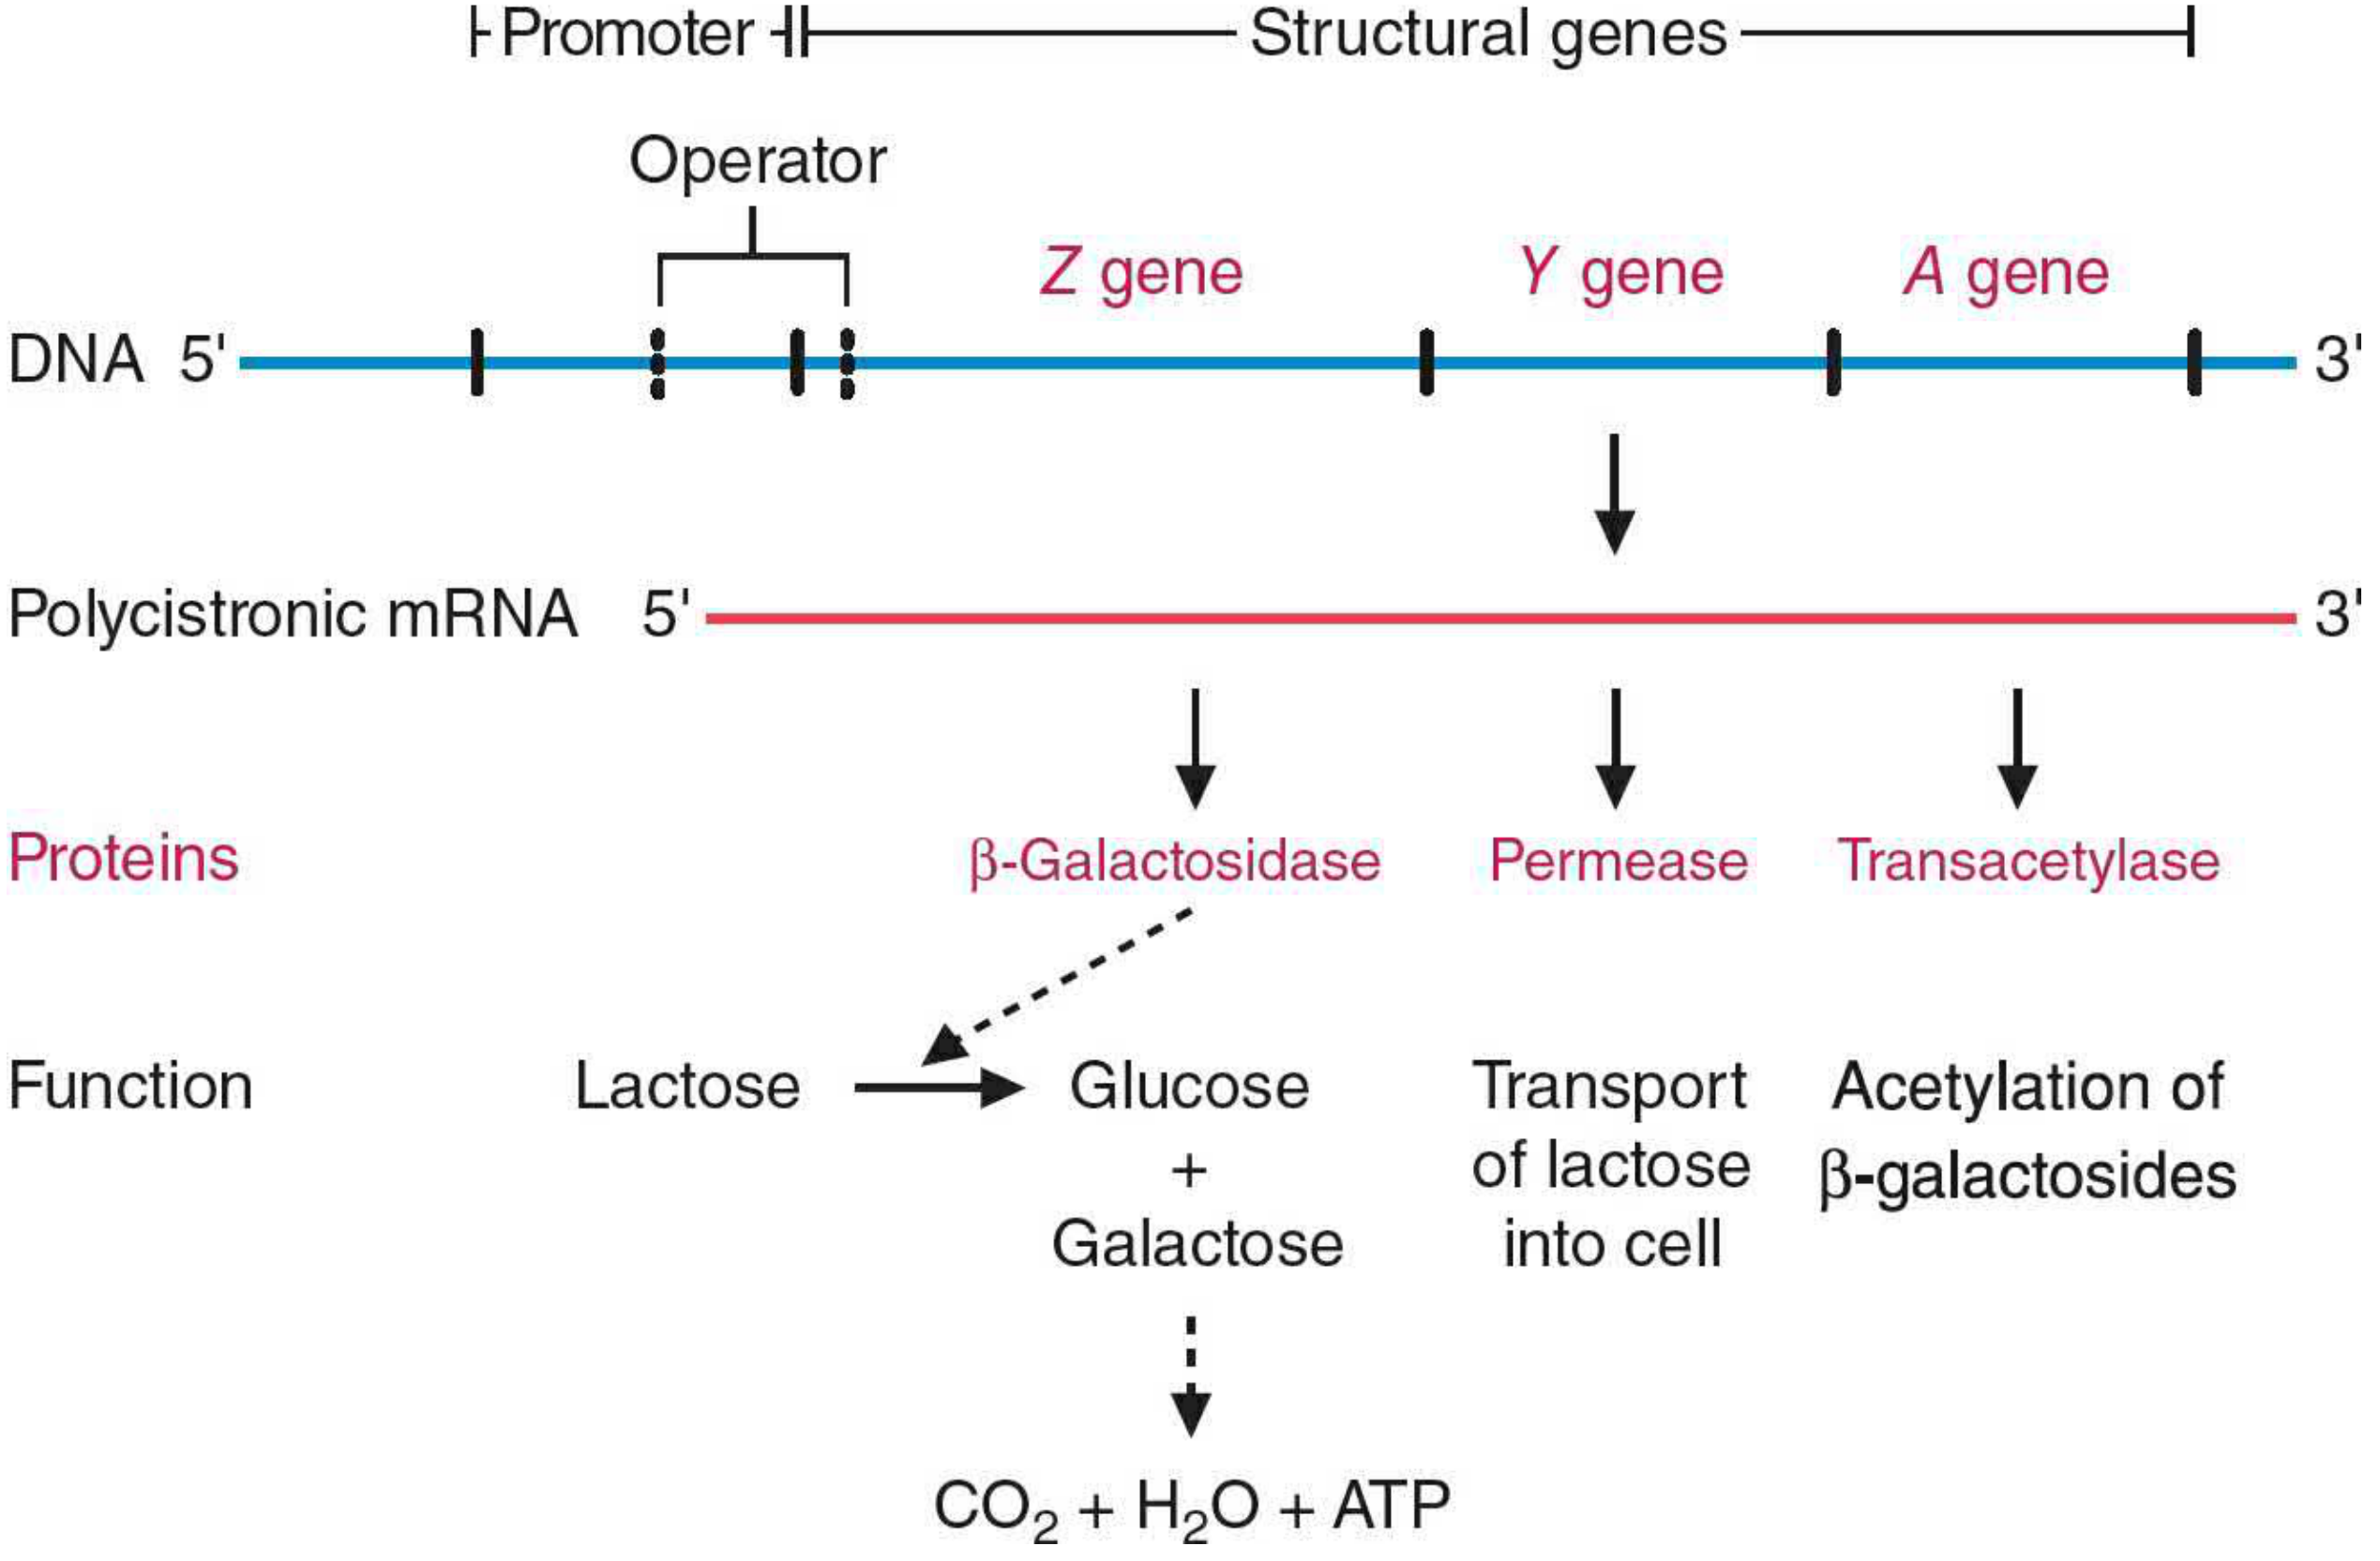
| Gene | Protein | Function |
|---|---|---|
| lacZ | β-galactosidase | Hydrolyzes lactose → glucose + galactose. Also converts lactose → allolactose (the true inducer) |
| lacY | Permease | Membrane transporter that brings lactose into the cell |
| lacA | Transacetylase | Acetylates β-galactosides (exact role in lactose metabolism unclear) |
| lacI | Lac repressor | Regulatory gene (independently transcribed); produces the repressor protein |
Negative Control: Repressor Mechanism
- Without lactose: Repressor binds operator → no transcription (operon OFF).
- With lactose: Lactose is converted to allolactose (a structural isomer) by β-galactosidase. Allolactose is the true inducer - it binds the repressor, causing a conformational change that makes the repressor unable to bind the operator. RNA polymerase can now bind the promoter and transcribe the structural genes → enzymes are produced.
- Basal (leaky) expression always occurs at very low levels - this ensures a few molecules of permease are always present, allowing the cell to take up lactose when it first appears.
Positive Control: Catabolite Repression (CAP/CRP system)
- When glucose is high → cAMP is low → CAP (Catabolite Activator Protein, also called CRP) is inactive → no stimulation of operon → operon OFF.
- When glucose is low → cAMP is high → cAMP binds to CAP → cAMP-CAP complex binds to the promoter region upstream of the operator → enhances RNA polymerase binding → operon ON.
- Lactose present (negative control relieved - repressor inactivated)
- Glucose absent (positive control activated - cAMP-CAP complex bound)
Lac Operon - All States Illustrated
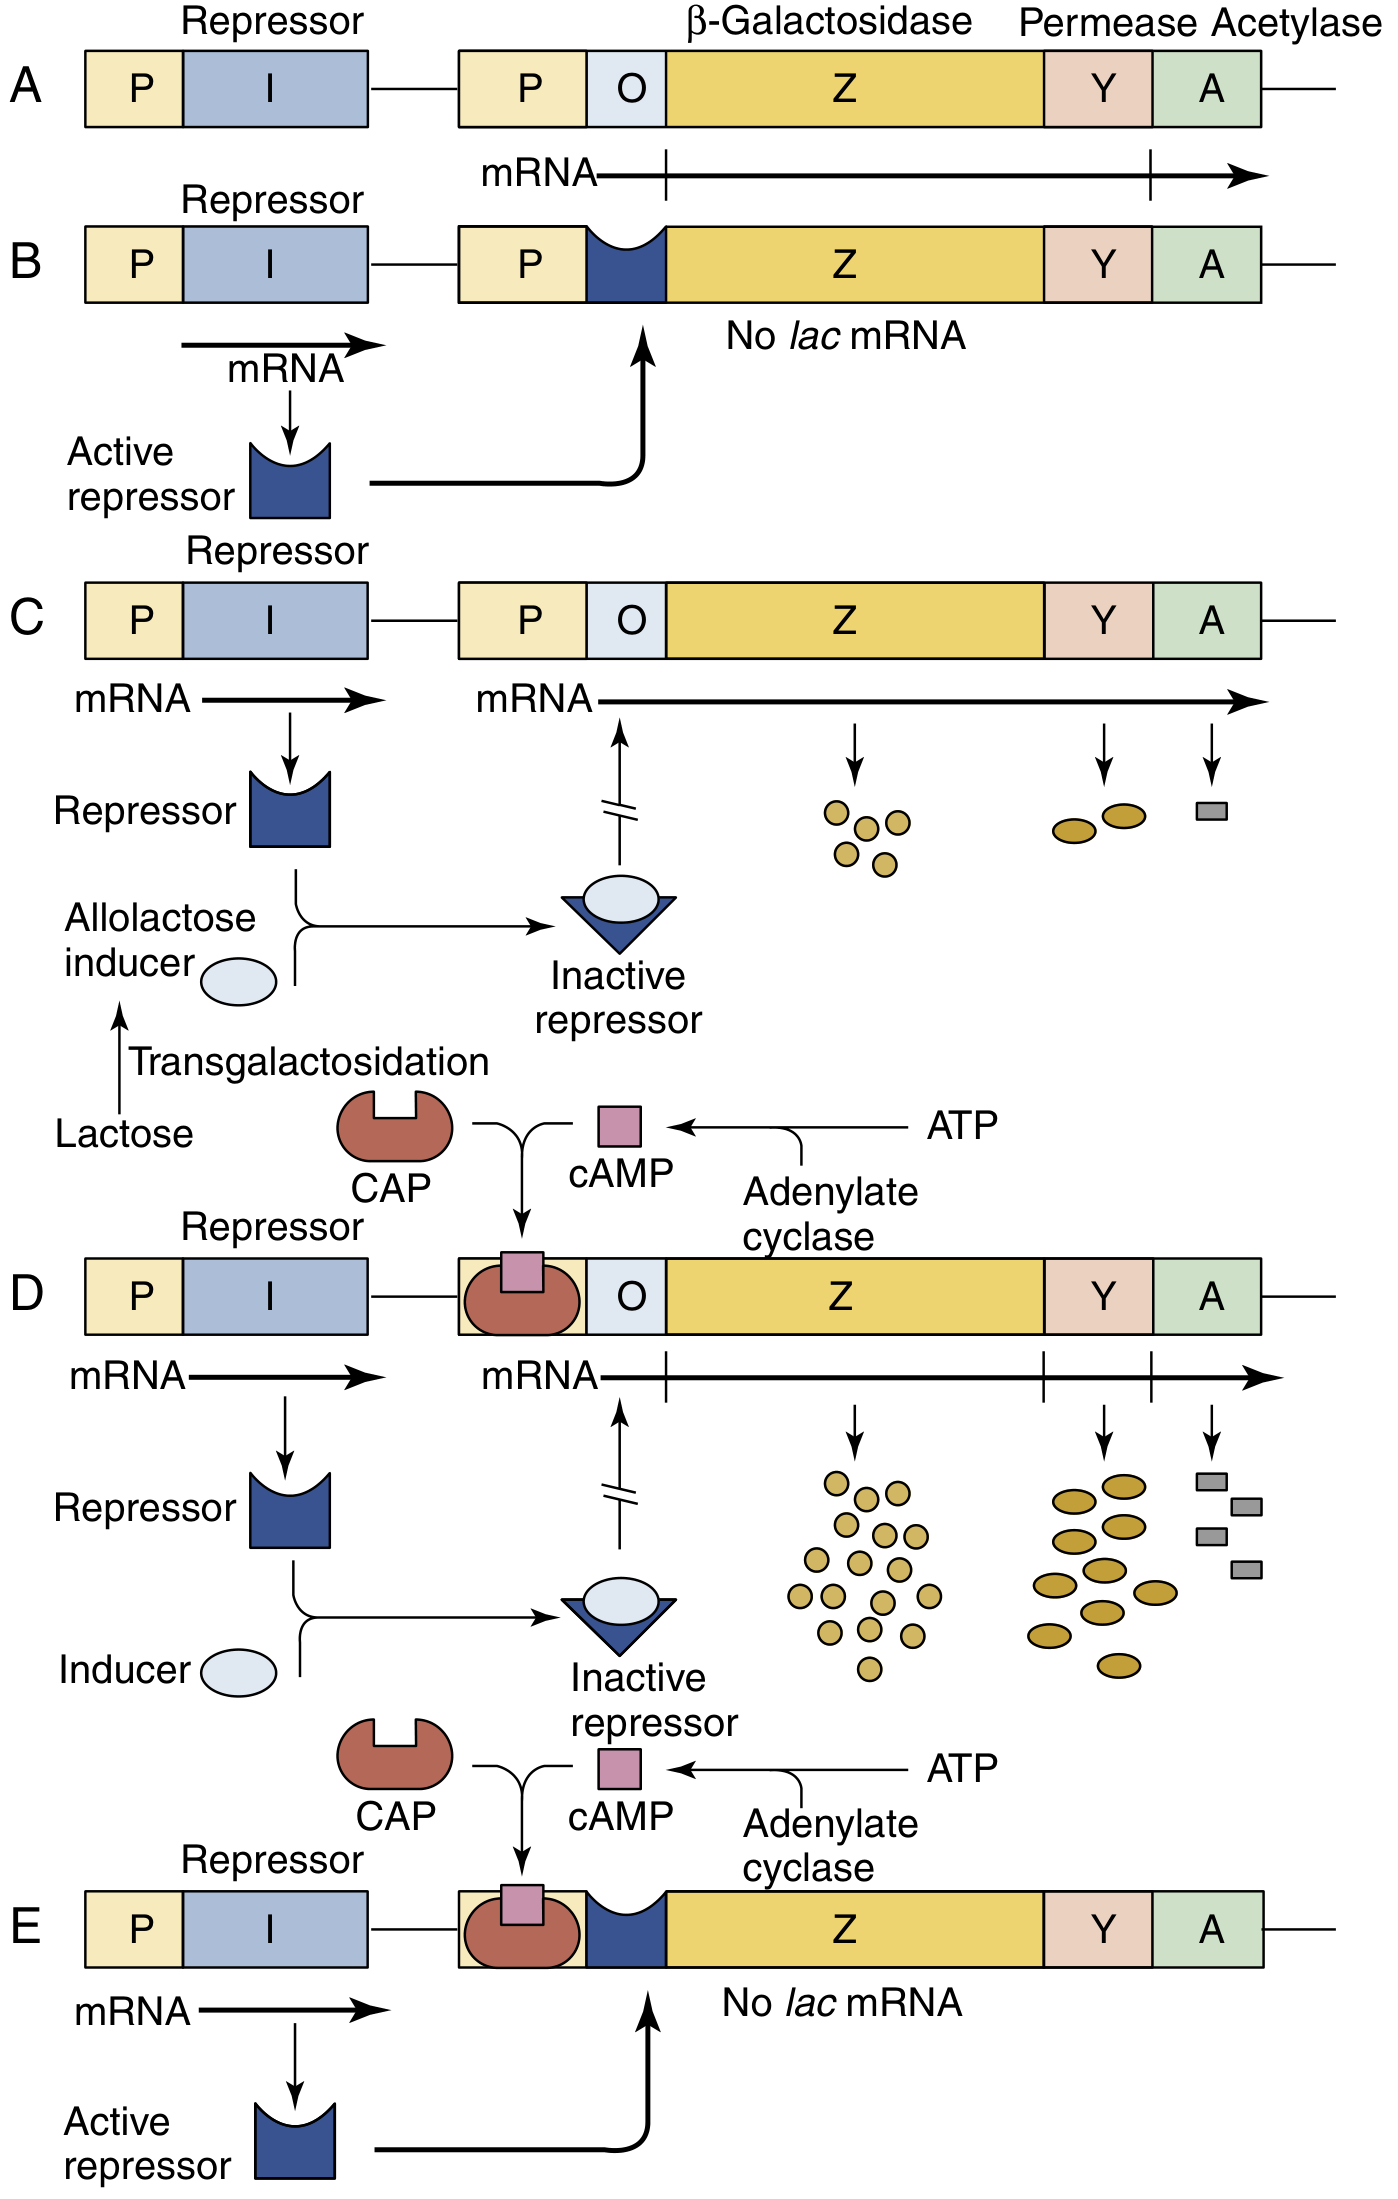
- A: Constitutive - no regulation shown (reference state)
- B: No lactose → active repressor blocks operator → no lac mRNA
- C: Lactose present → allolactose inactivates repressor → low-level transcription (but glucose also present, so cAMP-CAP absent)
- D: Lactose present + no glucose → repressor inactivated + cAMP-CAP bound → maximum transcription
- E: No lactose + no glucose → active repressor still blocks → no lac mRNA (cAMP-CAP binding alone is not sufficient)
Positive Control (cAMP-CAP) in Detail
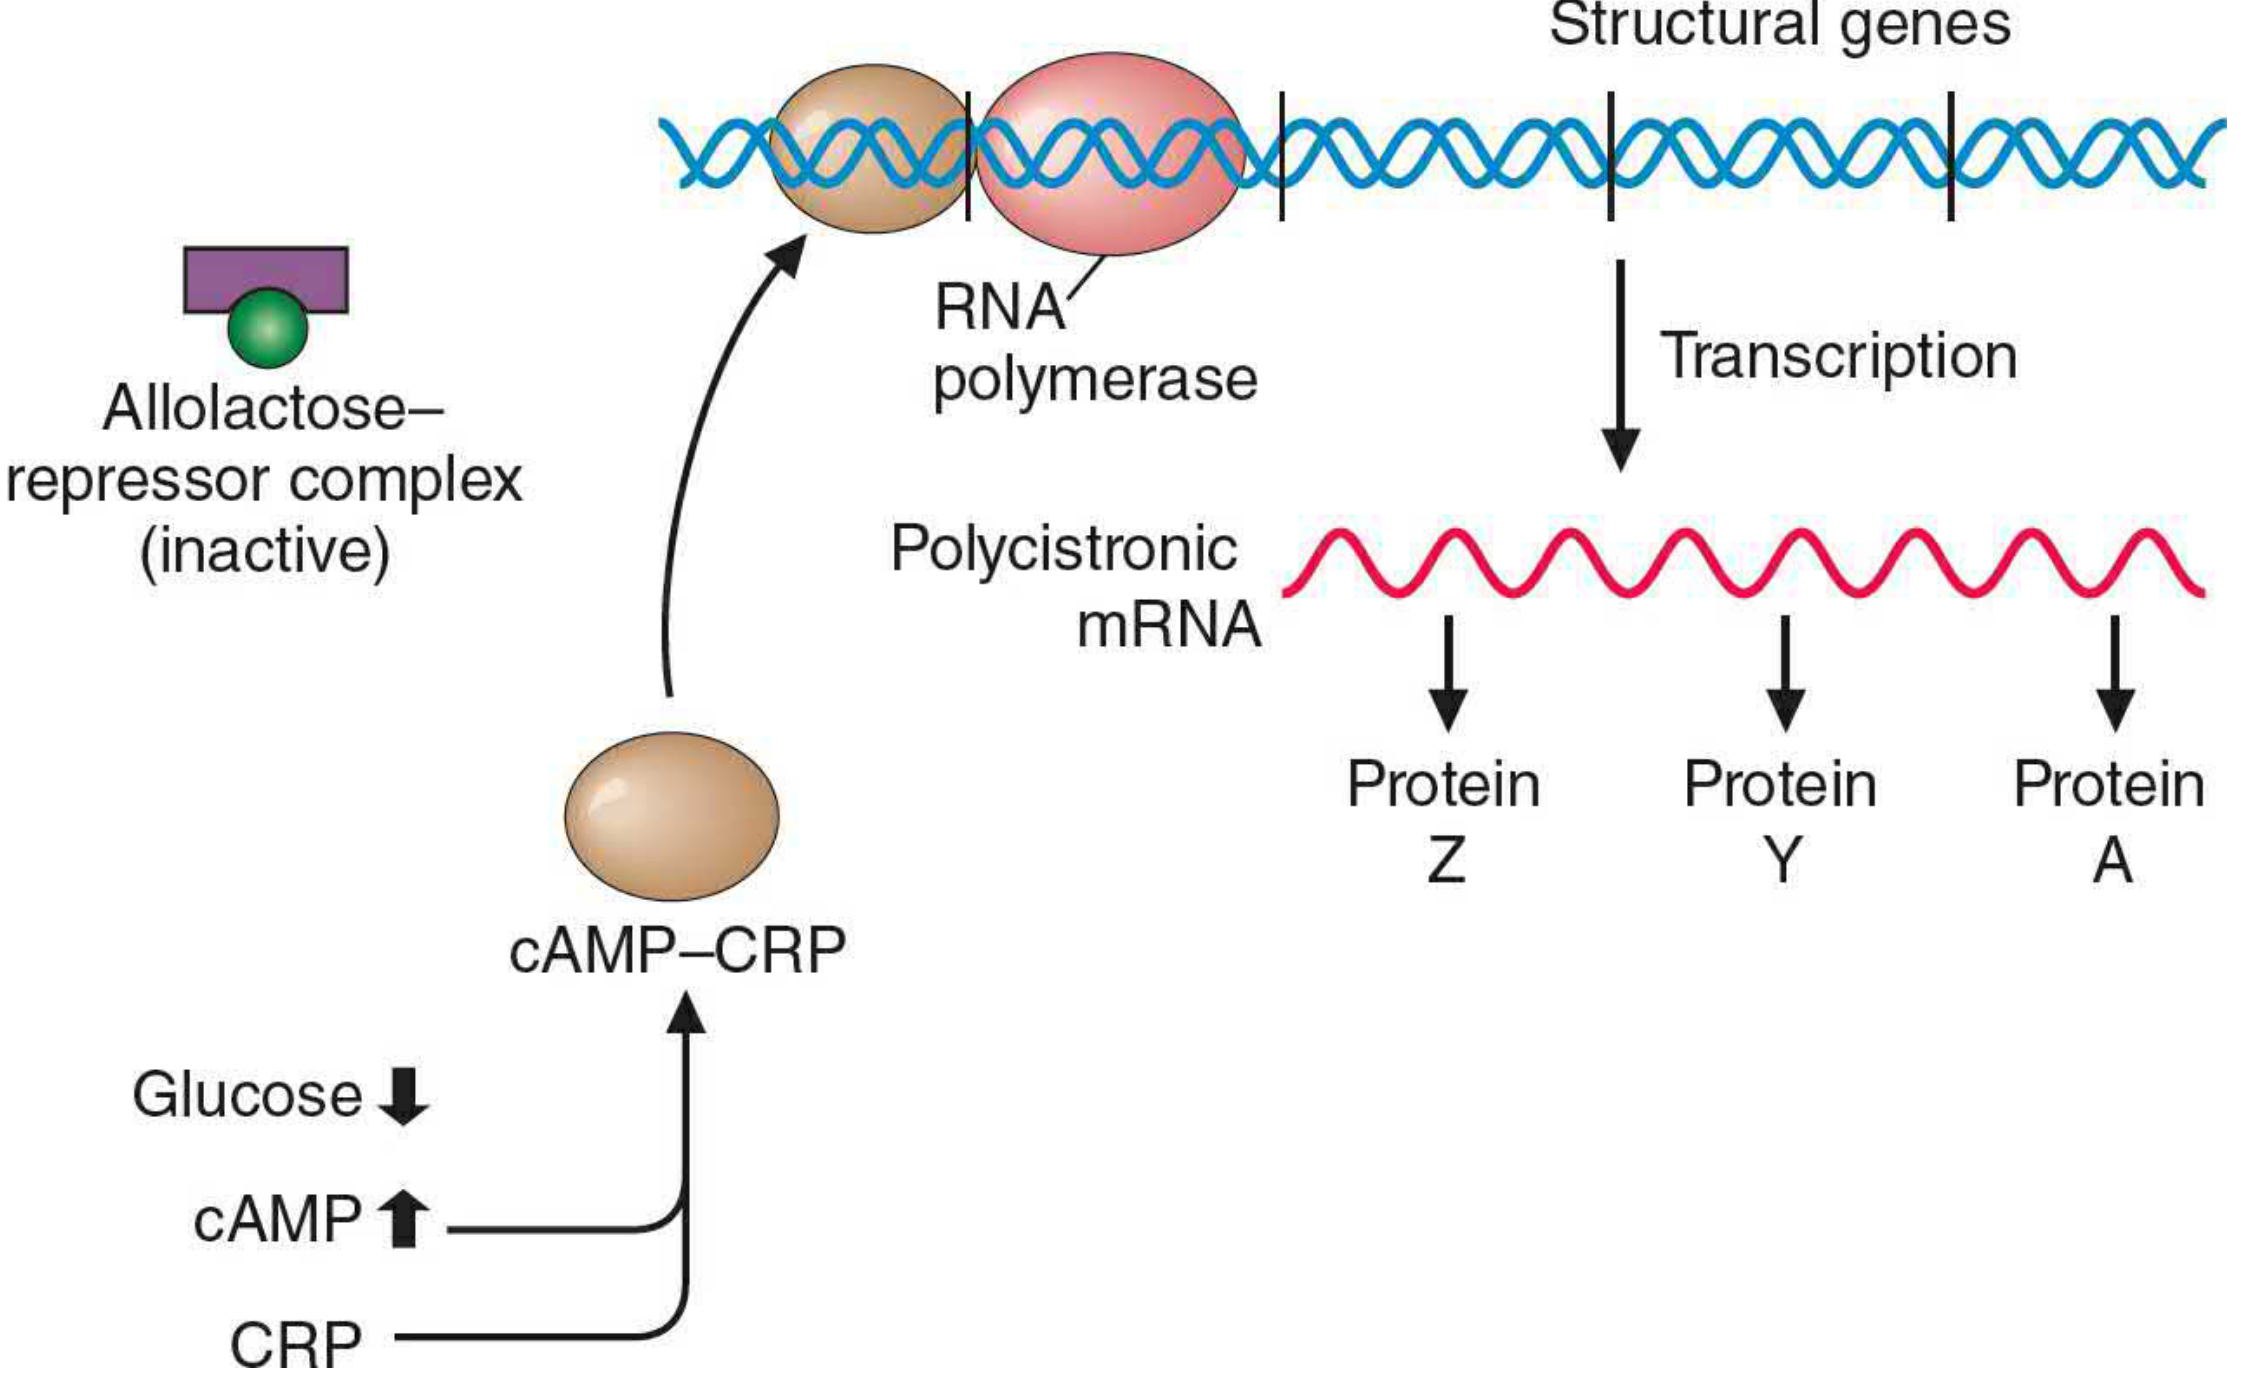
Lac Operon Summary Table
| Condition | Repressor | cAMP-CAP | Transcription |
|---|---|---|---|
| Glucose present, no lactose | Active (on operator) | Absent | Off |
| Lactose present, glucose present | Inactive (inducer bound) | Absent | Very low (basal) |
| Lactose present, no glucose | Inactive | Present | Maximum |
| No lactose, no glucose | Active | Present | Off |
2. THE TRYPTOPHAN OPERON
Concept: Repressible operon with attenuation (negative control only)
Structural Genes
Negative Control: Co-repressor Mechanism
- Tryptophan scarce: Apo-repressor remains inactive → operator unblocked → RNA polymerase transcribes structural genes → tryptophan is synthesized.
- Tryptophan abundant: Tryptophan acts as a co-repressor - it binds to the apo-repressor, causing a conformational change that allows the repressor-Trp complex to bind the operator → transcription is blocked.
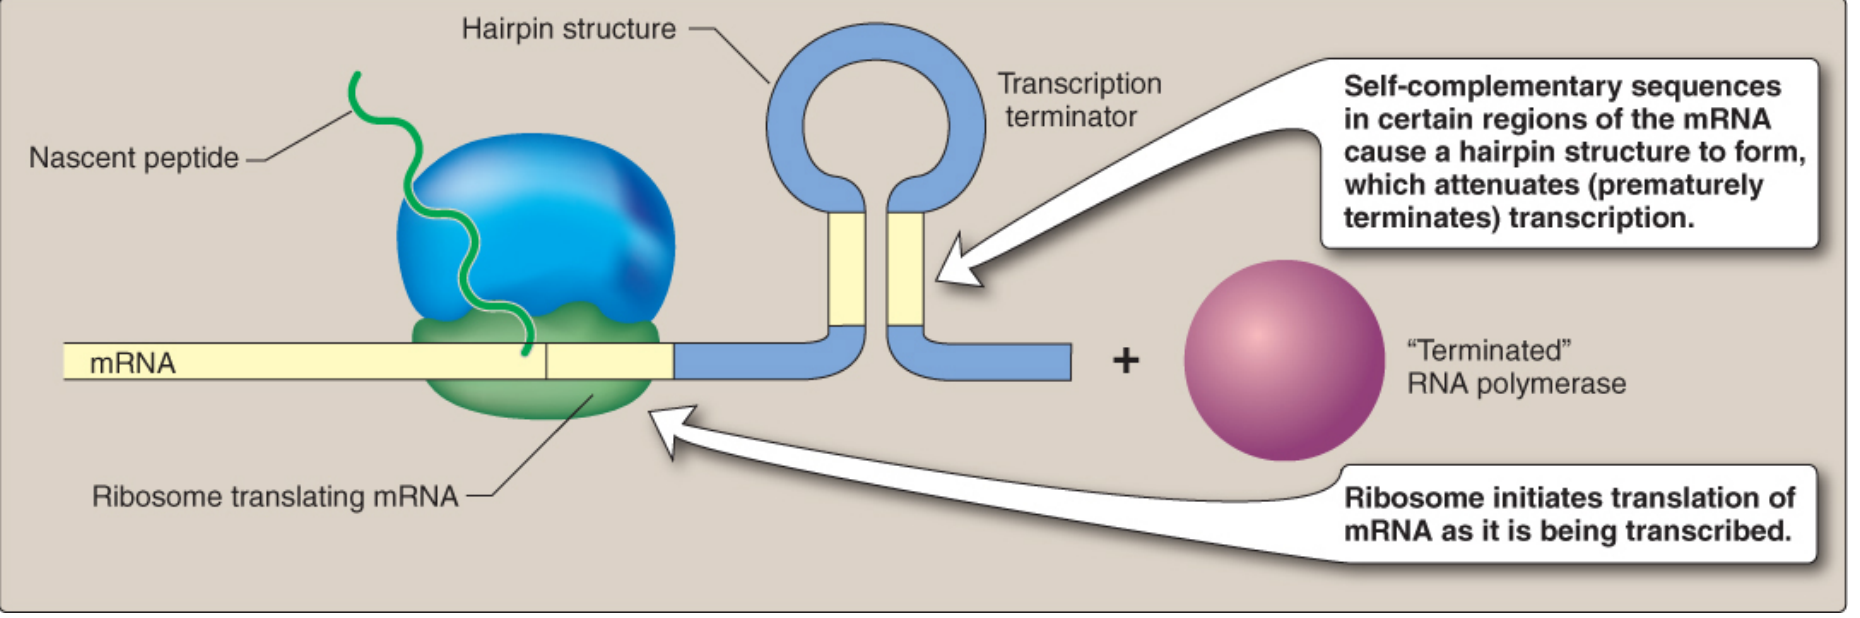
Attenuation: A Second Level of Control
- The mRNA has a 162 bp leader sequence upstream of the structural genes.
- This leader encodes a 14-amino-acid "test peptide" that contains two adjacent tryptophan codons (Trp-Trp).
- The leader mRNA can form alternative stem-loop (hairpin) secondary structures: pause loop (1:2), antiterminator (2:3), and terminator/attenuator (3:4).
| Tryptophan Level | What Happens | Outcome |
|---|---|---|
| Trp plentiful | Charged trp-tRNA abundant → ribosome translates leader peptide rapidly past Trp codons → ribosome covers region 2 → only terminator hairpin (3:4) forms → premature transcription termination | trp mRNA attenuated; structural genes NOT transcribed |
| Trp scarce | Uncharged trp-tRNA → ribosome stalls at Trp-Trp codons (region 1) → region 2 is exposed → antiterminator hairpin (2:3) forms → prevents terminator hairpin from forming | Transcription continues through structural genes → tryptophan synthesized |
| No translation | Region 1:2 hairpin forms, leading to terminator (like Trp-replete state) | Operon off |
Attenuation Hairpin Formation
Trp Operon Summary Table
| Condition | Repressor Status | Attenuation | Transcription |
|---|---|---|---|
| Trp absent | Apo-repressor (inactive) | No attenuation (ribosome stalls at Trp codons) | Maximum |
| Trp moderate | Partially active | Partial attenuation | Intermediate |
| Trp abundant | Active repressor-Trp complex on operator | Full attenuation | Off / Minimal |
COMPARISON: LAC vs TRP OPERON
| Feature | Lac Operon | Trp Operon |
|---|---|---|
| Type | Inducible | Repressible |
| Default state | OFF | ON |
| Effector molecule | Allolactose (inducer) | Tryptophan (co-repressor) |
| Effector action on repressor | Inactivates it (repressor released from operator) | Activates it (repressor binds operator) |
| Structural genes | lacZ, lacY, lacA (3 genes) | trpE, D, C, B, A (5 genes) |
| Products | Lactose-catabolism enzymes | Tryptophan biosynthesis enzymes |
| Control type | Negative + Positive (cAMP-CAP) | Negative only + Attenuation |
| Attenuation | No | Yes (two levels of control) |
| Logic | "Make enzymes only if lactose is present AND glucose is absent" | "Make enzymes unless tryptophan is already abundant" |
| Metabolic direction | Catabolic (breakdown) | Anabolic (biosynthesis) |
- Basic Medical Biochemistry - A Clinical Approach, 6e, pp. 507-509
- Biochemistry, 8th ed - Lippincott Illustrated Reviews, pp. 1288-1289
- Medical Microbiology 9e, pp. 155-157
- Jawetz Melnick & Adelberg's Medical Microbiology, 28e, pp. 122-123