
Physiology of ageing
"aging" AND "physiology" AND "cellular mechanisms"
physiology of ageing age-related changes organ systems
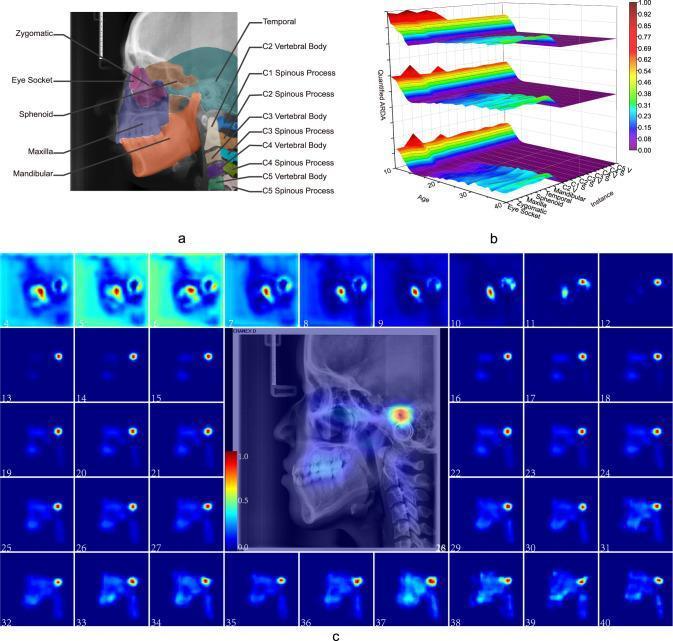
This composite educational graphic illustrates the Ageing-Related Distribution of Ageing (ARDA) in lateral cephalometric radiography (LCR). Panel A displays an anatomical diagram of a lateral skull radiograph with color-coded regions-of-interest (instances), including the eye socket, maxilla, mandibular bone, and cervical vertebrae C1-C5. Panel B presents a 3D quantitative distribution chart plotting age (4-40 years) against specific anatomical instances and quantified ARDA values. The three stacked surface plots represent different ageing-significant region thresholds (median, 75th, and 90th percentiles), showing how salience concentrated in local regions as subjects aged. Panel C provides a multi-frame heatmap progression, mapping average ageing salience across different ages. A central large LCR image of a 28-year-old subject shows the heatmap overlay, where a blue-to-red color gradient indicates low-to-high ageing salience. High salience is notably concentrated in the temporal bone and teeth regions. This visualization demonstrates that human development information is widely distributed across the craniofacial structure in early childhood, while ageing markers become localized in specific dental and skeletal regions after age 12.
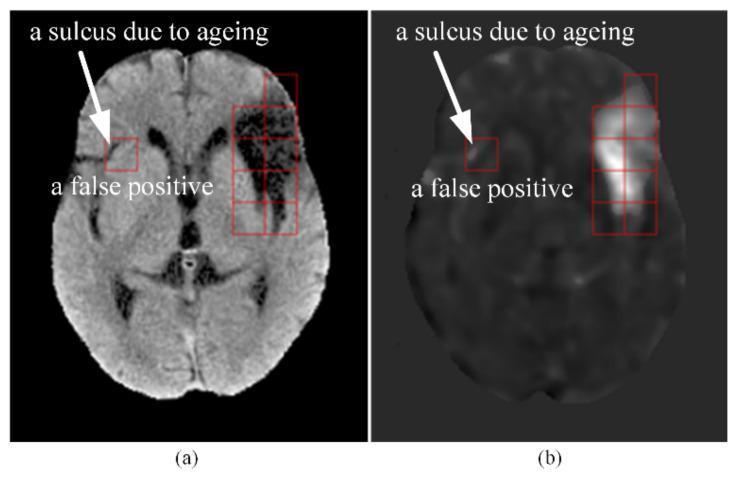
This educational image consists of two side-by-side axial brain CT slices (a and b) demonstrating the challenges of automated cerebral infarct detection in elderly patients. Figure (a) is a processed grayscale CT slice showing the brain parenchyma with visible age-related changes. A red square on the right hemisphere (anatomical left) highlights a deepened sulcus, labeled as a 'false positive' and 'a sulcus due to ageing.' The area appears as a dark, hypodense linear feature representing cerebrospinal fluid-filled spaces common in brain atrophy. Figure (b) displays the corresponding t-score map, where the same sulcular region is represented by high-intensity (bright white) pixels within a red square. This high t-score indicates a significant statistical deviation from a younger control group template, leading to an erroneous identification of an infarct. The image illustrates the clinical relevance of age-matched control groups in neuroradiological diagnostic algorithms to prevent false positives caused by normal age-related structural evolution such as cortical atrophy and sulcal widening.
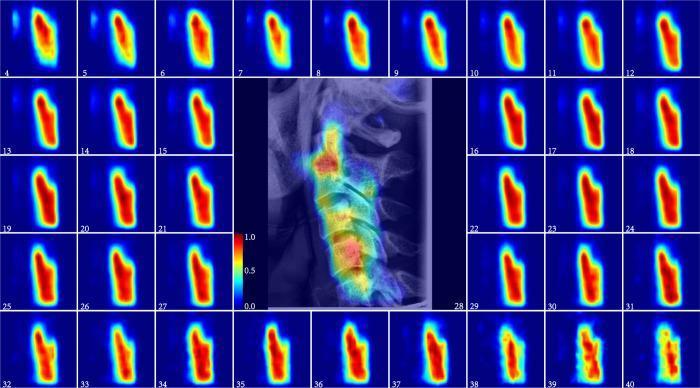
This composite educational graphic presents an Average Relative Distribution of Ageing (ARDA) salience map of the cervical spine across a developmental timeline from 4 to 40 years. The central focus is a lateral cephalometric radiographic (LCR) image of a 28-year-old subject overlaid with a color-coded heat map (blue to red gradient) indicating ageing-significant regions. The surrounding grid displays 37 individual heat maps representing the progression of ageing salience for each year of age. In early childhood (ages 4–9), the salience is broadly and diffusely distributed, reflecting rapid growth and developmental changes. As maturation occurs, particularly after age 12, the ageing salience becomes more localized and consistent. Red and dark red zones indicate high intensity salience, primarily concentrated in the vertebral bodies and the spinous processes of the C2–C5 vertebrae. Anatomical landmarks include the vertebral bodies C1 through C5. This visualization is used in forensic medicine and skeletal maturity assessment to identify specific regions of the cervical spine that provide diagnostic information for biological age estimation and physiological development tracking.
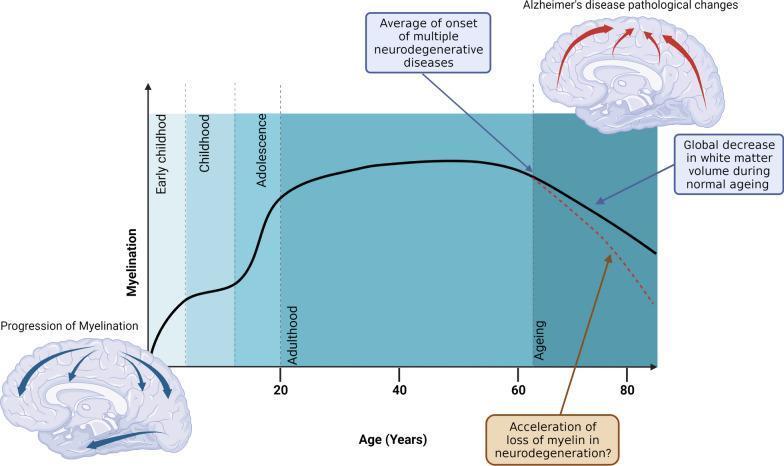
This medical schematic illustrates the longitudinal lifecycle of brain myelination across the human lifespan. The primary element is a line graph plotting myelination levels against age in years. The trajectory shows a rapid increase during early childhood, childhood, and adolescence, plateauing in adulthood and peaking around age 40-50. This is followed by a steady decline in the 'ageing' phase, labeled as a 'global decrease in white matter volume during normal ageing' (solid black line). A diverging dashed red line indicates a more rapid, 'accelerated loss of myelin in neurodegeneration' occurring after age 60. Annotations identify the 'average age of onset of multiple neurodegenerative diseases' coinciding with the start of the physiological decline. Accompanying sagittal brain illustrations visualize the 'progression of myelination' in early life with centrifugal blue arrows and 'Alzheimer’s disease pathological changes' in late life with red arrows indicating cortical destruction. This diagram serves as an educational tool for understanding white matter dynamics in neurology and geriatrics.
Physiology of Ageing
1. Definitions and Terminology
| Term | Meaning |
|---|---|
| Gerontology | Study of physical and psychological changes of old age |
| Geriatrics | Clinical care of the aged |
| Senescence | Lowering of biological efficiency accompanying ageing |
| Biological age | Not identical to chronological age |
- Park's Textbook of Preventive and Social Medicine, p. 690
2. Cellular and Molecular Mechanisms of Ageing
Telomere Shortening and Cellular Senescence
- Activation of p53 and p21
- Inactivation of pRB (retinoblastoma protein)
- Activation of p16 (cyclin-dependent kinase inhibitor)
- Fishman's Pulmonary Diseases and Disorders, p. 414
Key Theories of Ageing
- Free radical / oxidative stress theory: Reactive oxygen species (ROS) accumulate and damage DNA, proteins, and lipids
- Mitochondrial theory: Progressive mitochondrial dysfunction reduces ATP generation
- Somatic mutation theory: Accumulation of unrepaired DNA mutations
- Neuroendocrine theory: Declining hypothalamo-pituitary-gonadal axis function
- Immunological theory: Declining immune surveillance (immunosenescence)
3. Systemic Physiological Changes with Ageing
Cardiovascular System
| Normal Physiological Change | Associated Pathology |
|---|---|
| Decreased arterial elasticity | Atherosclerosis |
| Elevated afterload | Coronary artery disease |
| Elevated systolic blood pressure | Essential hypertension |
| Left ventricular hypertrophy | Congestive heart failure |
| Decreased adrenergic activity | Cardiac arrhythmias |
| Decreased resting heart rate | Aortic stenosis |
| Decreased maximal heart rate | - |
| Decreased baroreceptor reflex | - |
-
Arterial stiffening increases systolic BP and afterload on the left ventricle, driving hypertrophy
-
Maximal heart rate declines by approximately 1 beat/min per year after age 50
-
Fibrosis of the conduction system and loss of sinoatrial node cells increases incidence of atrial fibrillation
-
Resting systolic cardiac function is largely preserved even into the 80s in the absence of disease
-
Calcification of valves can lead to aortic stenosis; systolic murmurs in older adults should prompt investigation
-
Morgan and Mikhail's Clinical Anesthesiology, 7e, p. 1735
Respiratory System
| Normal Physiological Change | Associated Pathology |
|---|---|
| Decreased pulmonary elasticity | Emphysema |
| Decreased alveolar surface area | Chronic bronchitis |
| Increased residual volume | Pneumonia |
| Increased closing capacity | - |
| Ventilation/perfusion (V/Q) mismatching | - |
| Decreased arterial oxygen tension (PaO2) | - |
| Increased chest wall rigidity | - |
| Decreased respiratory muscle strength | - |
| Decreased cough reflex | - |
| Blunted response to hypercapnia and hypoxia | - |
-
Loss of pulmonary elastic recoil causes air trapping - residual volume increases and closing capacity may exceed FRC in supine elderly patients
-
PaO2 declines with age (approximate formula: PaO2 = 100 - 0.3 × age in mmHg)
-
Blunted chemoreceptor response means hypoxia and hypercapnia are less well sensed
-
Decreased cough + impaired mucociliary clearance increases pneumonia risk
-
Morgan and Mikhail's Clinical Anesthesiology, 7e, p. 1735
Renal System
| Normal Physiological Change | Associated Pathology |
|---|---|
| Decreased renal blood flow | Diabetic nephropathy |
| Decreased renal plasma flow | Hypertensive nephropathy |
| Decreased GFR | Prostatic obstruction |
| Decreased renal mass | Congestive heart failure |
| Decreased tubular function | - |
| Impaired sodium handling | - |
| Decreased concentrating ability | - |
| Decreased diluting capacity | - |
| Decreased renin-aldosterone responsiveness | - |
| Impaired potassium excretion | - |
-
GFR declines roughly 1 mL/min/year after age 40; serum creatinine may appear normal because muscle mass also falls
-
Impaired diluting and concentrating capacity makes the elderly vulnerable to both hyponatraemia and dehydration
-
Drug dosing must be adjusted for reduced renal excretory capacity
-
Morgan and Mikhail's Clinical Anesthesiology, 7e, p. 1735
Nervous System
- Progressive loss of neurons, particularly in the prefrontal cortex, hippocampus, and cerebellum
- White matter volume decreases globally with ageing, with risk of accelerated loss in neurodegeneration (e.g., Alzheimer's disease typically manifests after the onset of physiological myelin loss)
- Reduced neurotransmitter synthesis (dopamine, acetylcholine, serotonin)
- Peripheral nerve conduction slows; proprioception declines
- Sleep architecture changes: reduced slow-wave and REM sleep
- Postoperative cognitive dysfunction (POCD) occurs in up to 30% of older adults in the first week after surgery
- Delirium is especially common post-operatively, particularly after hip surgery
- Morgan and Mikhail's Clinical Anesthesiology, 7e, p. 1742
Musculoskeletal System
- Sarcopenia: Progressive loss of muscle mass and strength beginning in the 4th decade; accelerates after age 60
- Myosin heavy chain isoform shifts from fast (Type II) to slow (Type I) fibers
- A 2024 systematic review (PMID: 39374077) confirmed age-related changes in fiber size and myosin heavy chain distribution
- Osteoporosis: Decreased bone mineral density due to imbalance of osteoblastic/osteoclastic activity; estrogen withdrawal in females accelerates this
- Cartilage degenerates - osteoarthritis of weight-bearing joints
- Fracture neck of femur is a very common geriatric emergency
Endocrine System
- Growth hormone (GH) secretion declines - "somatopause"
- IGF-1 levels fall with GH
- Testosterone decreases in males ("andropause")
- Estrogen declines in females at menopause
- DHEA (dehydroepiandrosterone) levels progressively fall
- Cortisol tends to be preserved or slightly elevated
- Reduced insulin sensitivity - impaired glucose tolerance is common
- Thyroid function mostly preserved; however, T3 levels may fall slightly
Gastrointestinal System
- Reduced gastric acid secretion (hypochlorhydria)
- Delayed gastric emptying
- Reduced intestinal motility - constipation more common
- Decreased absorption of calcium, iron, folate, and vitamin B12
- Hepatic blood flow and liver mass decrease - drug metabolism slowed
- GFR decline affects enterohepatically cleared drugs
Immune System (Immunosenescence)
- Thymic involution begins in puberty and is nearly complete by age 50-60
- Naive T-cell output falls; memory T-cell repertoire narrows
- B-cell function declines - reduced antibody response to vaccination
- Innate immunity relatively preserved but impaired phagocyte function
- Inflammageing: Chronic low-grade systemic inflammation (raised IL-6, TNF-alpha, CRP) without acute infection - contributes to atherosclerosis, sarcopenia, and neurodegeneration
Integumentary System (Skin)
- Epidermal thinning; flattening of dermoepidermal junction
- Reduced melanocyte function - grey hair
- Decreased sebaceous and sweat gland activity
- Loss of dermal collagen and elastin - wrinkling
- Impaired wound healing
- Reduced vitamin D synthesis in skin
Special Senses
- Vision: Presbyopia (lens stiffening); cataract; reduced pupil size limits low-light vision
- Hearing: Presbycusis (sensorineural high-frequency loss due to cochlear hair cell loss)
- Smell and taste: Reduced olfactory and taste receptor function
- Vestibular: Decline in balance and proprioception - fall risk increases
4. Pharmacological Implications of Ageing
| Parameter | Change with Ageing | Clinical Effect |
|---|---|---|
| Body composition | Reduced lean mass, increased fat% | Higher Vd for lipophilic drugs; prolonged effect |
| Plasma albumin | Reduced | More free (active) drug for protein-bound agents |
| Renal clearance | Reduced GFR | Drug accumulation - reduce doses |
| Hepatic clearance | Reduced | Prolonged half-life for hepatically metabolised drugs |
| CNS sensitivity | Increased | Lower doses of sedatives/opioids needed |
- Morgan and Mikhail's Clinical Anesthesiology, 7e, p. 1736
5. Diseases Strongly Associated with Ageing
-
Degenerative cardiovascular diseases (atherosclerosis, CHF, arrhythmias)
-
Cancer (incidence rises sharply after age 40)
-
Type 2 diabetes
-
Diseases of the locomotor system (osteoarthritis, gout, rheumatoid arthritis)
-
Respiratory: chronic bronchitis, emphysema, asthma
-
Genitourinary: prostatic enlargement, urinary incontinence
-
Neuropsychiatric: dementia, depression
-
Osteoporosis with fractures (especially neck of femur)
-
Sensory impairment: cataract, glaucoma, nerve deafness
-
Park's Textbook of Preventive and Social Medicine, p. 690-691