
Serological reaction microbiology bpt 2nd year
serological reactions agglutination precipitation immunology microbiology
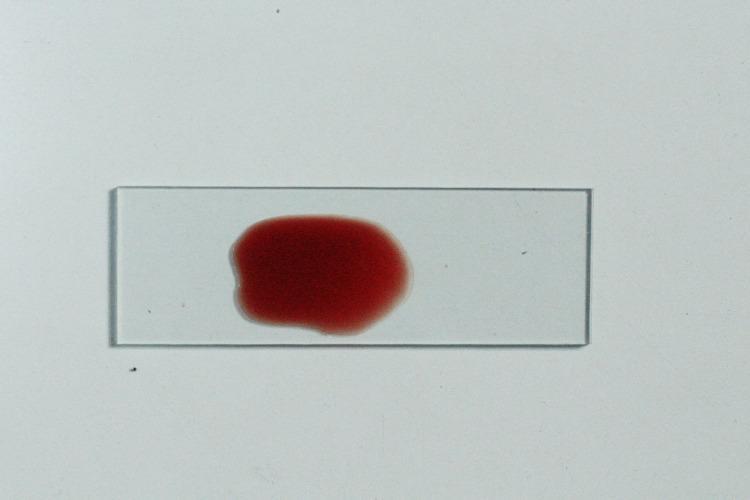
A clinical photograph of a glass microscope slide displaying a macroscopically negative agglutination reaction from a salivary secretor status test. A central, deep red liquid droplet is visible, representing a mixture of saliva, antisera, and indicator red blood cells. The sample shows a smooth, homogenous appearance with no visible clumping or granular precipitation, which indicates that the salivary blood group antigens have neutralized the antisera, preventing red cell agglutination. The droplet is roughly circular with diffuse margins where the liquid thins against the transparent glass surface. This visual finding is characteristic of a 'positive' secretor status result in the absorption-inhibition method, used in forensic medicine and clinical immunology to identify ABH antigens in body fluids. The absence of particulate structures confirms a uniform suspension of cells.
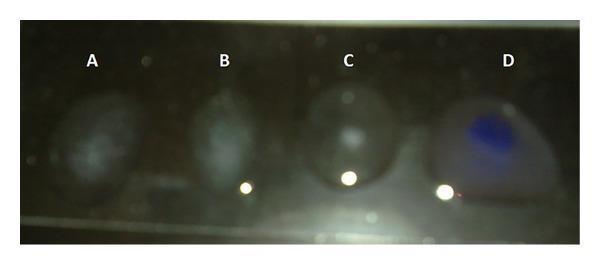
A clinical laboratory image demonstrating a rapid slide agglutination test for Salmonella typhimurium. The image displays four liquid samples labeled A, B, C, and D on a dark slide surface. Samples A, B, and C show clear visual evidence of positive agglutination, characterized by a non-homogeneous, cloudy appearance with visible granularity and white clumped aggregates suspended within the droplets. These represent S. typhimurium ATCC 14028 (A) and bacterial ghost (BG) preparations from two experiments (B and C) reacting with specific antibodies. Sample D serves as the kit's positive control (O antigen), showing a distinct blue-colored agglutination reaction where dense, concentrated blue aggregates are visible within the liquid drop. This diagnostic image illustrates the antigen-antibody interaction used to confirm the presence and structural integrity of surface antigens on Salmonella cells and bioengineered ghosts, essential for vaccine development and serological identification in clinical microbiology.
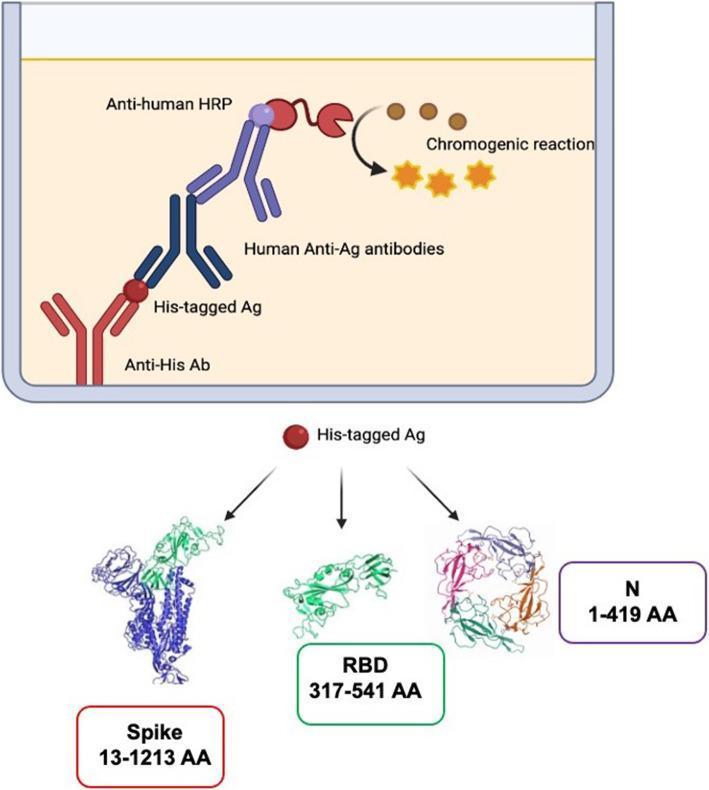
This medical schematic diagram illustrates the mechanism of an indirect ELISA serological assay for SARS-CoV-2 antibody detection. The upper panel depicts a multi-step binding sequence: an immobilized 'Anti-His Ab' captures a 'His-tagged Ag' (antigen), which is then recognized by 'Human Anti-Ag antibodies' from a patient sample. A secondary 'Anti-human HRP' (horseradish peroxidase) conjugate binds the human antibody, catalyzing a 'chromogenic reaction' represented by orange stars, signifying a positive result. The lower panel displays the three primary structural proteins used as antigens in these assays: the full Spike protein (amino acids 13-1213), the Receptor Binding Domain (RBD, amino acids 317-541), and the Nucleocapsid (N) protein (amino acids 1-419). Molecular ribbon models accompany each label to show their complex secondary and tertiary structures. This visual summarizes the principles of diagnostic immunology, emphasizing the specificity of antibody-antigen interactions and the use of recombinant viral proteins to evaluate seroprevalence and immune response in infectious diseases.
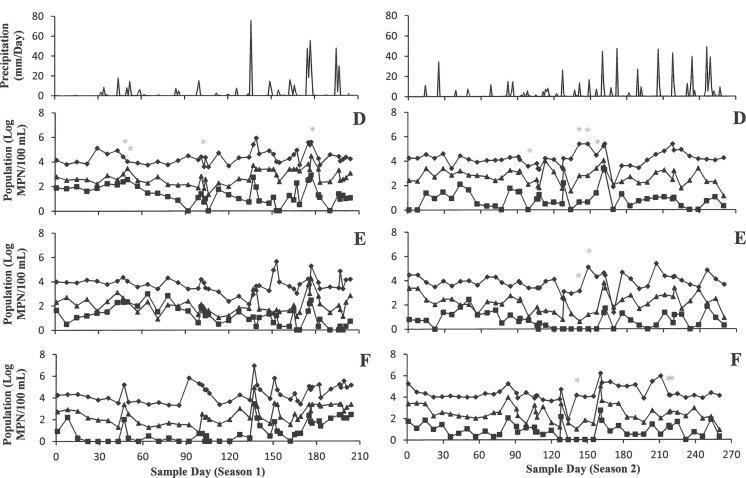
This Comparison Chart displays longitudinal environmental microbiology data for three microbial indicators—Total Coliform (diamonds), Generic E. coli (squares), and Enterococci (triangles)—across two growing seasons (Season 1 and Season 2) in three agricultural ponds (labeled D, E, and F). The primary Y-axis measures the microbial population in Log MPN/100 mL, while the secondary Y-axis tracks daily precipitation in mm/day. The X-axis represents the sampling timeline in days. The plots demonstrate fluctuations in indicator organisms over a 204-day period (Season 1) and a 260-day period (Season 2). Total coliforms consistently show the highest concentration (up to 8 log), followed by enterococci (up to 5.2 log), with generic E. coli remaining the lowest (below 4.2 log). Asterisks indicate sampling days that tested positive for the invA gene, a marker for Salmonella. This infographic illustrates the environmental persistence and temporal dynamics of fecal indicator bacteria in agricultural water sources, essential for public health risk assessment and food safety protocols in irrigation water management.
complement fixation test ELISA immunofluorescence Western blot serology
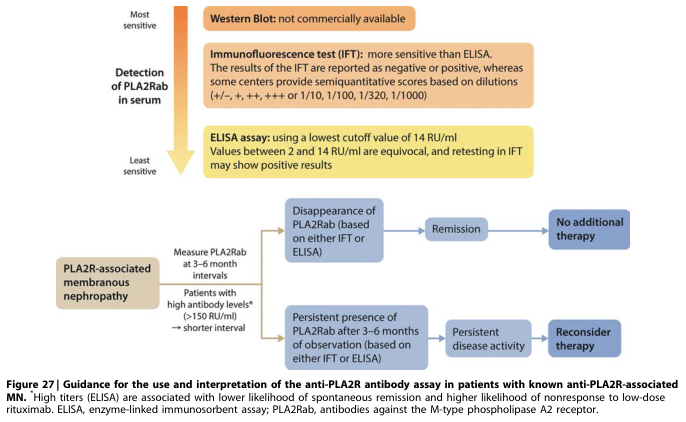
Summary : This flowchart provides guidance for the use and interpretation of anti-PLA2R antibody assays (IFT and ELISA) in patients with known anti-PLA2R-associated membranous nephropathy (MN), outlining assay sensitivity, testing intervals, and clinical decision points based on antibody persistence or disappearance. flowchart: # Detection Methods : • Western Blot: not commercially available (most sensitive, but not used). • Immunofluorescence test (IFT): more sensitive than ELISA; results reported as negative/positive or with semiquantitative scores based on dilutions (e.g., +/-, +, ++, +++, or 1/10, 1/100, 1/320, 1/1000). • ELISA assay: least sensitive; uses a cutoff value of 14 RU/ml. Values between 2 and 14 RU/ml are equivocal, and retesting in IFT may show positive results. # Nodes : • PLA2R-associated membranous nephropathy (rectangle): starting point. • Measure PLA2Rab at 3–6 month intervals (rectangle). • Patients with high antibody levels* (>150 RU/ml) → shorter interval (rectangle). • Disappearance of PLA2Rab (based on either IFT or ELISA) (rectangle). • Remission (rectangle). • No additional therapy (rectangle). • Persistent presence of PLA2Rab after 3–6 months of observation (based on either IFT or ELISA) (rectangle). • Persistent disease activity (rectangle). • Reconsider therapy (rectangle). # Connectors : • Downward arrows indicate process flow. • From "PLA2R-associated membranous nephropathy" to "Measure PLA2Rab at 3–6 month intervals". • Branch: "Patients with high antibody levels* (>150 RU/ml)" leads to "shorter interval". • From measurement, two branches: – If "Disappearance of PLA2Rab", arrow to "Remission" then to "No additional therapy". – If "Persistent presence of PLA2Rab after 3–6 months", arrow to "Persistent disease activity" then to "Reconsider therapy". # Layout : • Vertical flow from detection methods (top) to clinical decision points (bottom). • Branching at the measurement step based on antibody levels and persistence/disappearance. • Colour coding: orange (detection methods), blue (remission pathway), purple (persistent disease pathway), yellow (ELISA details). # Analysis : • The flowchart emphasizes the importance of assay sensitivity (IFT > ELISA) and regular monitoring of PLA2Rab in guiding therapy for anti-PLA2R-associated MN. • Disappearance of antibodies is associated with remission and no further therapy, while persistent antibodies after 3–6 months suggest ongoing disease and the need to reconsider therapy. • High antibody titers (>150 RU/ml) warrant more frequent monitoring due to a shorter interval to clinical decision-making. • The chart visually distinguishes between remission and persistent disease pathways, supporting evidence-based management decisions.
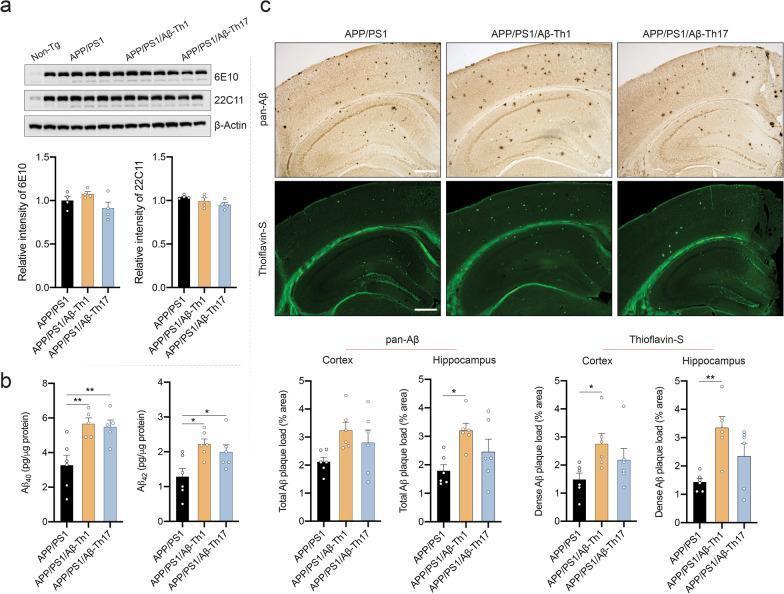
Educational medical composite depicting the effects of Aβ-Th1 and Aβ-Th17 cell adoptive transfer on amyloid pathology in an APP/PS1 mouse model. Panel (a) shows western blot analysis of full-length APP expression (6E10 and 22C11 antibodies) across non-Tg, APP/PS1, and treated groups, with accompanying densitometry. Panel (b) presents ELISA quantification of soluble Aβ1-40 and Aβ1-42 levels (pg/µg protein), demonstrating significant increases in treated groups. Panel (c) contains representative immunohistochemistry (pan-Aβ, brown DAB) and immunofluorescence (Thioflavin-S, green) of cortical and hippocampal brain sections. These images visualize total and dense insoluble amyloid plaque loads. Accompanying bar graphs quantify the percentage of area occupied by plaques, highlighting statistically significant increases (indicated by asterisks) in the APP/PS1/Aβ-Th1 group for both total and dense plaques in the cortex and hippocampus. Scale bars represent 100 µm. This visual summary illustrates how specific T-effector cells exacerbate amyloidosis and neuroinflammatory progression in Alzheimer's disease research models.
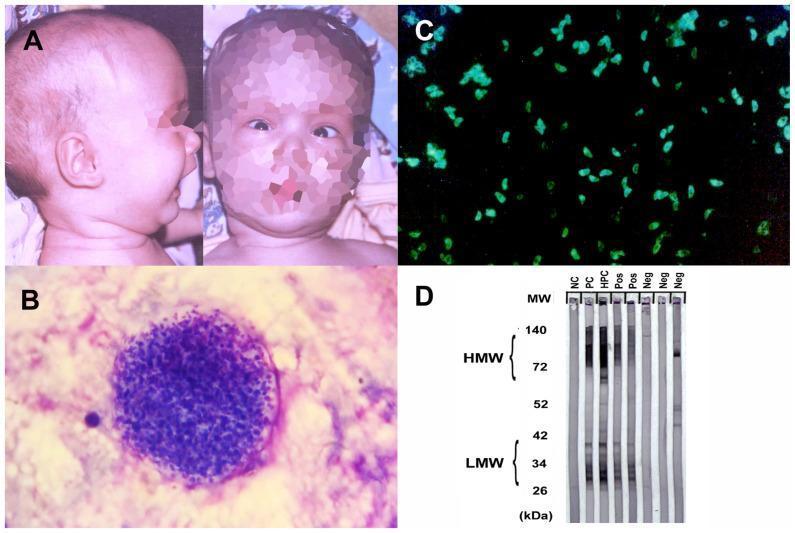
A multi-panel figure illustrating clinical, histopathological, and serological diagnostic findings for parasitic central nervous system infections. Panel A presents clinical photographs of an infant exhibiting macrocephaly and the 'sunset eye sign' (downward gaze with visible sclera above the iris), characteristic of hydrocephalus due to congenital toxoplasmosis. Panel B is a high-power light microscopy image of a Toxoplasma gondii tissue cyst in the brain, containing numerous densely packed bradyzoites. Panel C shows an indirect immunofluorescence assay (IFA) demonstrating bright green peripheral fluorescence of Toxoplasma tachyzoites, indicating positive anti-Toxoplasma antibodies. Panel D displays a Western blot analysis for toxocariasis. It compares patient samples against negative (NC), positive (PC), and high-positive (HPC) controls. The presence of low molecular weight (LMW) bands, specifically between 26 and 34 kDa, is the diagnostic criteria for positive Toxocara serology, while high molecular weight (HMW) bands are also visible in positive samples. The composite serves as an educational tool for identifying physical signs and interpreting specialized laboratory assays in neuroparasitology.
Serological Reactions - Microbiology (BPT 2nd Year)
Definition
- Diagnose infectious diseases
- Identify unknown microorganisms
- Detect circulating antibodies
- Determine immune status
Basis of Serological Reactions
- Directly - by precipitation or agglutination (physical state change)
- By labeling - using radioactive, fluorescent, or enzyme-tagged antibodies
- Indirectly - by measuring a secondary reaction (e.g., complement fixation)
Types of Serological Reactions
1. Precipitation Reactions
- Soluble complexes form when antigen is in excess (prozone) or antibody is in excess (postzone)
- Only at equivalence do large insoluble lattices form
| Technique | Principle | Use |
|---|---|---|
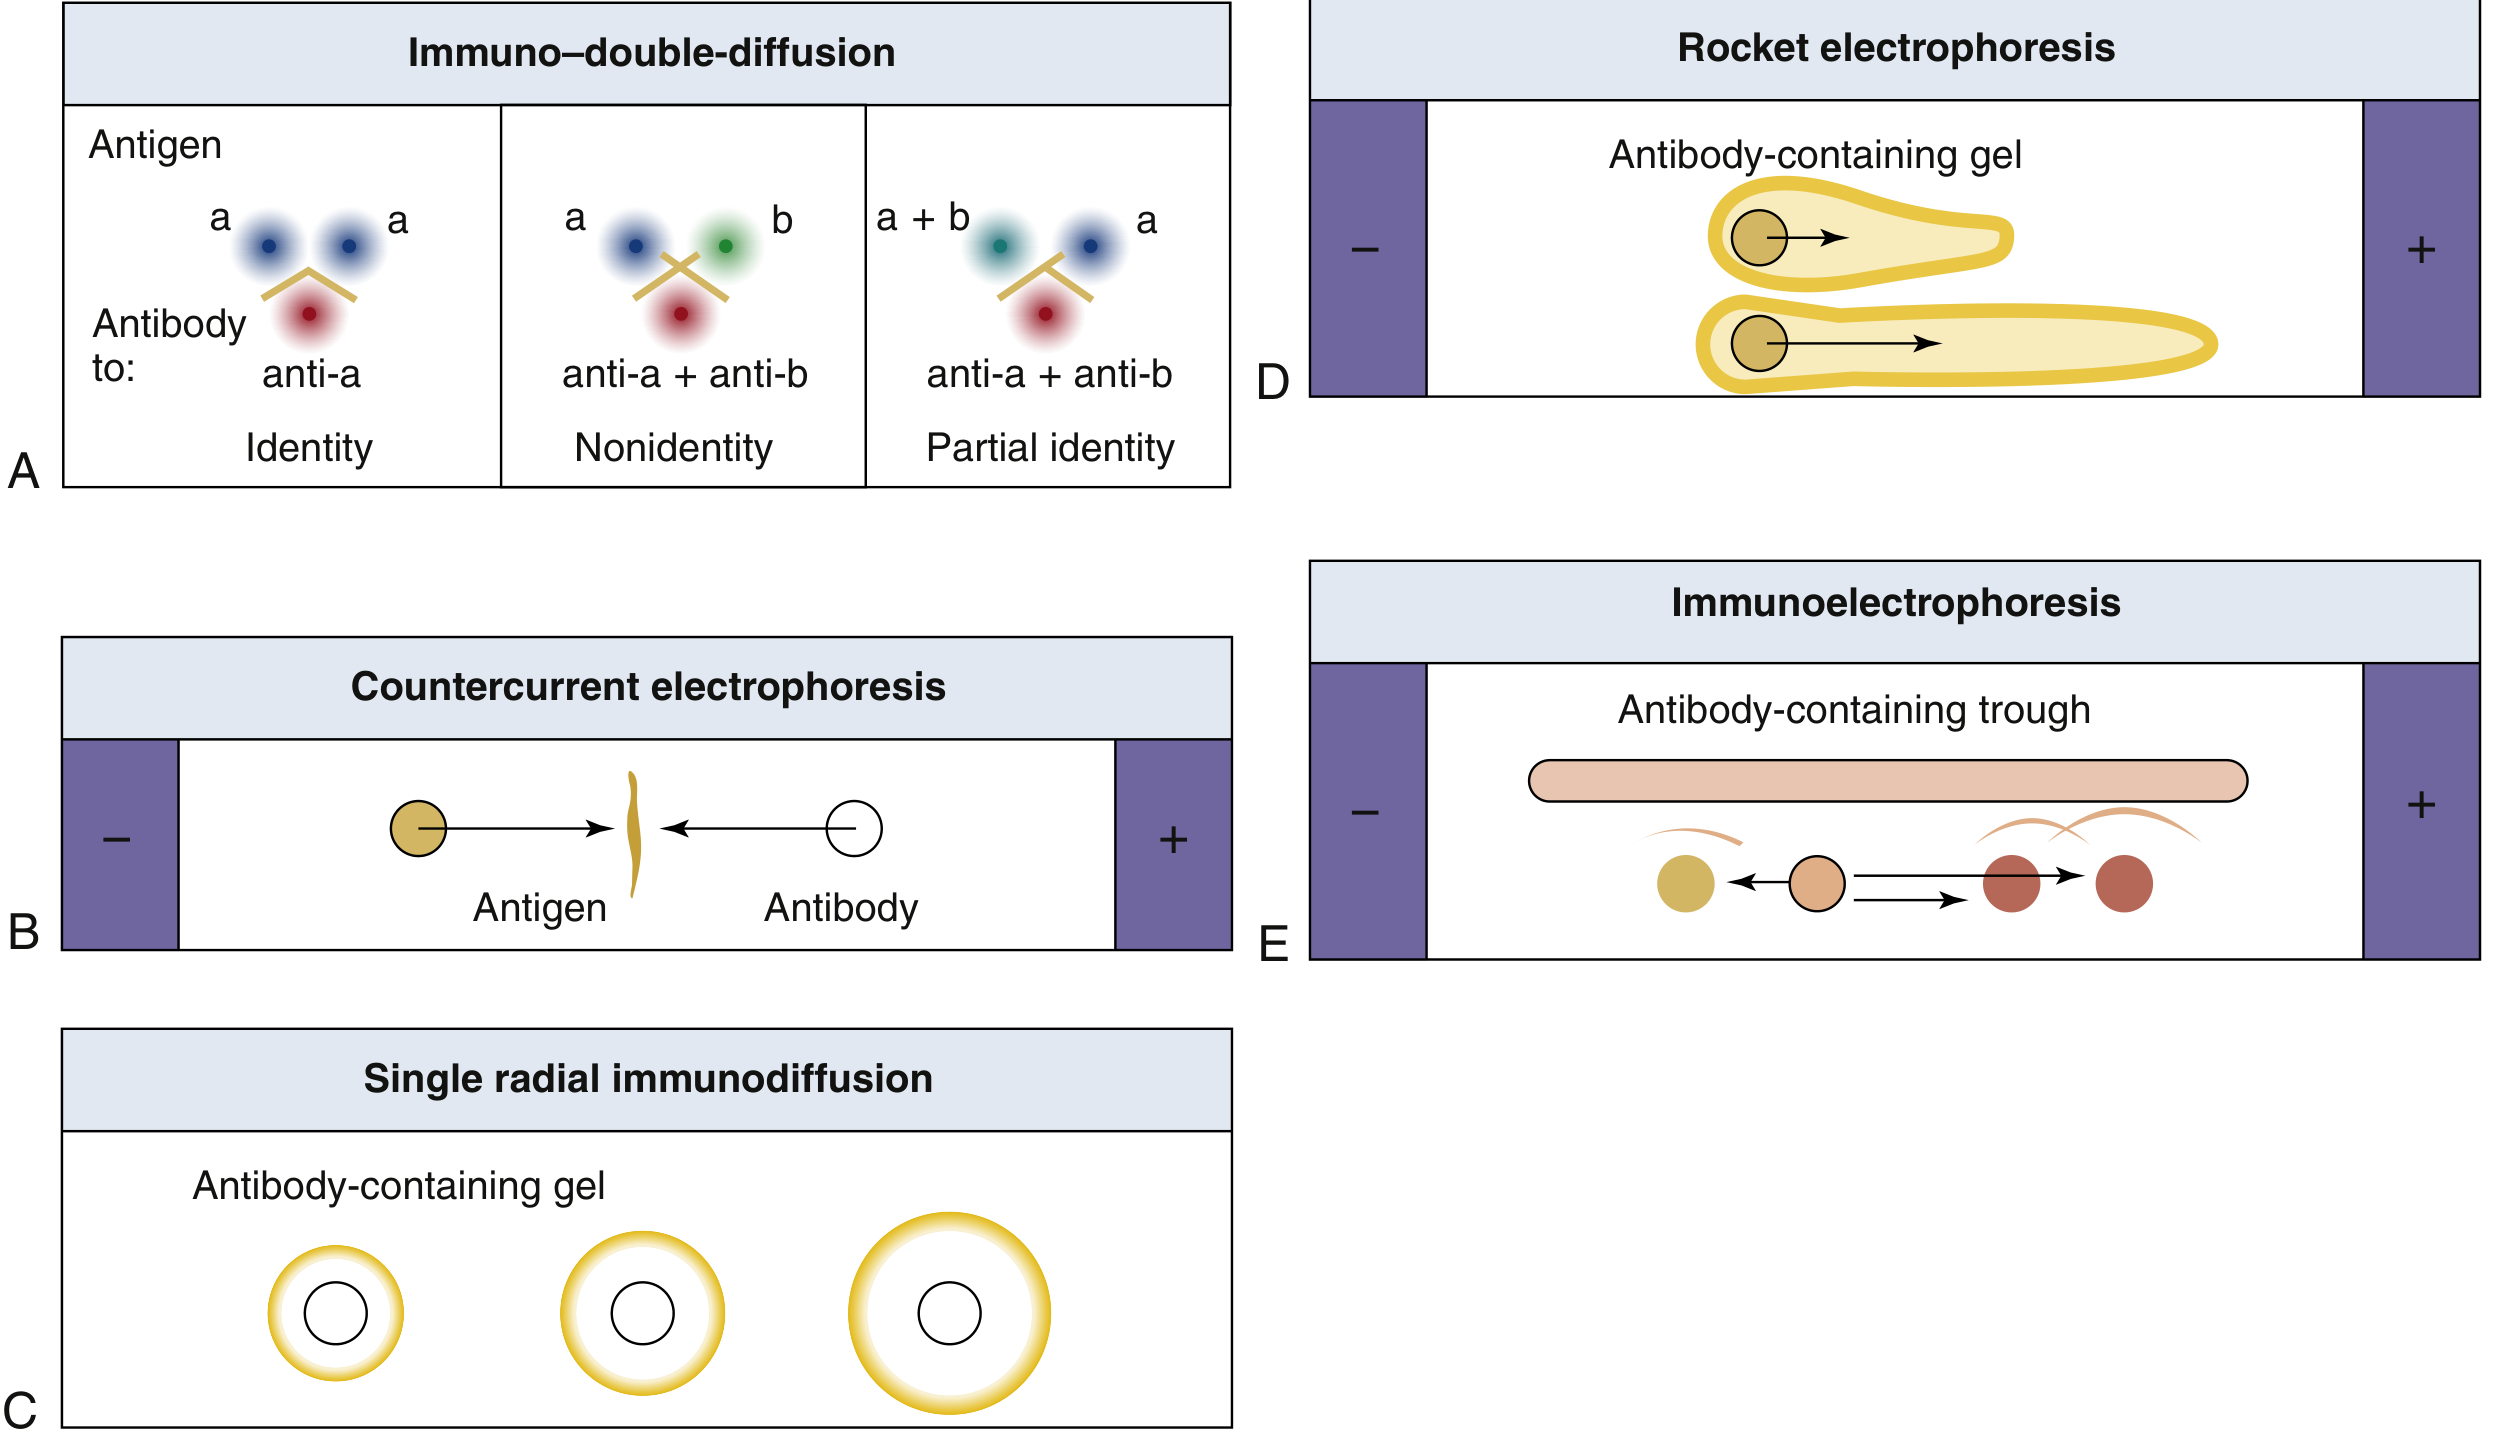
| Ouchterlony (Immuno-double-diffusion) | Ag and Ab diffuse from separate wells in agar gel; precipitin line forms at equivalence | Detects fungal antigens (Histoplasma, Blastomyces, Coccidioides); determines identity/non-identity/partial identity of antigens |
| Single Radial Immunodiffusion (RID) | Antigen diffuses into Ab-containing agar; precipitin ring forms; ring area is proportional to Ag concentration | Quantitation of antigen (e.g., immunoglobulins) |
| Countercurrent Electrophoresis | Similar to Ouchterlony but antigen and antibody are pushed toward each other by electrophoresis | Faster results; used for CSF antigen detection |
| Rocket Electrophoresis | Antigen is driven electrophoretically into Ab-containing agar; rocket-shaped precipitate forms; length = Ag concentration | Quantitation of antigens |
| Immunoelectrophoresis | Antigen is first separated by electrophoresis in agar, then antibody in a trough diffuses toward separated antigens | Identifying serum protein abnormalities (e.g., myeloma proteins) |
2. Agglutination Reactions
| Type | Description | Clinical Example |
|---|---|---|
| Direct (Active) Agglutination | Antibody directly agglutinates naturally particulate antigens (bacterial cells, RBCs) | Widal test (Salmonella), Weil-Felix reaction (Rickettsiae) |
| Indirect (Passive) Agglutination | Soluble antigen is coated onto carrier particles (latex, RBCs, charcoal), then agglutinated by antibody | Latex agglutination for Rheumatoid Factor, cryptococcal antigen; VDRL for syphilis |
| Hemagglutination | Antibody agglutinates red blood cells bearing surface antigens | ABO blood typing, Coombs test |
| Hemagglutination Inhibition (HI) | Tests if patient antibody inhibits virus-induced hemagglutination | Influenza seroconversion, serotyping of influenza strains |
| Reverse Passive Agglutination | Antibody is coated onto particles; detects antigen in specimen | Cryptococcal antigen in CSF |
3. Complement Fixation Test (CFT)
- Stage 1: Patient serum + known antigen + complement. If antibody is present, antigen-antibody complexes form and fix (consume) complement.
- Stage 2: Sensitized sheep RBCs (coated with anti-sheep-RBC antibody) are added as an indicator system.
- No lysis (negative hemolysis) = Positive test (complement was fixed in stage 1 - antibody was present)
- Lysis (positive hemolysis) = Negative test (complement was free - no antibody in patient serum)
4. Neutralization Tests
- Serum antibody is mixed with virus/toxin
- The mixture is then inoculated into cells or animals
- If neutralization occurs, the virus/toxin is inactive
- Virus Neutralization Test: Antibody neutralizes viral infectivity (cytopathic effect inhibition)
- Toxin Neutralization (Schick Test): Used historically for diphtheria toxin
5. Immunofluorescence (IF)
| Type | Procedure | Advantage |
|---|---|---|
| Direct IF | Fluorescent-labeled antiviral Ab applied directly to specimen | Faster; fewer steps |
| Indirect IF | Primary (unlabeled) Ab applied first; secondary fluorescent anti-Ig Ab detects primary Ab | More sensitive; signal amplified |
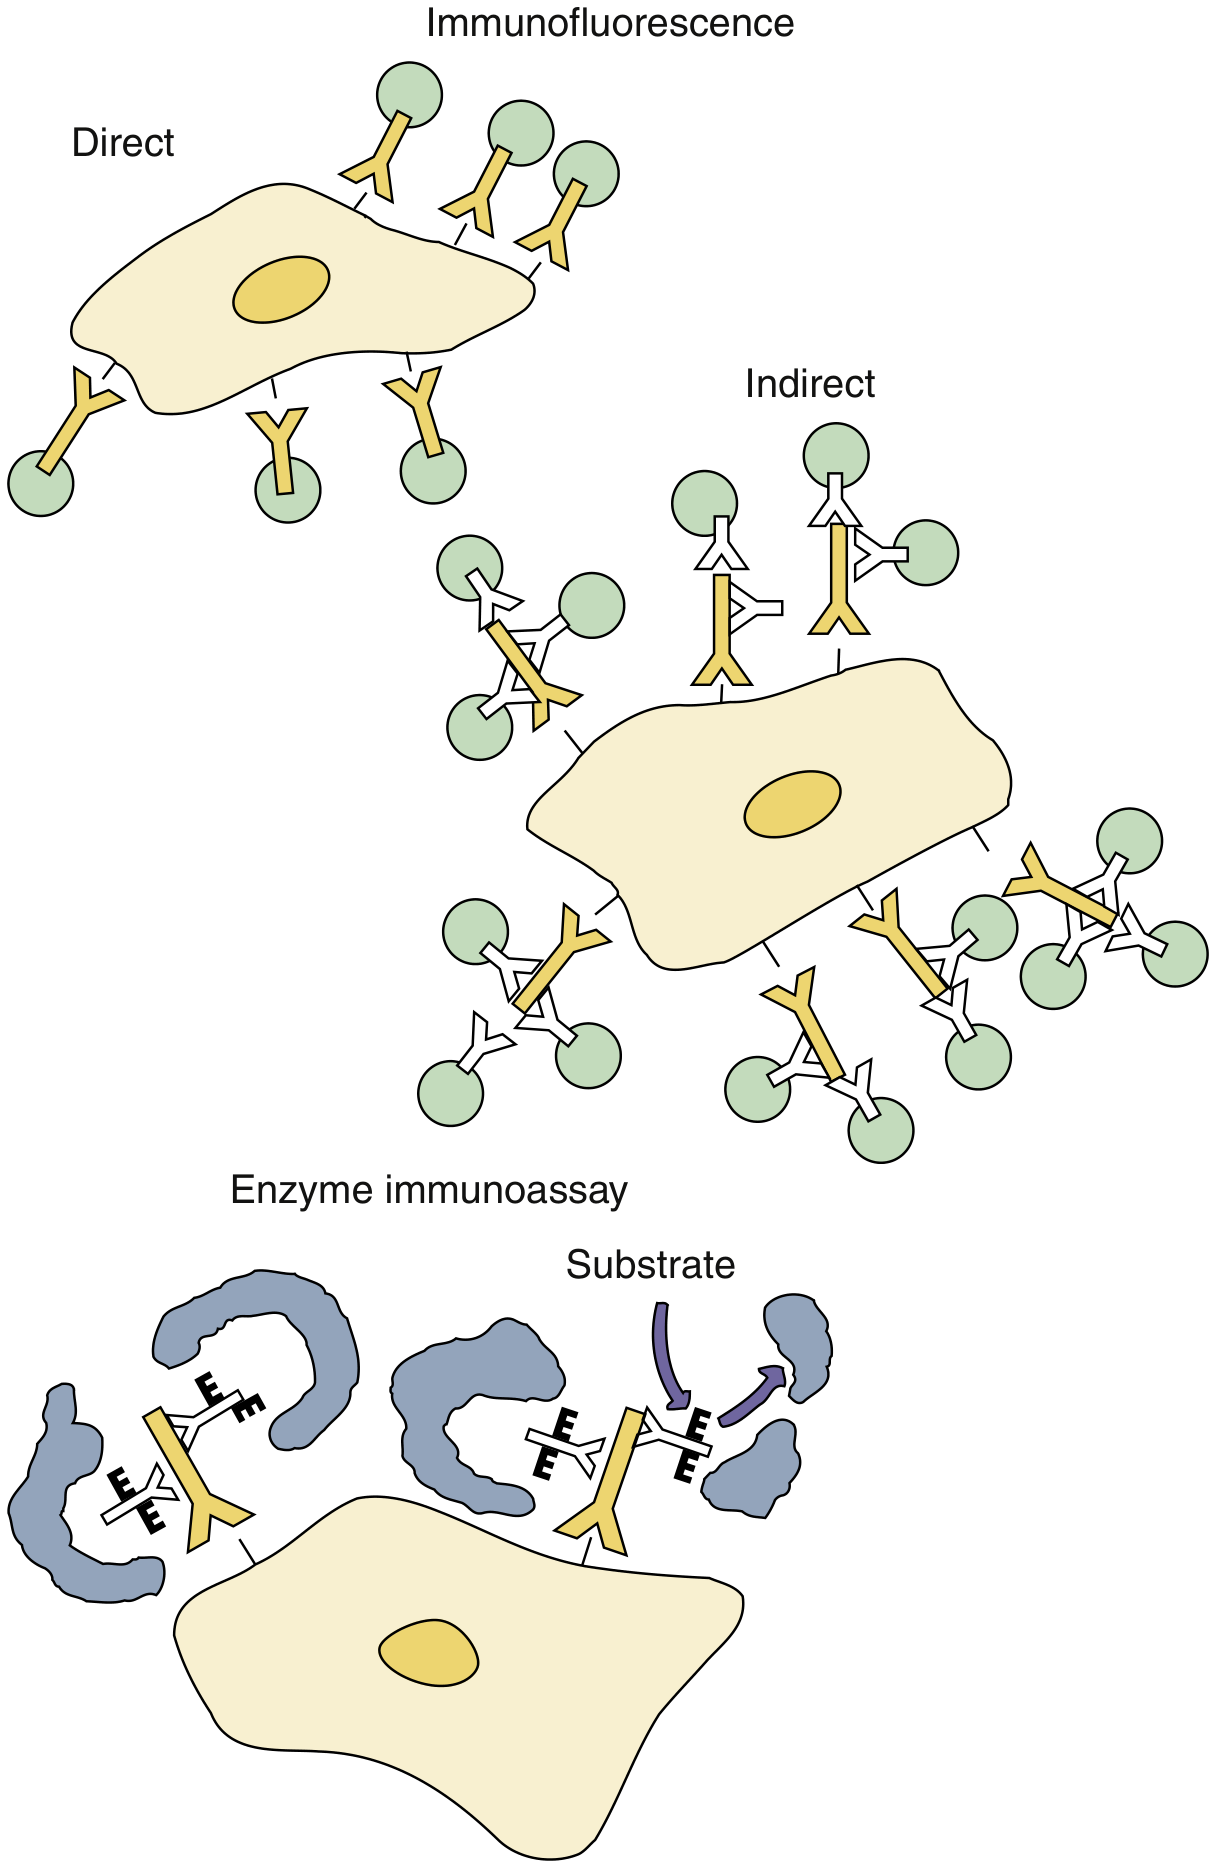
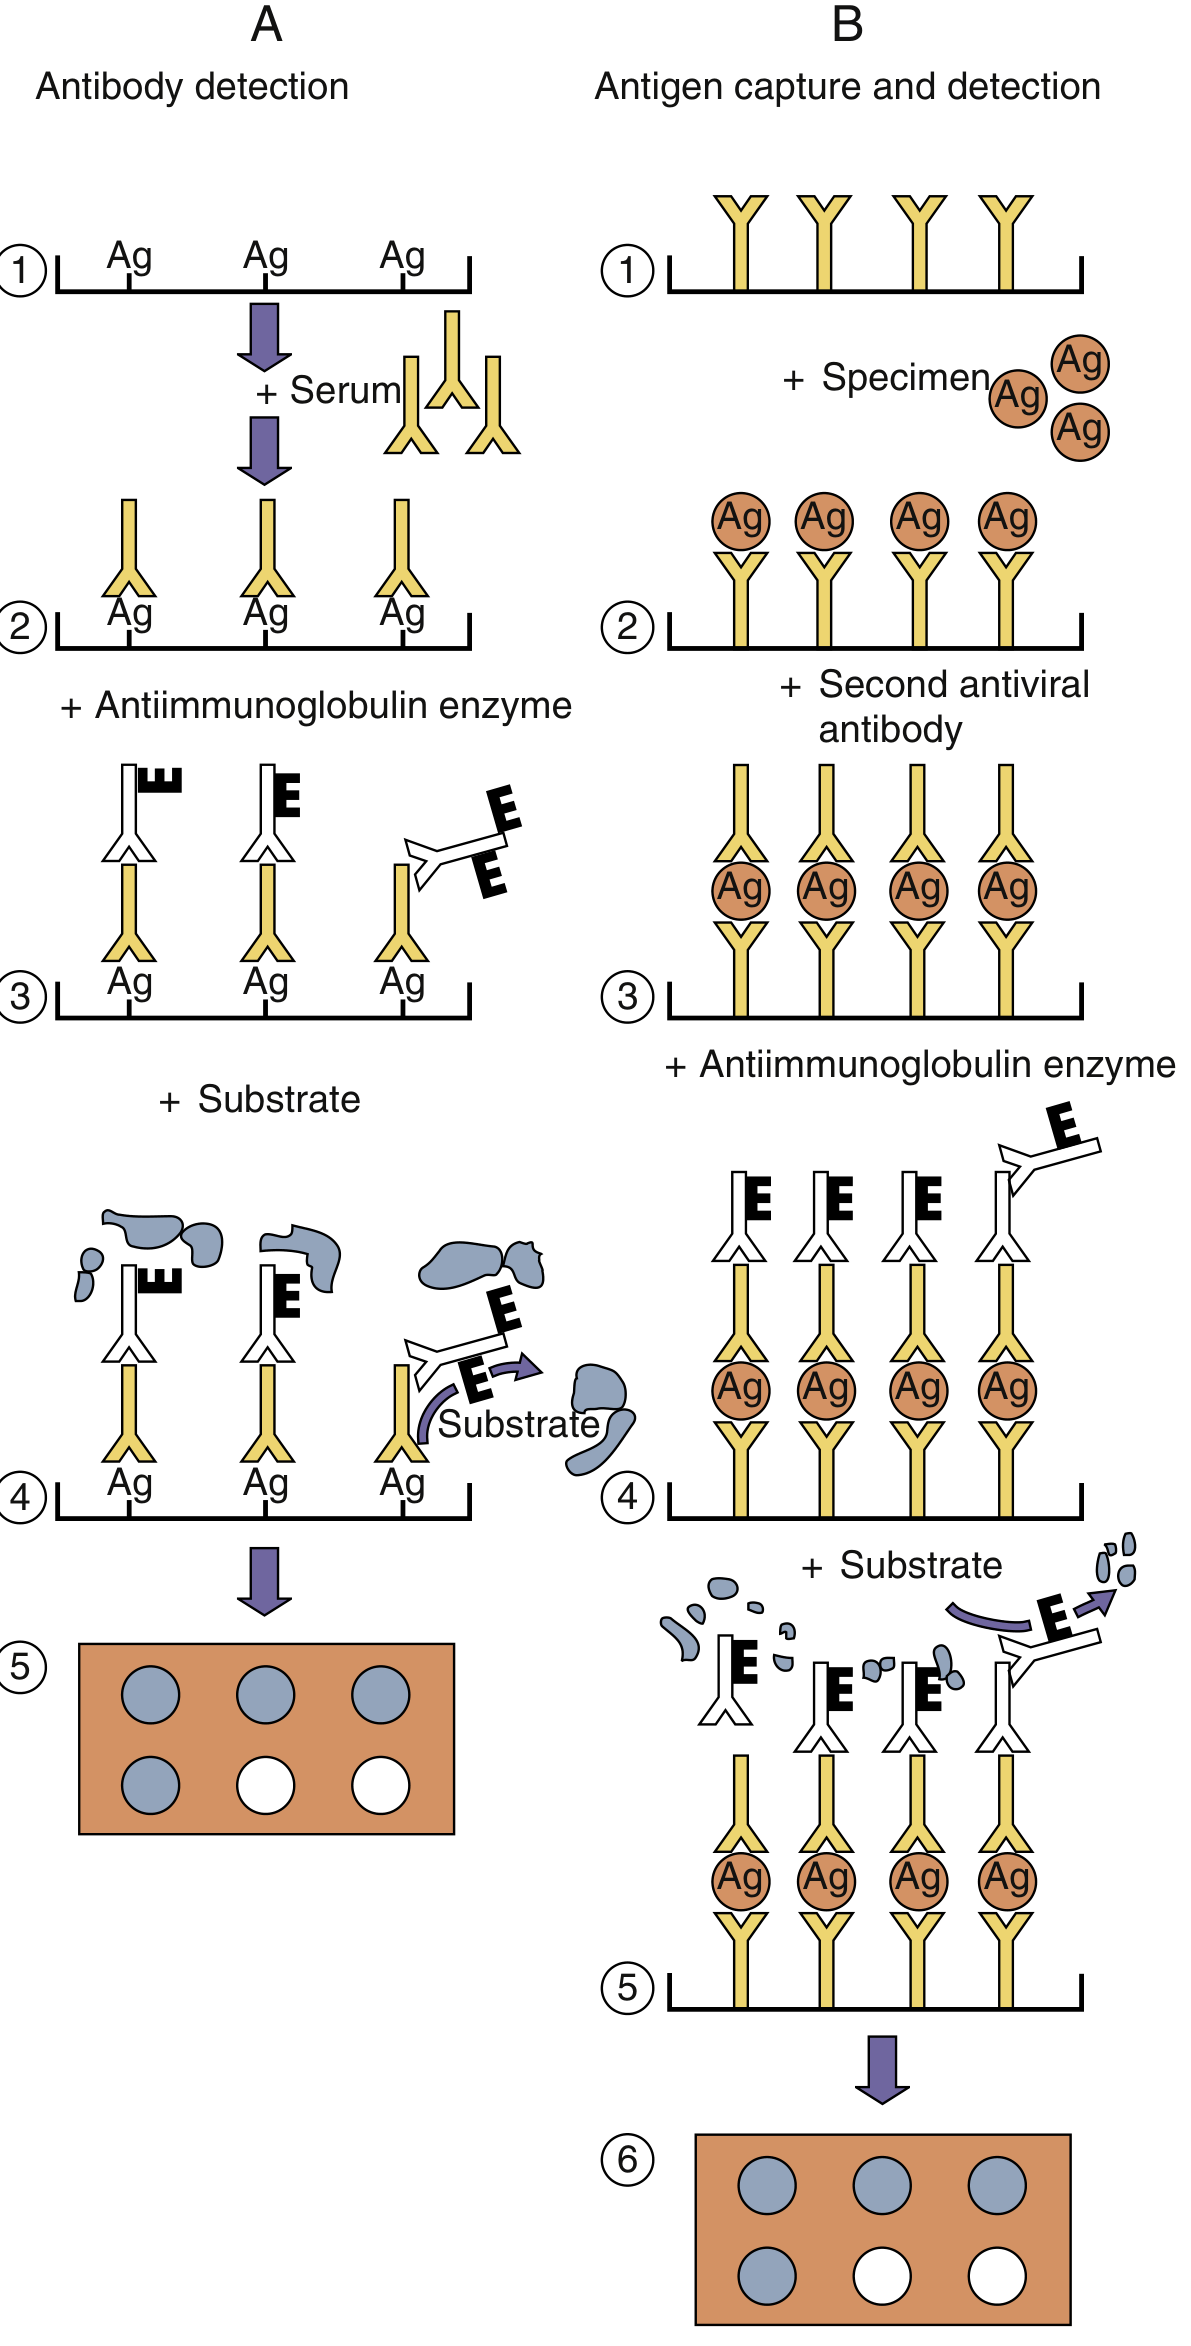
6. ELISA (Enzyme-Linked Immunosorbent Assay)
- Indirect ELISA - detects patient antibody (e.g., anti-HIV antibodies)
- Sandwich (Antigen capture) ELISA - detects antigens (e.g., rotavirus antigen in stool)
- Competitive ELISA - detects antigen by competition with labeled antigen
7. Radioimmunoassay (RIA)
8. Western Blot (Immunoblotting)
- Antigens are separated by SDS-PAGE (electrophoresis by molecular weight)
- Transferred (blotted) onto nitrocellulose membrane
- Patient serum is applied - antibodies bind to specific bands
- Enzyme-linked anti-Ig antibody + substrate reveals bands
- Confirmation of HIV seropositivity (confirmatory test after ELISA screening)
- Lyme disease (Borrelia burgdorferi antibody confirmation)
- Herpes diagnosis
9. Coombs Test (Antiglobulin Test)
| Test | Method | Use |
|---|---|---|
| Direct Coombs (DAT) | Patient's RBCs are washed, then Coombs reagent (anti-Ig Ab) is added directly | Detects antibodies already bound to patient's RBCs - used in autoimmune hemolytic anemia, HDN |
| Indirect Coombs (IAT) | Patient's serum is incubated with normal RBCs, then Coombs reagent added | Detects free antibodies in serum - used in cross-matching, antenatal screening |
Summary Table of All Serological Reactions
| Reaction | Basis | Key Examples |
|---|---|---|
| Precipitation | Lattice formation at equivalence | Ouchterlony, RID, countercurrent electrophoresis |
| Agglutination | Cross-linking of particulate antigens | Widal test, blood typing, latex agglutination |
| Complement Fixation | Complement consumed by Ag-Ab complex | Viral/fungal antibodies, Mycoplasma |
| Neutralization | Ab blocks biological activity | Viral neutralization, antitoxin titers |
| Immunofluorescence | Fluorescent-tagged Ab detects Ag | Rabies, HSV in tissue, ANA |
| ELISA | Enzyme-linked Ab + substrate color change | HIV, HBsAg, rotavirus Ag |
| RIA | Radiolabeled Ab | Hormones, HBsAg (historical) |
| Western Blot | Electrophoresis + blotting + Ab detection | HIV confirmation, Lyme disease |
| Coombs Test | Anti-Ig Ab detects RBC-bound Ab | Hemolytic anemia, cross-matching |
Important Points for Exams
- Prozone phenomenon: False-negative agglutination due to antibody excess (all binding sites saturated, no cross-linking); corrected by diluting the serum.
- Equivalence zone: Optimal antigen-to-antibody ratio where maximum precipitation/agglutination occurs.
- Sensitivity order: RIA = ELISA > Immunofluorescence > Precipitation > Agglutination
- ELISA vs RIA: Both very sensitive; ELISA uses enzyme label, RIA uses radioactive label; ELISA preferred due to safety.
- Complement fixation - positive result means NO hemolysis (complement was fixed by Ag-Ab complex).
- Western blot is a confirmatory test, not a screening test.
- Coombs test - Direct tests cells (in vivo sensitization); Indirect tests serum (in vitro sensitization).