
Anemia and all types structure from basic to clinical
anemia classification types peripheral blood smear
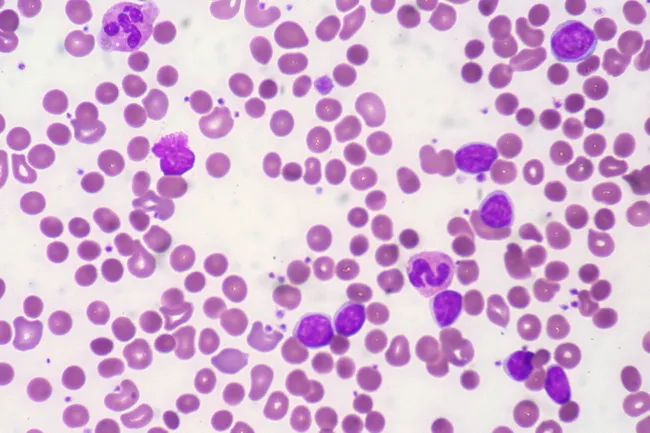
Peripheral blood smear from a patient with known chronic lymphocytic leukemia (CLL) showing autoimmune hemolytic anemia (AIHA). Brightfield microscopy of Wright-Giemsa stained smear at 1000x (oil immersion) reveals two dominant cell populations: numerous small mature lymphocytes typical of CLL and red blood cells showing spherocytic deformation. A smudge cell is evident just left of center, a classical clue for CLL. Red cells display reduced central pallor consistent with spherocytes, indicating intravascular or extravascular hemolysis driven by autoantibodies. The background shows mild polychromasia and rare nucleated RBCs, consistent with a robust reticulocyte response; the corrected reticulocyte count in this case is markedly elevated (>7%). Platelets are not significantly abnormal. These features collectively support autoimmune destruction of erythrocytes in the setting of CLL. Diagnostic significance lies in recognizing AIHA as a common autoimmune complication in CLL, with a clinical picture of sudden Hb decline and compensatory erythropoiesis. Differential considerations include drug-induced hemolysis, other causes of hemolytic anemia, or marrow infiltration by CLL. Clinical correlation includes therapy implications (steroids, rituximab) and close monitoring of hemolysis markers. This image is a valuable teaching resource for hematology morphology, AIHA in CLL, and differential diagnosis in anemia.
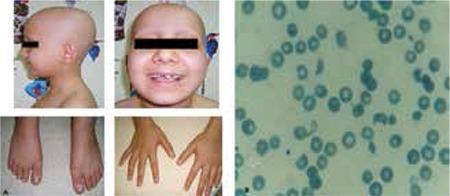
This composite image consists of clinical photographs and a diagnostic peripheral blood smear. Figure 1a (left) shows a pediatric patient with clinical signs including total alopecia (complete absence of scalp hair) and nail pitting affecting both hands and feet, characterized by small punctate depressions on the nail plates. Figure 1b (right) is a microscopic view of a peripheral blood smear demonstrating microangiopathic hemolytic anemia. Visible are numerous schistocytes—fragmented, irregular red blood cells including helmet cells and triangular forms—alongside some normal erythrocytes showing central pallor. The educational focus is on the multi-systemic manifestations of a medical condition, likely a microangiopathic process such as Hemolytic Uremic Syndrome (HUS) or similar systemic pathology, illustrating the correlation between dermatological signs (hair and nail changes) and hematological abnormalities (hemolysis and schistocytosis).
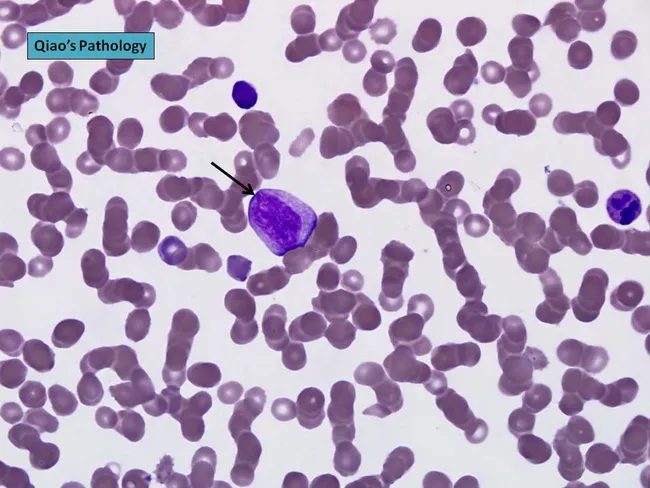
Comprehensive description: Brightfield light microscopy image of a peripheral blood smear stained with Wright-Giemsa, captured at high magnification to visualize circulating plasma cells. The central plasmablast shows an enlarged, irregular nucleus with a prominent nucleolus; the cytoplasm is moderately basophilic. This cell appears larger than surrounding erythrocytes and is consistent with malignant plasma cells typical of plasma cell leukemia. The background demonstrates rouleaux formation of red blood cells, a common feature in paraproteinemias due to increased serum proteins. The smear illustrates plasmacytosis that, when exceeding 20% of leukocytes, supports a diagnosis of plasma cell leukemia. In PCL, neoplastic plasma cells may be CD56 negative and often secrete monoclonal immunoglobulin with IgD or IgE isotypes or light-chain restriction; cytogenetic abnormalities are frequently observed. Morphology alone cannot definitively distinguish PCL from aggressive myeloma; immunophenotyping and cytogenetic studies are essential for precise classification. This image is valuable for hematology education, cytology review, and discussions of malignant plasma cell disorders, including primary versus secondary PCL, and their prognostic significance. Potential clinical utilities include morphologic confirmation in suspected PCL, training in recognition of plasmablasts, and correlation with CBC abnormalities and clinical features such as anemia, thrombocytopenia, lymphadenopathy, and organomegaly.
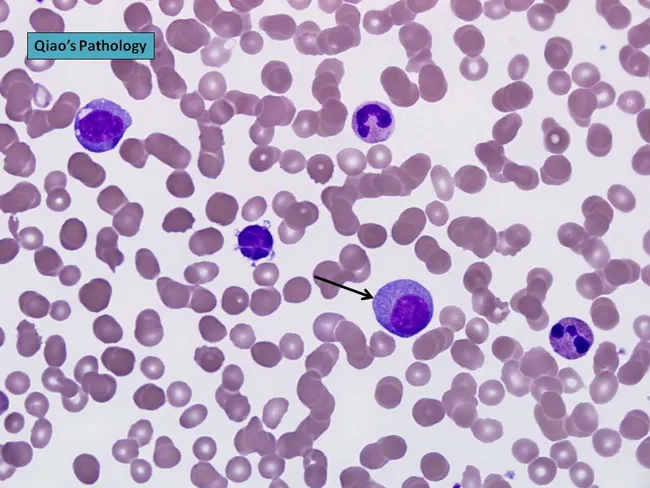
Peripheral blood smear prepared with Wright-Giemsa stain and examined under brightfield illumination using a 100× oil immersion objective reveals a single large plasma cell among a field of mature erythrocytes. The plasma cell displays features typical of clonal plasma cells: basophilic cytoplasm, an eccentrically placed round nucleus, and a conspicuous perinuclear hof; background shows rouleaux formation of red cells. This image exemplifies hematologic involvement by a plasma cell dyscrasia. In plasma cell leukemia, circulating plasma cells constitute more than 20% of leukocytes, a hallmark distinguishing it from conventional multiple myeloma, although both conditions share monoclonal plasma cell proliferation. The presence of circulating plasma cells is associated with younger patient age, higher incidence of anemia, thrombocytopenia, organomegaly, and possible lymphadenopathy; however lytic bone lesions may be less common. Immunophenotypic patterns often include lack of CD56 expression relative to myeloma. Clinically, this morphological finding warrants confirmation with complete blood count, peripheral smear review, quantitative plasma cell percentage, serum protein electrophoresis, and immunofixation to identify monoclonal immunoglobulin isotype (IgD/IgE or light-chain predominance). Early detection of circulating plasma cells supports prognosis assessment and guides therapy decisions in plasma cell dyscrasia management and monitoring, including risk stratification and treatment response evaluation for practice in clinics.
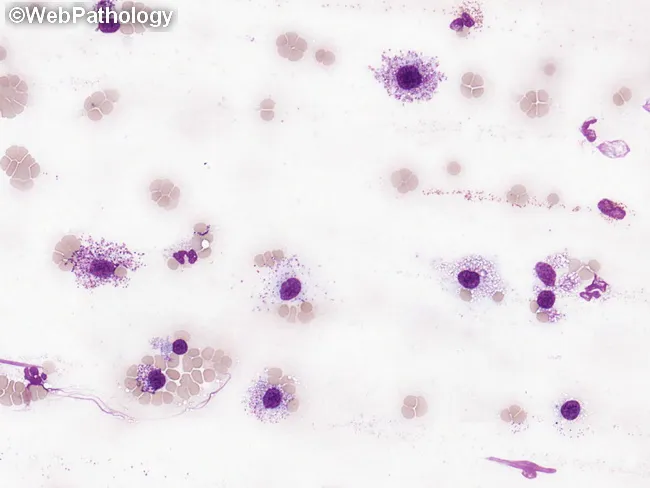
This peripheral blood smear was prepared and stained with Wright-Giemsa and examined by bright-field light microscopy to assess circulating hematopoietic cells in suspected systemic mastocytosis (SM). The smear shows rare, but conspicuous, mast cells with round to polygonal shapes and abundant cytoplasmic granules that impart a deep purple, metachromatic appearance. Nuclei are generally round to ovoid and may be slightly irregular or bilobed in some cells; granules occupy most of the cytoplasm and may obscure nuclear detail. The surrounding leukocytes include eosinophils and neutrophils, and the erythrocyte background is normocytic with occasional anisocytosis. In SM, circulating mast cells are typically infrequent; when they constitute a substantial fraction of leukocytes (≥10%), the finding is highly suggestive of mast cell leukemia (MCL). The image exemplifies an increased mast cell burden consistent with aggressive SM or MCL, often accompanied by cytopenias such as anemia or thrombocytopenia and potential associated hematologic neoplasms (e.g., CMML, MDS/MPN). This morphologic snapshot supports integration with phenotypic assays (CD117/c-KIT), flow cytometry, and molecular testing for KIT mutations, to establish diagnosis, prognostication, and therapeutic planning. Relevant keywords: systemic mastocytosis, mast cell leukemia, circulating mast cells, metachromatic granules, Wright-Giemsa, toluidine blue, KIT D816V, CD117, SM-AHN. This description emphasizes morphology guiding diagnosis appropriately.
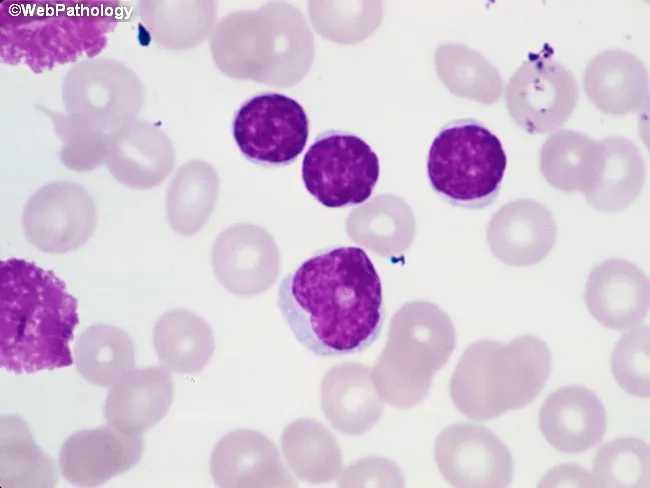
Imaging Modality: Brightfield light microscopy of a Wright-Giemsa stained peripheral blood smear. The primary subject is leukocytes from circulating blood, with focus on small mature-appearing lymphocytes and rare prolymphocytes. At center-right, several lymphocytes exhibit condensed chromatin and scant cytoplasm, consistent with chronic lymphocytic leukemia (CLL) morphology. Along the left edge, characteristic smudge cells are visible, reflecting fragile lymphocytes commonly seen in CLL. A prolymphocyte located just below center presents with slightly irregular nuclear contours, more dispersed chromatin, a prominent nucleolus, and modestly increased cytoplasm. In CLL, prolymphocytes usually comprise less than 2% of neoplastic cells; when 10–15%, the term atypical CLL is used and carries implications of aberrant immunophenotype, cytogenetic abnormalities, cytopenias, refractoriness to therapy, and worse prognosis. If prolymphocytes predominate, consideration should be given to B-cell prolymphocytic leukemia. This image demonstrates key diagnostic features including lymphoid morphology, prolymphocytic variant, and smear artifacts. Clinically, these findings correlate with lymphocytosis and potential anemia or thrombocytopenia in affected patients. Definitive characterization requires ancillary testing such as flow cytometry, immunophenotyping, and cytogenetics. The morphology supports a differential diagnosis that includes CLL with prolymphocytic transformation, atypical CLL, and B-PLL, guiding prognosis and treatment planning.
iron deficiency anemia microcytic hypochromic blood smear
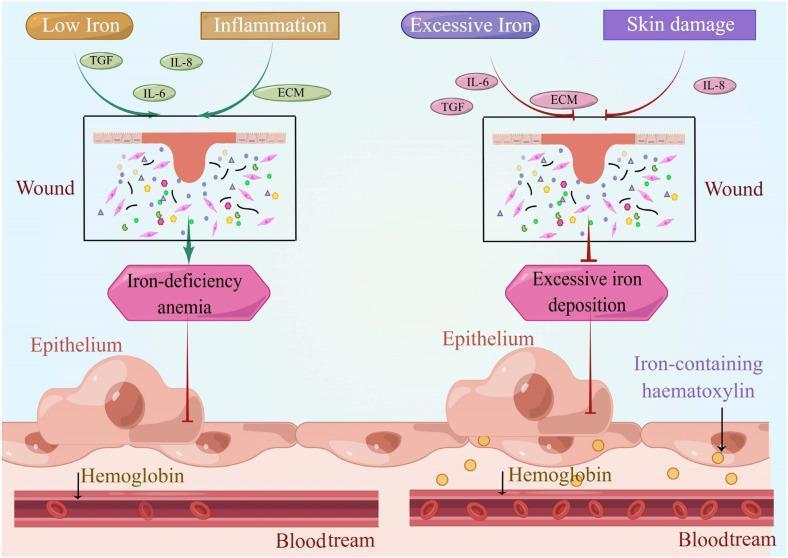
A comparative medical illustration detailing the effects of iron dysregulation on wound healing and systemic states. The left panel depicts a 'Low Iron' and 'Inflammation' scenario where a cutaneous wound is associated with 'Iron-deficiency anemia'. Key signaling molecules shown include TGF, IL-6, IL-8, and ECM components within a wound bed containing fibroblasts and matrix elements. An arrow indicates the downstream impact on the underlying epithelium and hemoglobin within the bloodstream. The right panel depicts an 'Excessive Iron' and 'Skin damage' scenario characterized by 'Excessive iron deposition'. This state is visually distinguished by an inhibitory symbol (red T-bar) directed at the epithelium, suggesting impaired regenerative capacity. Notably, the epithelium in the high-iron state contains yellow granules labeled as 'Iron-containing haematoxylin' (hemosiderin), which serve as a histological marker of iron overload. Both panels show the anatomical relationship between the cutaneous wound, underlying epithelial cells, and the intravascular space (bloodstream) containing red blood cells and hemoglobin, illustrating how iron homeostasis is critical for normal dermatological repair and systemic oxygen transport.
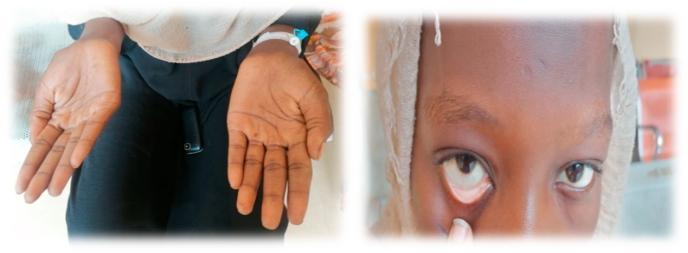
This composite clinical photograph illustrates common physical examination findings associated with severe anemia. The left panel shows the bilateral palms of a patient, demonstrating marked palmar pallor. The skin on the palms and creases appears significantly lighter and lacks the typical pinkish hue of healthy vascularized tissue, suggesting reduced hemoglobin concentration. The right panel is a close-up of the patient's face with the lower eyelid retracted to reveal the palpebral conjunctiva. Instead of the normal vibrant red or pink color, the conjunctiva exhibits conjunctival pallor, appearing whitish or very pale pink. These visual signs are critical diagnostic markers in hematology and general medicine for identifying systemic conditions such as iron-deficiency anemia or other forms of chronic blood loss. The image serves as a teaching tool for medical students and clinicians to recognize mucosal and cutaneous indicators of decreased red blood cell mass or oxygen-carrying capacity.
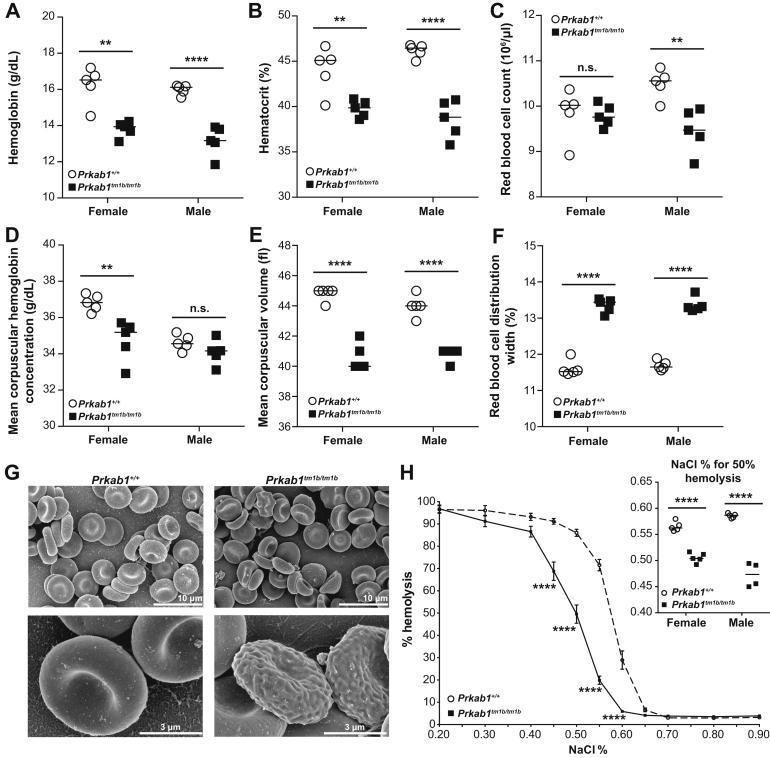
Educational figure illustrating hematological abnormalities in a murine model of Prkab1 deficiency, serving as a surrogate for studying human hemolytic anemia and microcytosis. Panels A-F present dot plots of hematological indices for wild-type (Prkab1+/+) and deficient (Prkab1tm1b/tm1b) mice, showing significant reductions in hemoglobin (A), hematocrit (B), and mean corpuscular volume (E), with a concomitant increase in red blood cell distribution width (F), indicating microcytic anemia with anisocytosis. Panel G contains high-resolution Scanning Electron Microscopy (SEM) images comparing erythrocyte morphology; wild-type cells show standard biconcave discocyte morphology, whereas Prkab1-deficient cells exhibit poikilocytosis with numerous abnormal forms, including acanthocytes, schistocytes, and echinocytes with irregular surface protrusions. Panel H displays an osmotic resistance curve, where Prkab1-deficient erythrocytes demonstrate a left-ward shift, signifying increased osmotic resistance (delayed hemolysis) compared to wild-type controls. The inset confirms a lower NaCl percentage required for 50% hemolysis in deficient cells, indicating altered membrane stability.
sickle cell anemia hemoglobin sickling RBC morphology
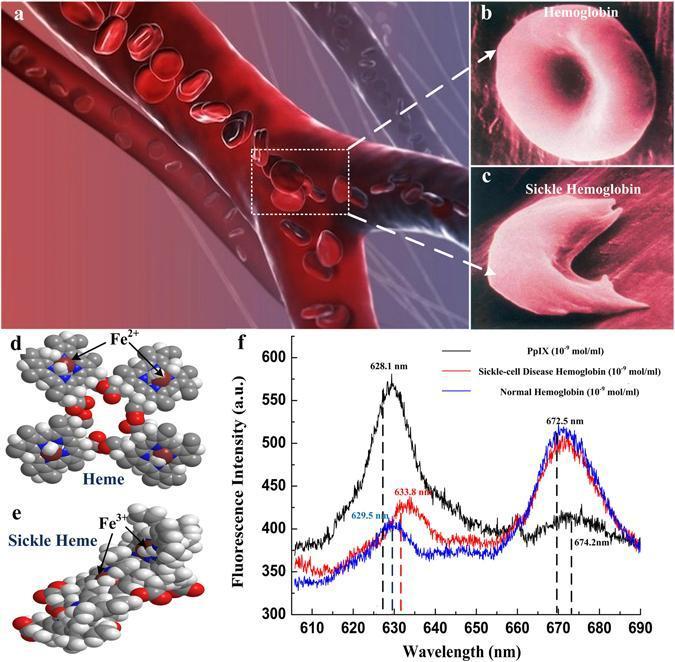
A multi-panel medical illustration and data graphic comparing normal hemoglobin and sickle cell disease (SCD) hemoglobin. (a) A 3D schematic of a bifurcating blood vessel showing the movement of red blood cells. (b, c) Magnified views contrasting the flexible, biconcave disc morphology of normal hemoglobin with the rigid, elongated, crescent or sickle shape characteristic of SCD hemoglobin, illustrating the mechanism for vascular occlusion. (d, e) Ball-and-stick molecular models detailing Heme (with Fe2+) and Sickle Heme (associated with Fe3+), emphasizing structural differences at the molecular level. (f) A comparative fluorescence spectrum plot showing Protoporphyrin (black), Sickle-cell Disease Hemoglobin (red), and Normal Hemoglobin (blue) across wavelengths of 610–690 nm. The graph highlights diagnostic spectral shifts: Protoporphyrin peaks at ~628.1 nm, while hemoglobin variants show distinctive primary peaks at ~672.5 nm and secondary peaks showing shifts (629.5 nm for normal vs. 633.8 nm for sickle). This composite image serves to correlate clinical hematology, cellular morphology, and molecular spectroscopy in the study of Sickle Cell Anemia.
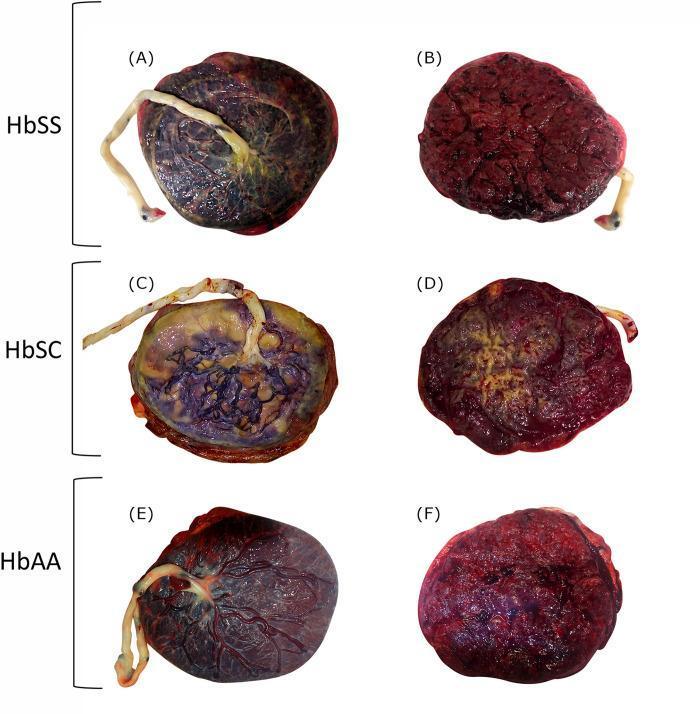
This clinical photograph displays a comparative gross pathological examination of human placentas categorized by maternal hemoglobin genotype: sickle cell anemia (HbSS), sickle cell hemoglobin C disease (HbSC), and normal adult hemoglobin (HbAA/Control). The image is arranged in a grid showing both fetal sides (left column: A, C, E) and maternal sides (right column: B, D, F). Panels A and B (HbSS): The fetal side shows prominent, congested vasculature and subchorionic fibrin deposition. The maternal side exhibits a deep, dusky red color with a rough, nodular texture. Panels C and D (HbSC): These display significant gross abnormalities, including extensive yellowish-white plaques of subchorionic fibrin deposition covering approximately 50% of the fetal surface. The maternal side shows lighter, gritty areas indicative of calcifications. Panels E and F (HbAA): The control placenta shows a healthy, glistening fetal surface with distinct, regular branching vessels and a uniform, dark red maternal surface with smooth cotyledons. This comparison illustrates placental manifestations of Sickle Cell Disease (SCD), highlighting pathological changes such as increased fibrin deposition and calcification associated with maternal hematological conditions.
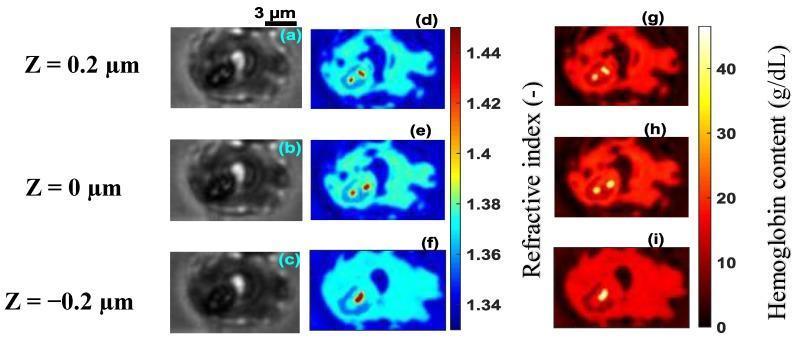
Microscopic analysis of a human red blood cell (RBC) infected with Plasmodium falciparum at the schizont stage. The image presents a 3x3 grid comparing brightfield images (a–c), reconstructed 3D refractive index (RI) distributions (d–f), and hemoglobin content maps (g–i) across three z-planes (z = 0.2 μm, 0 μm, and -0.2 μm). The brightfield images show a distorted cell morphology consistent with advanced parasitic infection. The refractive index maps (d–f) utilize a color scale from 1.34 to 1.44; high RI focal points (yellow-red, RI > 1.42) identify localized hemozoin crystals, the byproduct of hemoglobin digestion. The hemoglobin content maps (g–i) use a quantitative color scale from 0 to 45 g/dL, highlighting asymmetric, depleted hemoglobin distribution (red-to-yellow) compared to healthy RBCs. Spatial variations across the z-planes demonstrate the heterogeneous internal structure of the parasitized cell, including the presence of multiple merozoites and metabolic waste within the host cytoplasm. This visualization is used in hematology and infectious disease research to quantify biochemical and morphological changes during the intra-erythrocytic cycle of malaria.
megaloblastic anemia hypersegmented neutrophil macrocyte bone marrow
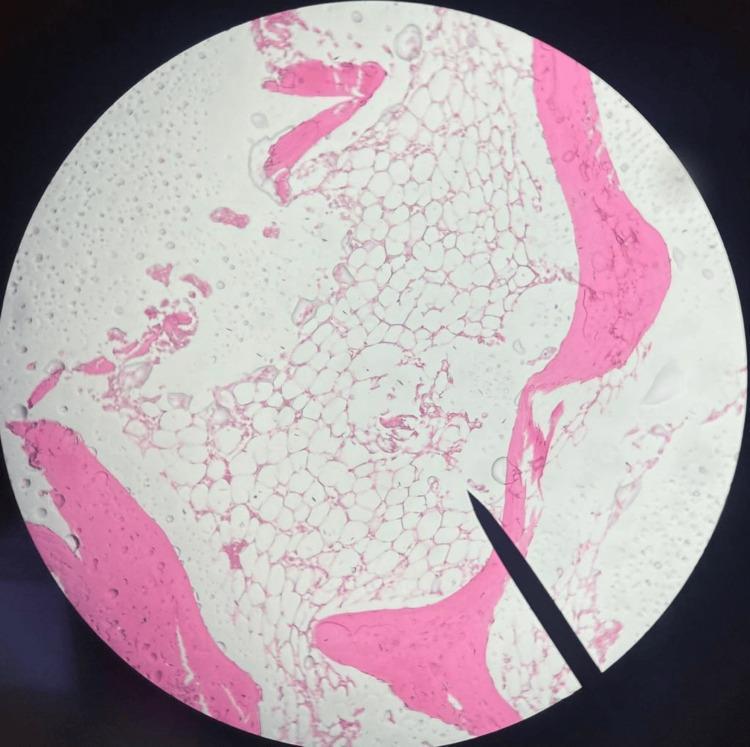
This diagnostic image is a low-magnification light microscopy photomicrograph of a bone marrow trephine biopsy, likely stained with hematoxylin and eosin (H&E). The specimen exhibits marked hypocellularity, a hallmark of severe aplastic anemia. The hematopoietic space is predominantly occupied by clear, vacuolated adipocytes (fatty marrow), with a notable absence of normal myeloid, erythroid, and megakaryocytic cell lines. Eosinophilic (pink) trabecular bone spicules are visible at the periphery and interspersed within the marrow cavity, providing structural context. The clinical significance of this finding is the demonstration of bone marrow failure, where the functional marrow has been replaced by adipose tissue. The absence of infiltrative abnormal cells or significant fibrosis is a key negative finding for differentiating this from myelodysplastic syndromes or myelofibrosis.
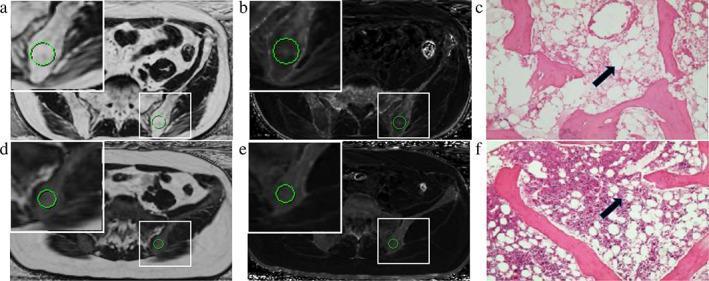
A multi-modal comparison of bone marrow characteristics between Aplastic Anemia (AA) and Myelodysplastic Syndromes (MDS). Panels A, B, D, and E show axial magnetic resonance (MR) images of the pelvis at the level of the left posterior superior ilium. Panels A and D are fat fraction (FF) maps, where the ROI in AA (A) displays significantly higher signal hyperintensity (86.98% FF) compared to MDS (D, 25.84% FF), indicating extensive fatty replacement of marrow. Panels B and E represent R2* maps used for iron content quantification (117.91 vs 147.98/second). Panels C and F provide corresponding H&E stained histological sections of the bone marrow. The AA section (C) demonstrates hypocellularity with a marked increase in large, clear adipocytes (black arrow) and sparse hematopoietic cells. In contrast, the MDS section (F) shows hypercellular marrow with higher hematopoietic cell density and fewer adipocytes (black arrow) amidst bone trabeculae. This composite image illustrates the clinical application of IDEAL-IQ MRI sequences in differentiating marrow failure syndromes by correlating quantitative imaging metrics with histopathological findings.
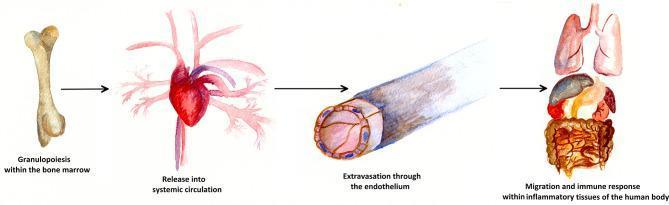
This medical illustration depicts the four primary stages of the neutrophil lifecycle using a linear progression diagram. Starting from the left, the first stage is 'Granulopoiesis within the bone marrow,' represented by an illustration of a long bone where neutrophil production occurs. An arrow leads to the second stage, 'Release into systemic circulation,' symbolized by an anatomical heart with branching vasculature. The third stage, 'Extravasation through the endothelium,' displays a detailed cross-sectional view of a postcapillary venule, showing the endothelial lining and the process of leukocytes exiting the vessel into the interstitium. The final stage on the right, 'Migration and immune response within inflammatory tissues of the human body,' illustrates various target organs, including the lungs, liver, and intestines, where neutrophils perform innate immune functions such as phagocytosis and chemotaxis. The illustration serves as an educational summary of hematopoiesis, vascular transit, and the localized inflammatory response.
Anemia: From Basic Concepts to Clinical Classification
Definition and Overview
- Hemoglobin (Hb) < 13.5 g/dL in adult males
- Hb < 12.0 g/dL in adult females
- Hb < 11.0 g/dL in pregnant women
Basic Physiology First
Normal RBC Lifespan
- Red cells live ~120 days, cleared by splenic macrophages
- Daily production = 200 billion RBCs from bone marrow erythroid precursors
- Erythropoietin (EPO) from renal peritubular cells is the main driver
- Hemoglobin A (adult) = 2α + 2β globin chains, each with a heme-iron core for O₂ binding
Key RBC Indices
| Index | Normal | Meaning |
|---|---|---|
| MCV | 80-100 fL | Size of RBC |
| MCH | 27-33 pg | Hb per cell |
| MCHC | 31-37 g/dL | Hb concentration |
| RDW | 11-15% | Size variation |
Master Classification Framework
Scheme 1: Pathophysiologic (Mechanism-Based)
- Decreased production (hypoproliferative)
- Increased destruction (hemolytic)
- Blood loss (acute or chronic)
Scheme 2: Morphologic (MCV-Based)
| Category | MCV | Key Causes |
|---|---|---|
| Microcytic | < 80 fL | IDA, thalassemia, ACD, sideroblastic |
| Normocytic | 80-100 fL | Acute blood loss, aplastic, hemolytic, ACD |
| Macrocytic | > 100 fL | B12/folate deficiency, liver disease, hypothyroid |
I. DECREASED PRODUCTION ANEMIAS
A. Iron Deficiency Anemia (IDA)
- Iron is critical for heme synthesis in hemoglobin
- Iron balance is regulated by hepcidin (liver peptide) acting on ferroportin in duodenal enterocytes
- When iron stores fall, hepcidin decreases → ferroportin increases → more iron absorbed
- Iron distribution in adults: Hb iron (2100 mg) >> storage ferritin/hemosiderin (1000 mg males, 400 mg females)
- Transferrin (plasma) carries iron to erythroid precursors via receptor-mediated endocytosis
- Dietary lack - vegetarianism, poverty, infants (low-resource regions)
- Impaired absorption - celiac disease, gastrectomy, proton pump inhibitors
- Increased requirement - pregnancy, rapid growth in infancy/adolescence
- Chronic blood loss - GI bleeding (most common cause in males), menorrhagia (females), hookworm
| Stage | Ferritin | Serum Iron | TIBC | Transferrin Sat | MCV/Hb |
|---|---|---|---|---|---|
| Storage depletion | Low | Normal | Normal | Normal | Normal |
| Iron-deficient erythropoiesis | Low | Low | High | Low | Normal |
| IDA | Very low | Very low | High | <15% | Low/Low |
- Pica (craving ice/clay), koilonychia (spoon nails), glossitis, angular stomatitis
- In pregnancy: Hb <11 g/dL is diagnostic; treat with 60-120 mg elemental iron daily in divided doses
- Failure to respond: check compliance, malabsorption, ongoing blood loss, or alternative diagnosis (thalassemia)
B. Megaloblastic Anemia (B12 / Folate Deficiency)
- Macro-ovalocytes (large oval RBCs without central pallor)
- Hypersegmented neutrophils (≥5 lobes in >5% of neutrophils, or any cell with ≥6 lobes)
- Megaloblasts in bone marrow
- Marked anisocytosis and poikilocytosis
- Elevated MCV (often >110 fL)
- Pancytopenia in severe cases
| B12 Deficiency | Folate Deficiency |
|---|---|
| Pernicious anemia (autoimmune, anti-IF antibodies) | Poor dietary intake (alcoholism, poverty) |
| Strict vegetarianism/veganism | Malabsorption (celiac, tropical sprue) |
| Gastrectomy (loss of parietal cells/IF) | Drugs: methotrexate, anticonvulsants, OCP |
| Ileal resection / Crohn's | Increased demand: pregnancy, hemolysis |
| Fish tapeworm, bacterial overgrowth | Hemodialysis |
- Serum B12 and folate levels distinguish the two
- Serum homocysteine: elevated in BOTH
- Methylmalonic acid (MMA): elevated ONLY in B12 deficiency
- Neurologic damage (subacute combined degeneration of cord): B12 deficiency ONLY
- Folate supplementation corrects hematologic but NOT neurologic B12 deficiency - always rule out B12 deficiency first
C. Anemia of Chronic Disease / Inflammation (ACD/AI)
- Inflammatory cytokines (IL-6, IL-1β, TNF) stimulate hepatic hepcidin production
- Elevated hepcidin inhibits ferroportin → iron trapped in macrophages, unavailable for erythropoiesis
- Reduced EPO response and reduced RBC lifespan
- Functional iron deficiency despite adequate (often high) iron stores
D. Aplastic Anemia
- Immune-mediated (majority): T-cell-mediated destruction of hematopoietic stem cells; immunosuppression restores hematopoiesis in 60-70%
- Intrinsic stem cell defect: Telomerase mutations → premature stem cell senescence (5-10% of cases); 50% have abnormally short telomeres
- Idiopathic (most common)
- Drugs/chemicals: chloramphenicol, benzene, chemotherapy, radiation
- Viral: parvovirus B19 (pure red cell aplasia), EBV, hepatitis
- Inherited: Fanconi anemia, dyskeratosis congenita
- Insidious anemia (weakness, pallor, dyspnea)
- Thrombocytopenia (petechiae, ecchymoses)
- Neutropenia (serious bacterial infections)
- NO splenomegaly (if present, reconsider diagnosis)
E. Myelophthisic Anemia
- Marrow infiltration by tumors (breast, lung, prostate cancer most common), granulomas, lipid storage disorders, or osteosclerosis
- Characteristic: leukoerythroblastosis (immature WBC + RBC precursors in blood), teardrop cells
- Treatment directed at underlying cause
F. Anemia of CKD
- Reduced EPO production by diseased kidneys
- Compounded by shortened RBC survival, iron/folate deficiency, marrow suppression from uremic toxins
- Treatment: recombinant EPO + iron supplementation
II. BLOOD LOSS ANEMIAS
Acute Blood Loss
- Loss of intravascular volume; >20% loss → cardiovascular collapse
- Initial CBC may look normal; hemodilution takes 2-3 days to show full anemia
- After 5-7 days: compensatory reticulocytosis (elevated EPO response)
- Morphology: normocytic, normochromic
Chronic Blood Loss
- Gradual iron store depletion → ultimately iron deficiency anemia (see above)
III. HEMOLYTIC ANEMIAS
General Lab Findings of Hemolysis:
- Elevated LDH, elevated indirect bilirubin
- Low haptoglobin (binds free Hb, consumed in hemolysis)
- Reticulocytosis
- Peripheral smear: polychromasia (large bluish reticulocytes)
| Feature | Extravascular | Intravascular |
|---|---|---|
| Site | Splenic macrophages | Within blood vessels |
| Splenomegaly | Yes | Less common |
| Jaundice | Yes (indirect bili) | Yes |
| Hemoglobinuria | No | Yes |
| Hemoglobinemia | No | Yes |
| Hemosiderinuria | No | Yes |
| Haptoglobin | Mildly low | Very low |
Hemolytic Anemia Classification:

INHERITED HEMOLYTIC ANEMIAS
1. Hemoglobin Defects (Hemoglobinopathies)
a. Sickle Cell Anemia (HbSS)
- Mutation: Single missense mutation in β-globin gene (glutamic acid → valine at position 6)
- Highest prevalence in malaria-endemic regions (heterozygous trait is protective against P. falciparum)
- Pathophysiology: HbS polymerizes under low O₂, acidosis, or dehydration → rigid sickled RBCs → vascular occlusion + hemolysis
- Vaso-occlusion → painful crises, stroke, acute chest syndrome, priapism, avascular necrosis
- Hemolysis → chronic hemolytic anemia, jaundice, pigment gallstones, aplastic crises (parvovirus B19)
- Dactylitis (hand-foot syndrome) in infancy
- Autosplenectomy → functional asplenia → encapsulated organism infections (Streptococcus, Salmonella osteomyelitis)
- Splenic sequestration crises
- Renal medullary infarction (papillary necrosis, hyposthenuria)
b. Thalassemias
- Mechanism: Quantitative reduction in α or β globin chain synthesis → chain imbalance → ineffective erythropoiesis and hemolysis
- Found predominantly in Mediterranean, Middle Eastern, and Southeast Asian populations
| Genotype | Deleted genes | Clinical |
|---|---|---|
| Silent carrier | 1 | Normal |
| α-Thal trait | 2 | Mild microcytosis |
| HbH disease | 3 | Moderate hemolytic anemia, HbH inclusions |
| Hydrops fetalis | 4 | Incompatible with life (Hb Barts = γ₄) |
| Type | Severity | Genetics |
|---|---|---|
| Thalassemia minor (trait) | Mild/asymptomatic | Heterozygous β⁺ or β⁰ |
| Thalassemia intermedia | Moderate | Various |
| Thalassemia major (Cooley's) | Severe, transfusion-dependent | Homozygous β⁰/β⁰ |
- Severe microcytic anemia (Hb 3-6 g/dL) within 1st year of life
- Massive hepatosplenomegaly (extramedullary hematopoiesis)
- Skeletal changes: "hair on end" skull X-ray (marrow expansion), chipmunk facies
- Iron overload (from transfusions + increased absorption) → liver cirrhosis, cardiac failure, endocrine failure
- Treatment: Regular transfusions + iron chelation (deferoxamine/deferasirox), curative HSC transplantation
2. Enzyme Defects
a. G6PD Deficiency
- X-linked recessive; most common enzymopathy (~400 million people worldwide)
- G6PD normally generates NADPH (via pentose phosphate pathway), protecting RBCs from oxidative damage
- Deficiency → oxidative stress → Heinz body (denatured Hb) formation → membrane damage → hemolysis
b. Pyruvate Kinase (PK) Deficiency
- Autosomal recessive; most common enzyme defect causing chronic (non-episodic) hemolytic anemia
- PK is required for ATP production in RBCs (anaerobic glycolysis)
- ATP depletion → loss of RBC membrane integrity → extravascular hemolysis
- Smear: Echinocytes (burr cells)
- Treatment: Splenectomy, mitapivat (PK activator - newer therapy)
3. Membrane Defects
a. Hereditary Spherocytosis (HS)
- Most common inherited hemolytic anemia in Northern Europeans
- Mutations in spectrin, ankyrin, band 3, or protein 4.2 (membrane scaffold proteins)
- Loss of membrane cytoskeleton tethering → membrane vesiculation → smaller, spherical RBCs
- Spherocytes cannot deform to pass splenic sinusoids → trapped + destroyed (extravascular hemolysis)
- Chronic hemolytic anemia
- Splenomegaly
- Jaundice (indirect hyperbilirubinemia)
- Pigment gallstones (bilirubin stones)
- Aplastic crises (parvovirus B19)
- Megaloblastic crises (increased folate demand)
- Osmotic fragility test (spherocytes lyse at higher NaCl concentrations)
- EMA (eosin-5-maleimide) binding test (flow cytometry - preferred)
- Negative DAT (Coombs test) - distinguishes from AIHA, which also shows spherocytes
b. Hereditary Elliptocytosis
- Defects in spectrin dimers → oval/elliptical RBCs
- Usually mild; severe forms (hereditary pyropoikilocytosis) can be significant
ACQUIRED HEMOLYTIC ANEMIAS
1. Autoimmune Hemolytic Anemia (AIHA)
| Type | Antibody | Temperature | Mechanism | Causes |
|---|---|---|---|---|
| Warm AIHA | IgG | 37°C | Extravascular (spleen) | Idiopathic, SLE, CLL, drugs (methyldopa) |
| Cold AIHA | IgM | 4°C (cooler extremities) | Intravascular (complement) | Mycoplasma pneumoniae, EBV, CLL |
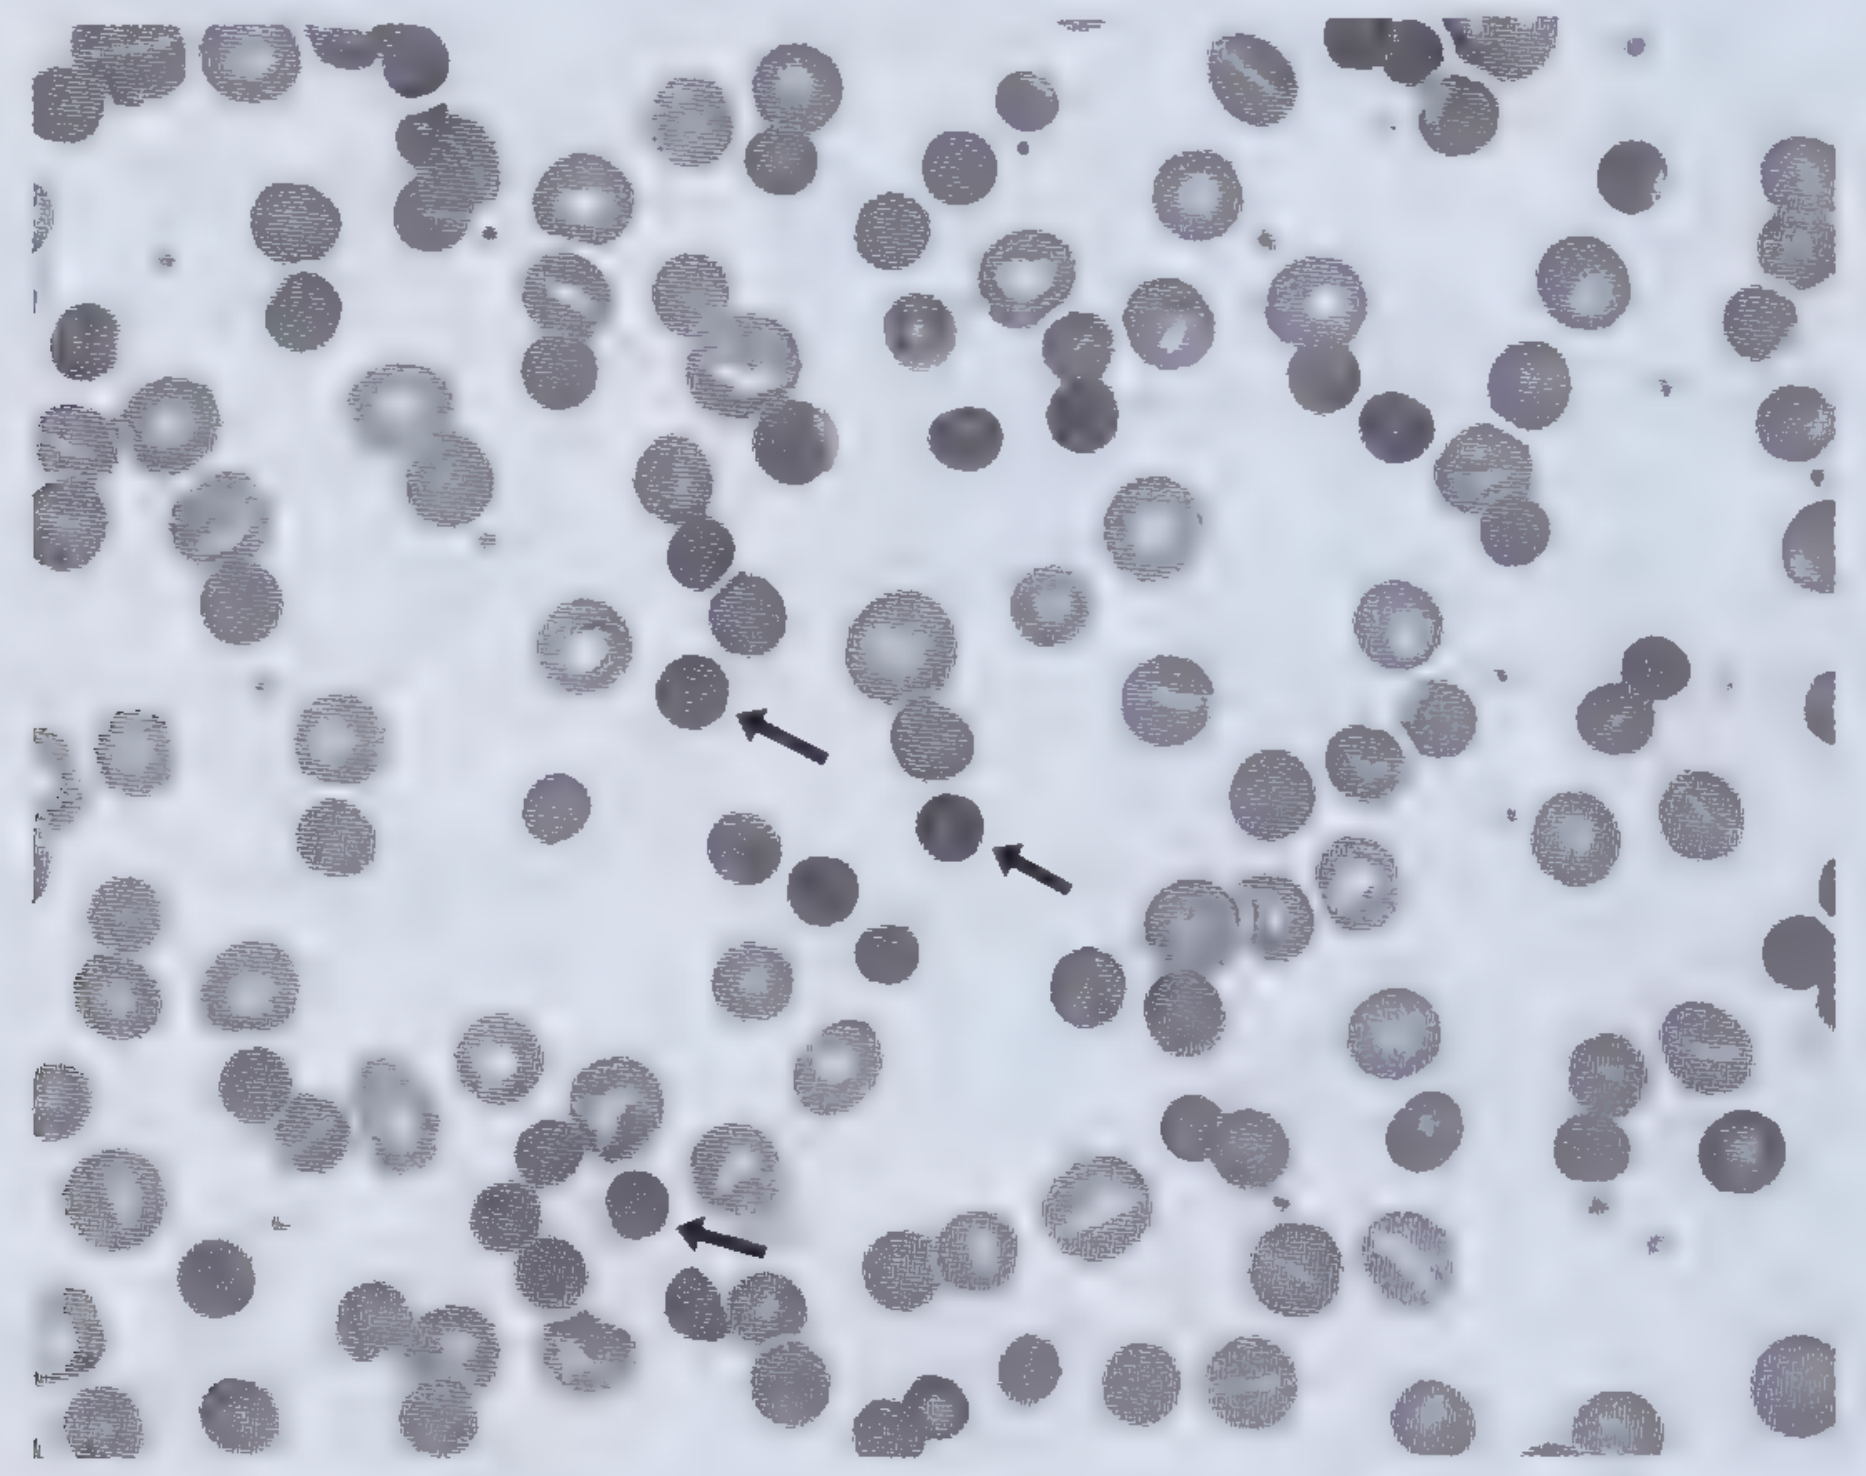
- Direct Antiglobulin Test (DAT/Coombs) - positive (detects antibody or complement on RBC surface)
- Spherocytes on peripheral smear
- Elevated LDH, low haptoglobin, reticulocytosis
2. Drug-Induced Immune Hemolytic Anemia
- Methyldopa - triggers AIHA directly
- Penicillin - drug coats RBC → antibody attacks drug-coated cell
- Cephalosporins - drug-dependent antibodies (hapten mechanism)
- Quinine - thrombotic microangiopathy
- Dapsone, primaquine - oxidative hemolysis (G6PD exacerbation)
3. Microangiopathic Hemolytic Anemia (MAHA)
- Mechanical fragmentation of RBCs passing through fibrin strands or damaged endothelium
- Smear: Schistocytes (helmet cells, fragmented RBCs) - pathognomonic
- Thrombotic Thrombocytopenic Purpura (TTP) - ADAMTS13 deficiency → vWF multimers → platelet-fibrin thrombi
- Hemolytic Uremic Syndrome (HUS) - Shiga toxin (E. coli O157:H7) → endothelial injury → renal predominance
- DIC
- Pre-eclampsia / HELLP syndrome
- Malignant hypertension
- Prosthetic heart valves
4. Paroxysmal Nocturnal Hemoglobinuria (PNH)
- Acquired clonal stem cell mutation in PIG-A gene → absence of GPI-anchored complement regulatory proteins (CD55, CD59) on RBC surface
- RBCs vulnerable to complement-mediated intravascular lysis, especially at night (slightly lower pH during sleep)
- Clinical triad: Intravascular hemolysis, thrombosis (Budd-Chiari, portal, cerebral), cytopenias
- Diagnosis: Flow cytometry (absent CD55/CD59 on RBCs and granulocytes)
- Treatment: Eculizumab (anti-C5 complement inhibitor) - very effective
5. Infectious/Other Acquired Causes
- Malaria (Plasmodium falciparum): intraerythrocytic parasite lyses RBCs → hemolysis, anemia
- Clostridium perfringens: lecithinase destroys RBC membrane → massive intravascular hemolysis
- Hypersplenism: pooling and destruction of RBCs in enlarged spleen
- Mechanical trauma (march hemoglobinuria): physical trauma to RBCs
Quick Reference Summary Table
| Anemia Type | MCV | Key Lab | Pathophysiology | Classic Finding |
|---|---|---|---|---|
| IDA | ↓ | Ferritin↓, TIBC↑ | Iron depletion | Pencil cells, koilonychia |
| ACD | N/↓ | Ferritin↑, TIBC↓ | Hepcidin↑ | Low serum Fe + low TIBC |
| Thalassemia | ↓ | Normal Fe studies | Globin chain imbalance | Targets, microcytosis |
| B12 deficiency | ↑ | MMA↑, homocysteine↑ | DNA synthesis failure | Hyperseg neutrophils, neurologic Sx |
| Folate deficiency | ↑ | Homocysteine↑, MMA normal | DNA synthesis failure | Hyperseg neutrophils, NO neurology |
| Aplastic anemia | N | Pancytopenia | Stem cell failure | Hypocellular marrow |
| Sickle cell | N | Hb electrophoresis | HbS polymerization | Sickle cells, vaso-occlusion |
| HS | N/↓ | MCHC↑, osmotic fragility↑ | Membrane scaffold defect | Spherocytes, DAT negative |
| AIHA | N | DAT positive, haptoglobin↓ | Anti-RBC antibodies | Spherocytes, DAT positive |
| MAHA (TTP/HUS) | N | Schistocytes, thrombocytopenia | Mechanical fragmentation | Schistocytes, helmet cells |
| PNH | N | CD55/CD59 absent (flow) | Complement sensitivity | Nocturnal hemoglobinuria |
| G6PD | N | G6PD enzyme assay | Oxidative hemolysis | Bite cells, Heinz bodies |
Clinical Approach Algorithm
Low Hb (Anemia confirmed)
│
├── MCV Low (<80 fL) → MICROCYTIC
│   ├── Ferritin low, TIBC high → IRON DEFICIENCY ANEMIA
│   ├── Ferritin normal/high, TIBC low → ANEMIA OF CHRONIC DISEASE
│   ├── Hb electrophoresis abnormal → THALASSEMIA
│   └── Ring sideroblasts on BM biopsy → SIDEROBLASTIC ANEMIA
│
├── MCV High (>100 fL) → MACROCYTIC
│   ├── Hyperseg neutrophils, low B12/folate → MEGALOBLASTIC
│   │   ├── Low B12 + MMA high → B12 deficiency
│   │   └── Low folate + MMA normal → Folate deficiency
│   └── No hyperseg neutrophils → Non-megaloblastic (liver disease, hypothyroid, alcohol, drugs)
│
└── MCV Normal (80-100 fL) → NORMOCYTIC
    ├── Reticulocytes HIGH → HEMOLYSIS or BLOOD LOSS
    │   ├── DAT positive → AIHA
    │   ├── Schistocytes → MAHA (TTP, HUS, DIC)
    │   ├── Spherocytes, DAT negative → Hereditary Spherocytosis
    │   ├── Sickle cells → Sickle Cell Disease
    │   └── Flow cytometry (CD55/CD59 absent) → PNH
    └── Reticulocytes LOW → HYPOPROLIFERATIVE
        ├── Pancytopenia, hypocellular BM → APLASTIC ANEMIA
        ├── Leukoerythroblastosis, teardrop cells → MYELOPHTHISIC
        ├── CKD + low EPO → RENAL ANEMIA
        └── Chronic disease context → ACD


The patient is again suffering from ascites... What should be further management. Explain the case and required treatment and diagnosis
decompensated alcoholic CLD recurrent ascites management guidelines 2025
refractory ascites cirrhosis management diuretics paracentesis
Case Summary: Shankar Balu Kurade, 46 yr, Male
What the Records Show
Patient Demographics
- Name: Shankar Balu Kurade, 46 years, Male
- Address: Kalmath, Kankavali, Sindhudurg
- Weight: 59.6 kg (22 July 2026), 61 kg (8 Aug 2026) - weight gain = likely fluid re-accumulation
Established Diagnosis (GMC Sindhudurg, Discharge 2 July 2026)
- Decompensated CLD - Alcoholic Liver Disease with gross ascites
- History: Chronic alcoholism (700g/day), abdominal distension >20 years (!), "chronic feed difficulty"
Clinical Picture at Previous Admission
| Parameter | Value | Interpretation |
|---|---|---|
| Hb | 5.9 g/dL | Severe anemia |
| WBC | 13,200/mm³ with 74% PMN | Leukocytosis (SBP risk?) |
| Platelets | 2,32,000 | Normal |
| BP | 110/70 mmHg | Low-normal (portal HTN) |
| Pulse | 114/min | Tachycardia |
| RR | 20/min | Mild tachypnea |
| SpO2 | 97% | Adequate |
| Abdomen | Grossly distended (PA: distended) | Grade 3 ascites |
| Icterus | Present | Hepatocellular dysfunction |
| Oedema | Present | Hypoalbuminemia |
| ECG | Normal | |
| Widal | Negative |
Current CBC (SAVI Lab, 22 July 2026)
| Test | Result | Reference | Interpretation |
|---|---|---|---|
| Hb | 8.20 g/dL | 14-18 | Moderate-severe anemia |
| HCT | 24.5% | 32-47% | Low |
| RBC | 3.1 M/cmm | 4.2-5.5 | Low |
| MCV | 79 fL | 78-100 | Borderline low |
| MCH | 26.45 pg | 27-33 | Low (hypochromic tendency) |
| WBC | 17,200/cmm | 4,000-10,000 | Leukocytosis |
| Neutrophils | 81% | 50-70% | Neutrophilia - infection/SBP? |
| Lymphocytes | 12% | 20-40% | Low (immunosuppressed) |
| Platelets | 2,14,000 | 1.5-4.5 L | Normal |
Current Prescriptions (Dr. Acharekar, 22 July & 8 Aug 2026)
- Syp. Hepanosyl OS 10ml TDS
- Tab. Silamyer 150 (Silymarin - Milk Thistle) OD evening - 10 tabs
- Cap. Sompraz 80 (Esomeprazole) - morning before food - 5 tabs
- Syp. Unizyme Plus 10ml TDS (digestive enzymes)
- Cap. Pantocid-DPR (Pantoprazole delayed release) every evening x15
- Tab. Sorbidol (Sorbitol - osmotic laxative) 1-0-1 x30
- Syp. Hepanorel-AC 10ml morning, 1ml evening, 1ml night
- Tab. Lacilactone 10 (Spironolactone 50mg/Furosemide 20mg) - 1/2-0-1/2 x20
- Syp. Sucra-Y (Sucralfate) 1cm TDS
- Tab. Rifaximin 400 - daily once x10
Clinical Analysis
This is Recurrent / Refractory Ascites
Key Concerns:
- This MUST raise concern for Spontaneous Bacterial Peritonitis (SBP)
- SBP occurs in ~25% of hospitalised cirrhotic ascites patients
- Can be present even without fever, abdominal pain, or clear signs
- Diagnostic paracentesis is mandatory - cannot be deferred
- Hb improved from 5.9 → 8.2 g/dL (with transfusions given in hospital)
- MCV borderline low + low MCH → mixed picture (IDA + ACD)
- Causes in this patient: chronic blood loss (varices?), iron deficiency, hypersplenism, bone marrow suppression from alcohol, folate deficiency (chronic alcoholism), hemodilution
- The discharge card advises Endoscopy - this is critical to check for oesophageal varices
- If varices are present, propranolol (Ciplar) must be continued - it was prescribed at discharge but does not appear in current prescription!
- Lacilactone 10 (Spironolactone 50mg + Furosemide 20mg) at half tablet = only 25mg spironolactone + 10mg furosemide - very low dose given the recurrent gross ascites
- Standard maximum doses: spironolactone 400mg/day, furosemide 160mg/day (ratio 100:40)
Further Management Plan
STEP 1 - Urgent Investigations Required NOW
| Investigation | Why |
|---|---|
| Diagnostic Paracentesis (with SAAG, PMN count, culture) | Rule out SBP - MANDATORY given WBC 17,200 + neutrophilia |
| Serum creatinine, urea, electrolytes (Na, K) | Baseline renal function; diuretic safety; hepatorenal syndrome |
| Serum albumin | Severity of hepatocellular failure |
| LFTs (bilirubin, ALT, AST, ALP, GGT) | Disease severity, hepatocellular damage |
| PT/INR | Coagulopathy - affects intervention risk |
| Blood glucose | Hypoglycemia in CLD |
| Serum sodium | Dilutional hyponatremia is common |
| Peripheral smear + reticulocyte count | Clarify anemia type |
| Serum iron, ferritin, TIBC | Iron deficiency component |
| Ultrasound abdomen with Doppler | Assess ascites volume, portal vein flow, splenomegaly, liver nodularity, HCC screening |
| EGD (Endoscopy) | Varices - was already advised; confirm if done |
| Child-Pugh / MELD score calculation | Prognosis + transplant eligibility |
STEP 2 - Treat/Rule Out SBP (Most Urgent)
- Start Inj. Ceftriaxone 2g IV OD (or Cefotaxime 2g IV 8-hourly) for 5-7 days
- IV Albumin 1.5 g/kg on day 1, then 1 g/kg on day 3 - significantly reduces hepatorenal syndrome and mortality (this is guideline-recommended)
- Current antibiotic regimen (Tab. Cefixime 200mg BD oral from discharge) is weak oral coverage - IV route is essential for SBP
- Empirical antibiotics should not wait for culture results
STEP 3 - Ascites Management (Stepped Approach)
- This is the single most effective intervention in alcoholic CLD
- Recompensation is achievable if alcohol is stopped
- Refer for de-addiction counseling, Disulfiram/Naltrexone if appropriate
- < 88 mmol sodium/day (< 2g/day salt) - no added salt diet
- High protein: 1.2-1.5 g/kg/day (do NOT restrict protein even if encephalopathic)
- High calorie: 30-35 kcal/kg/day
- Late evening carbohydrate snack (minimizes overnight starvation, prevents muscle catabolism)
- Thiamine and B-vitamin supplementation (already given)
| Drug | Starting | Target | Max |
|---|---|---|---|
| Spironolactone | 50-100 mg/day | 200 mg/day | 400 mg/day |
| Furosemide | 20-40 mg/day | 80 mg/day | 160 mg/day |
- Ratio 5:2 (spironolactone:furosemide) maintains normokalemia
- Monitor weight daily: target loss 0.5 kg/day without edema, 1 kg/day with edema
- Reduce/hold if serum creatinine rises, Na <120 mEq/L, or muscle cramps
- Add amiloride if hypokalemia develops
- This patient has Grade 3 (gross/tense) ascites that is symptomatic and recurrent
- LVP 5-6 litres should be performed with simultaneous IV Albumin 6-8g per litre removed
- This is evidence-based per 2025 AGA guidelines and prevents post-paracentesis circulatory dysfunction (PPCD)
- Repeat as needed - LVP is safe even in coagulopathy (do NOT correct INR routinely before paracentesis)
- If ascites is truly refractory (fails max diuretics + requires LVP >3 times/year): refer for TIPS evaluation
- Reduces portal pressure, controls ascites in ~75% cases
- Contraindicated if: bilirubin >3 mg/dL, INR >5, severe hepatic encephalopathy, heart failure, HCC
- Review per current evidence on refractory ascites PMID 35016859
STEP 4 - Manage Complications
- Continue Tab. Ciplar (Propranolol) - it was in the discharge card but is NOT in current prescriptions - THIS MUST BE RESTARTED
- Target HR: 55-60/min (currently 133/min - propranolol is clearly not being taken)
- If varices present on endoscopy: Endoscopic Variceal Band Ligation (EVBL) is gold standard
- Rifaximin 400mg already started - continue, dose should be 400mg BD or 550mg BD
- Lactulose (Sorbidol or Lacilactone syrup) - titrate to 2-3 soft stools/day
- Avoid sedatives, NSAIDs, high protein animal diet
- Once iron studies done: if iron deficient → oral ferrous sulfate 150-200mg elemental iron/day
- If severe anemia (<7g/dL) or symptomatic: packed RBC transfusion
- Folate supplementation (Tab. Folvite 5mg daily) - mandatory in alcoholic liver disease
- Tab. Norfloxacin 400mg OD (or Ciprofloxacin 500mg OD) as secondary prophylaxis
- Continue long-term in high-risk patients (ascitic protein <1.5g/dL, Child-Pugh ≥9, bilirubin ≥3)
STEP 5 - Definitive Treatment
- Decompensated alcoholic CLD with recurrent ascites = MELD score calculation is urgent
- MELD >15 → transplant evaluation should begin
- Requires 6 months documented alcohol abstinence (most centres)
- Refer to a hepatology/transplant centre for assessment
Drugs to AVOID in This Patient
| Drug | Why |
|---|---|
| NSAIDs (ibuprofen, diclofenac) | Worsen renal function, promote AKI |
| ACE inhibitors/ARBs | Hypotension, AKI |
| Aminoglycosides | Nephrotoxicity |
| Sedatives/opioids | Precipitate encephalopathy |
| Herbal hepatoprotectives (excessive silymarin) | Evidence weak; some hepatotoxic |
Summary - What Needs to Happen Right Now
| Priority | Action |
|---|---|
| Urgent | Diagnostic paracentesis + cell count + culture |
| Urgent | Serum creatinine, Na, K, albumin, LFTs, INR |
| Urgent | Rule out SBP - if confirmed, IV Ceftriaxone + IV Albumin |
| Today | LVP 5-6L + IV Albumin (6-8g per litre drained) |
| Restart | Propranolol (Ciplar) - was stopped; HR is now 133/min = dangerous |
| Uptitrate | Spironolactone (100mg) + Furosemide (40mg) and titrate up |
| Confirm | Whether endoscopy was done; if not, book urgently |
| Counsel | Absolute alcohol cessation - critical for recompensation |
| Screen | MELD score + transplant referral if applicable |
| Supplement | Folate, Thiamine, BCAA if encephalopathy-prone |
Note: This analysis is for clinical guidance and educational purposes. All management decisions must be made by the treating physician with direct patient assessment. The priority findings here - leukocytosis with neutrophilia (SBP risk), missing propranolol with HR 133/min, and subtherapeutic diuretic dosing - should be communicated to the treating team urgently.
What should I advise the patient now