
Make a histology and gross picture that include the CML
chronic myeloid leukemia CML histology bone marrow biopsy microscopy
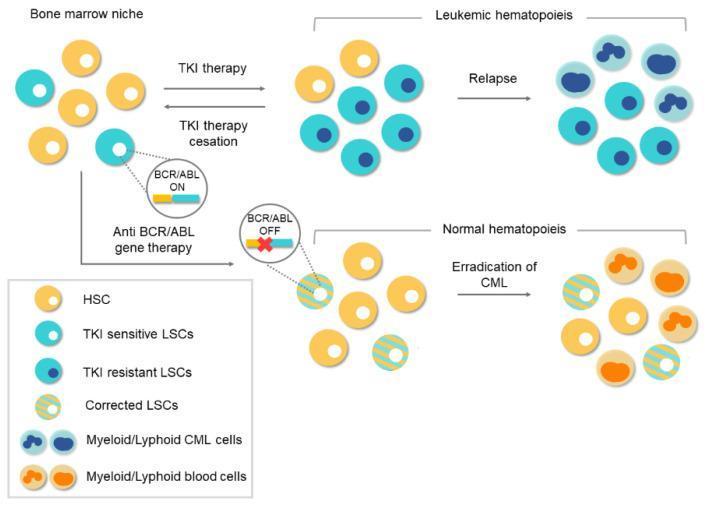
A comparative medical illustration detailing therapeutic pathways for Chronic Myeloid Leukemia (CML) within the bone marrow niche. The diagram contrasts conventional Tyrosine Kinase Inhibitor (TKI) therapy with Anti-BCR/ABL gene therapy. The top pathway illustrates 'Leukemic Hematopoiesis': following TKI therapy, a mixed population of yellow Hematopoietic Stem Cells (HSCs), light blue TKI-sensitive Leukemic Stem Cells (LSCs), and dark blue TKI-resistant LSCs is shown. Treatment cessation or resistance leads to relapse, characterized by the proliferation of myeloid/lymphoid CML cells. The lower pathway depicts the potential of gene therapy: 'Anti-BCR/ABL gene therapy' targets LSCs to silence the oncogene (BCR/ABL OFF). This results in 'Corrected LSCs' (depicted with yellow and blue stripes), which repopulate the niche alongside normal HSCs. The final outcome is 'Normal Hematopoiesis' and the eradication of CML, visualised by the presence of mature myeloid/lymphoid blood cells (orange). The diagram serves as an educational tool for hematology and oncology, emphasizing the limitations of protein-level inhibition versus genome-level editing in stem cell niches.
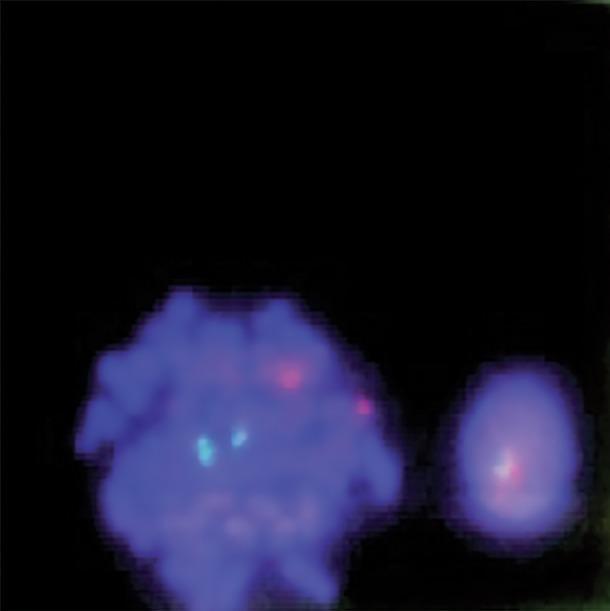
This diagnostic image displays a fluorescence in situ hybridization (FISH) analysis of human bone marrow cells, used primarily for detecting the BCR-ABL1 gene fusion associated with Chronic Myeloid Leukemia (CML). The image shows two blue-stained nuclei (DAPI) against a dark background. On the left, a larger metaphase cell exhibits a normal signal pattern with two distinct cyan/green signals and two distinct red signals (2G2R), representing the normal location of the ABL1 and BCR genes on their respective chromosomes. On the right, a smaller interphase cell demonstrates a fusion signal where a red and a cyan/green signal overlap or are closely apposed, indicative of a chromosomal translocation. This visual is a key educational tool for demonstrating molecular cytogenetics, specifically the dual-color, dual-fusion probe technique used in hematopathology to identify the Philadelphia chromosome.
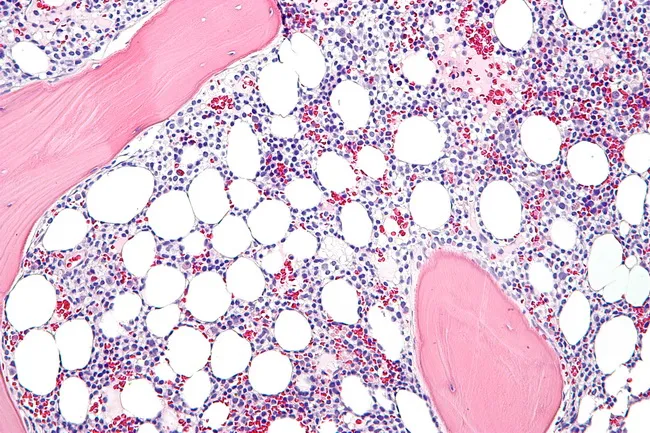
Light microscopy of a bone marrow biopsy from hairy cell leukemia (HCL) shows diffuse infiltration by small to medium lymphoid cells with abundant clear cytoplasm and oval, occasionally reniform nuclei; the cytoplasm creates a fried egg appearance. Hairy projections may be highlighted by immunostaining and by DBA.44 positivity, along with CD11c, CD25, and CD103 markers. The marrow is commonly hypercellular in established disease, whereas early involvement may be hypocellular and mimic aplastic anemia. Prominent reticulin fibrosis is typical and can hinder aspirate yield, making core biopsy essential for assessing infiltration and baseline disease burden. Normal hematopoietic elements, especially the myeloid lineage, are reduced and may display dysplastic changes resembling myelodysplastic syndrome. Plasma cells and mast cells may be mildly increased. In some cases, hairy cells assume a spindle-shaped morphology. The neoplastic cells are typically monotonous with minimal prominent nucleoli, and cytoplasm may exhibit cytoplasmic processes. Unlike several small B-cell lymphomas, discrete cellular aggregates are uncommon, with diffuse replacement predominating. Immunohistochemistry and flow cytometry confirm the diagnosis via characteristic immunophenotype. Clinically, marrow involvement informs staging, prognosis, and treatment planning, though peripheral blood smear and immunophenotypic profiling often suffice for diagnosis. This image, captured at high magnification on a hematoxylin and eosin stained section, showcases classic hairy cell features.
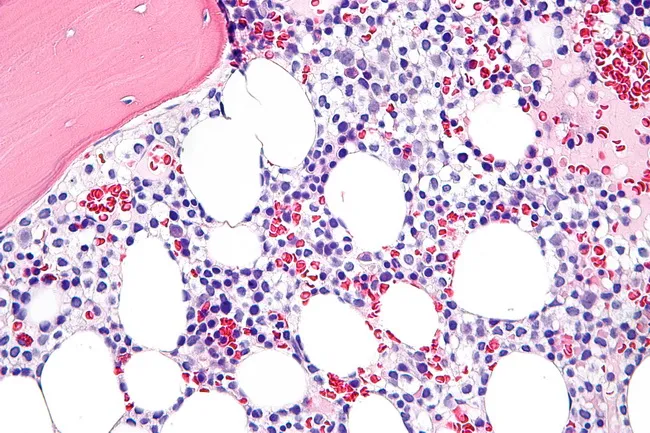
Histopathology: Bone marrow biopsy prepared for light microscopy shows diffuse infiltration by hairy cells rather than well-formed nodules. The marrow is often hypercellular in established disease but can be hypocellular in early stages, mimicking aplastic anemia. Hairy cells appear monotonous with oval nuclei and abundant clear cytoplasm that yields a characteristic fried egg morphology on H&E sections. In some cases, hair-like cytoplasmic projections (hairy indentations) are accentuated with specialized staining such as DBA.44 immunostain, supporting a hairy cell leukemia (HCL) diagnosis. The tumor cells may display spindled forms; the immunophenotype typically includes DBA.44 positivity, and cells may express CD11c, CD25, and CD103 on broader panels. Normal hematopoietic elements, particularly myeloid precursors, are reduced and can show dysplastic changes reminiscent of myelodysplastic syndrome. Plasma cells and mast cells may be mildly increased. Significant reticulin fibrosis is common, contributing to difficult marrow aspirates and making core biopsy essential to determine the extent of marrow replacement. Although marrow evaluation is informative, many cases of HCL can be diagnosed from peripheral blood smear and immunophenotyping alone; however, the biopsy provides baseline disease burden and a reference for assessing therapeutic response and fibrosis progression. This image exemplifies classic HCL marrow involvement with fried egg cells and conspicuous reticulin fibrosis.
chronic myeloid leukemia CML gross pathology spleen hepatomegaly
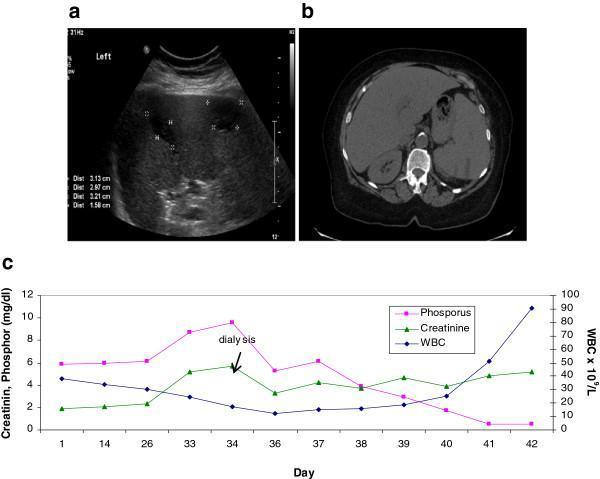
This composite educational image illustrates the clinical and laboratory findings of splenic infarction in a patient with Chronic Myeloid Leukemia (CML). Panel A is a grayscale abdominal ultrasound showing an enlarged spleen (splenomegaly) with multiple peripheral, wedge-shaped hypoechoic lesions consistent with splenic infarcts; calipers measure several zones between 1.58 cm and 3.21 cm. Panel B displays a non-enhanced axial CT scan of the upper abdomen, confirming the presence of multiple peripheral hypodense areas within the spleen, which correlate with the ultrasound findings of infarction. Panel C is a line graph correlating laboratory values over a 42-day period, showing the relationship between Phosphorus (mg/dL), Creatinine (mg/dL), and White Blood Cell (WBC) count. Notably, the graph demonstrates an extreme shift from hyperphosphatemia to severe hypophosphatemia (<0.5 mg/dL) as the WBC count rapidly increases, suggesting a high metabolic demand or 'tumor lysis-like' sequestration during a leukemic blast crisis. This visual set is used to teach the radiological presentation of vascular complications in hematologic malignancies and the interpretation of metabolic trends in aggressive leukemia.
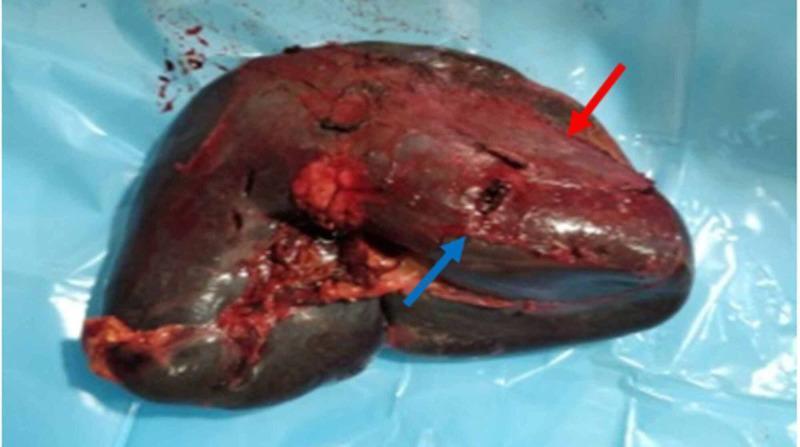
Clinical photograph of a gross pathological specimen showing an enlarged, splenomegalic spleen post-emergency splenectomy. The organ displays a dark, reddish-purple discoloration and irregular surface texture consistent with hematologic pathology. A prominent 3 cm parenchymal laceration at the lower pole is indicated by a blue arrow, representing a traumatic or spontaneous grade three splenic injury. A red arrow identifies a ruptured subcapsular hematoma, appearing as an extensive, raised, lighter red mass covering more than 50% of the organ's surface. This specimen illustrates complications of splenomegaly, often secondary to conditions like Chronic Myeloid Leukemia (CML), where increased organ friability raises the risk of spontaneous rupture, hemorrhage, and subsequent hemoperitoneum.
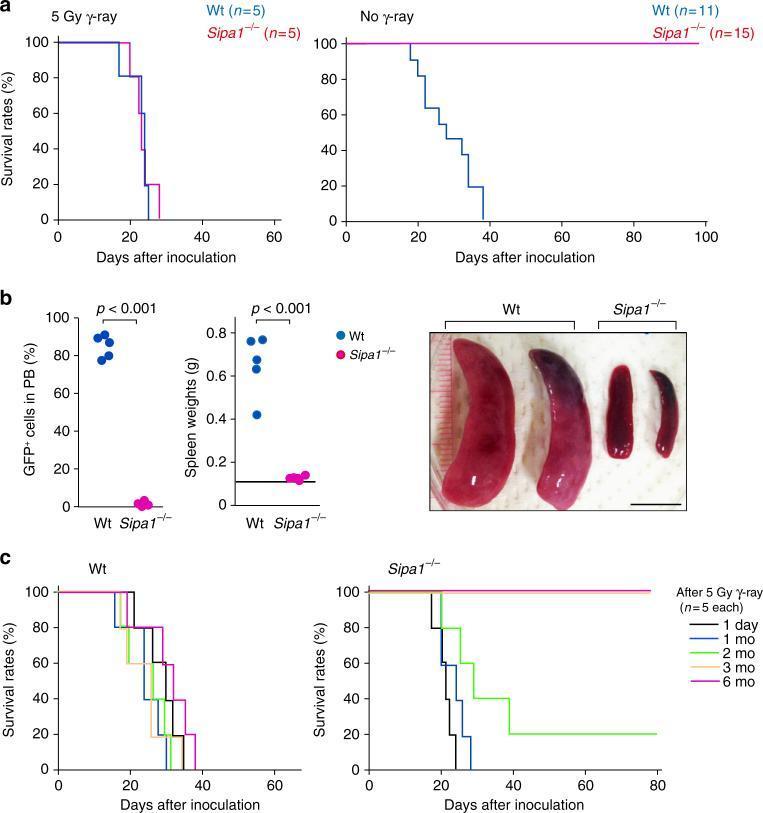
This composite figure presents research data on Chronic Myeloid Leukemia (CML) development in wild-type (Wt) and Sipa1 knockout (Sipa1-/-) mice following Bcr-Abl+ hematopoietic progenitor cell (HPC) injection. Panel (a) displays Kaplan-Meier survival curves showing that Sipa1-/- mice are completely resistant to CML in unirradiated conditions (100% survival), while gamma-irradiation abolishes this resistance. Panel (b) provides quantitative and visual evidence of disease progression: Wt mice exhibit massive splenomegaly (spleen weights 0.4-0.8g) and high peripheral blood GFP+ leukemic cell proportions (~80-90%), whereas Sipa1-/- mice maintain normal spleen weights (~0.1g) and negligible circulating leukemic cells. Clinical photographs show the striking morphological difference between the enlarged, dark-red spleens of Wt mice and the normal-sized spleens of Sipa1-/- mice. Panel (c) shows survival curves based on varying intervals after irradiation, indicating that the host resistance in Sipa1-/- mice is radiosensitive and requires several months to recover. This content illustrates the role of the host microenvironment and Sipa1 in leukemia progression and immune-mediated rejection.
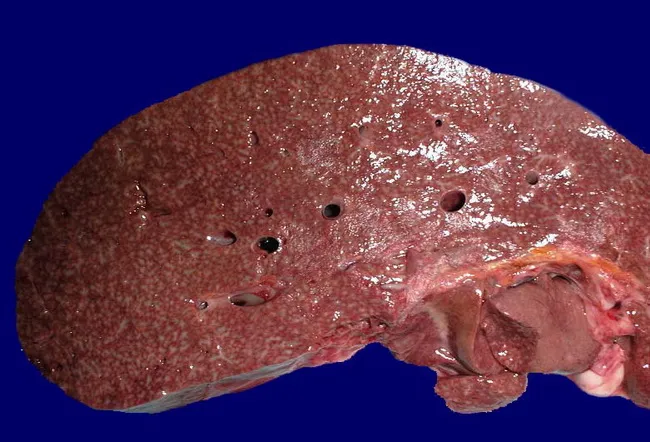
This gross pathology image depicts a human liver from an autopsy with chronic lymphocytic leukemia (CLL). The hepatic parenchyma bears numerous small whitish‑gray nodules scattered throughout the entire cut surface, corresponding to leukemic infiltrates concentrated in periportal areas. Macroscopically the nodules are subtle but conspicuous against the usually uniform red-brown background of healthy liver tissue. The periportal pattern reflects infiltration along portal tracts and within the surrounding lobular parenchyma, a recognized histopathologic correlate of CLL involvement. The liver is part of a disseminated leukemic process, as indicated by concurrent involvement of bone marrow, lymph nodes, spleen, and kidneys in this case, consistent with advanced systemic disease. The autopsy specimen provides direct visualization of organomegaly and parenchymal replacement by malignant lymphocytes, which may contribute to hepatic dysfunction in late-stage disease. Clinically, such hepatic infiltration can manifest as hepatomegaly, cholestasis, or cytopenias secondary to marrow failure. For education and research, this image illustrates an end-stage pattern of CLL hepatic involvement, helps differentiate lymphoid infiltration from focal hepatic metastases, and supports teaching about organ-wide dissemination. Note: image is a gross specimen photograph with a blue backdrop, illustrating macroscopic periportal nodularity and leukemic spread.
CML peripheral blood smear myelocytes granulocytes leukocytosis
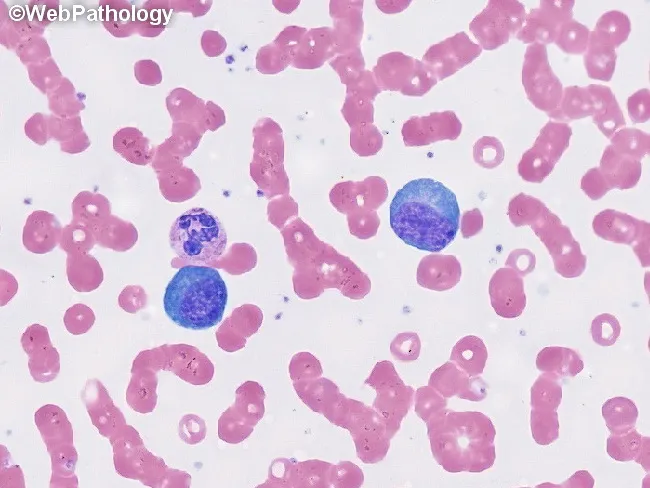
This is a peripheral blood smear prepared with Wright-Giemsa stain and examined under brightfield illumination at high magnification (approximately 1000x total, 100x objective with oil immersion). The smear displays predominantly erythrocytes with uniform pink cytoplasm and characteristic biconcave morphology, arranged singly with occasional rouleaux. Interspersed among the red cells are leukocytes with visible nuclei. Notably, two large lymphocyte-like cells or mononuclear leukocytes appear conspicuously larger than surrounding erythrocytes; these cells have round to oval, deeply basophilic nuclei with dense chromatin and scant, lightly basophilic cytoplasm. No visible granulocytic cytoplasm granules or multiple lobes are clearly resolved in this field, and there are no obvious nucleoli or cytoplasmic inclusions evident in these cells. The background lacks abnormal pigment or reticulocytosis. Overall cell morphology is consistent with a normal or mildly reactive hematologic smear; in a clinical context, additional data such as complete blood count, differential, and patient history would be needed to determine whether there is leukocytosis or blasts. This image serves as an educational reference for recognizing basic peripheral blood components, evaluating leukocyte size variation, and assessing RBC morphology for hematology training and diagnostic differential diagnoses. Additional cases and image contexts can reinforce recognition of hematologic normal variants and patterns.
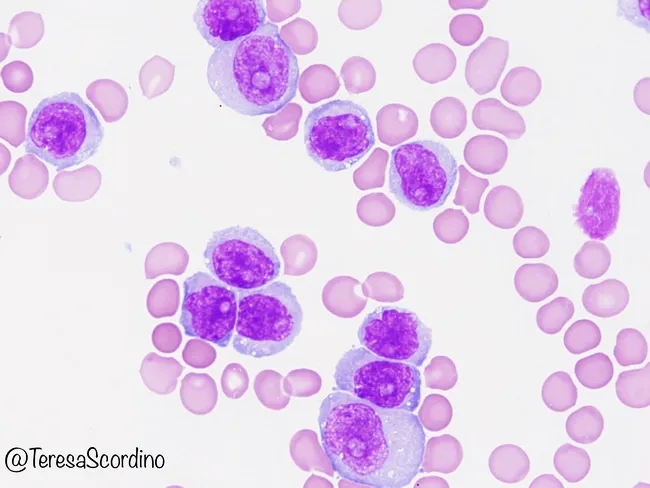
Imaging modality: Bright-field microscopy of Wright-Giemsa stained peripheral blood smear. Anatomical target: circulating peripheral blood cells, with a focus on B-cell prolymphocytes. Visual features: a monomorphic population of medium-to-large lymphoid cells exhibiting round to slightly irregular nuclei, coarse chromatin, and prominent nucleoli; cytoplasm is basophilic and variably abundant; occasional cytoplasmic projections may be seen; the smear background shows scattered erythrocytes and platelets. Overall, leukocytosis with prolymphocytic predominance suggests a malignant B-cell process. Pathological context: morphological hallmarks of B-cell prolymphocytic leukemia (B-PLL), defined by prolymphocytes comprising more than 55% of circulating lymphoid cells in peripheral blood; cells may be part of a systemic leukemia involving bone marrow and spleen. Immunophenotype typically expresses B-cell markers (CD19, CD20) with light chain restriction; immunohistochemistry and flow cytometry are used for confirmation; distinction from mantle cell lymphoma (cyclin D1/MCL) and CLL with increased prolymphocytes is critical. Diagnostic significance: detection of prolymphocytic leukocytes guides prognosis and therapeutic planning, as B-PLL has an aggressive course and limited responsiveness to standard CLL regimens. Clinical correlation: patients are commonly elderly with fatigue, cytopenias, and organomegaly; accurate classification influences treatment choice and clinical trial eligibility; this image serves as an educational reference for hematology, pathology, and medical education.
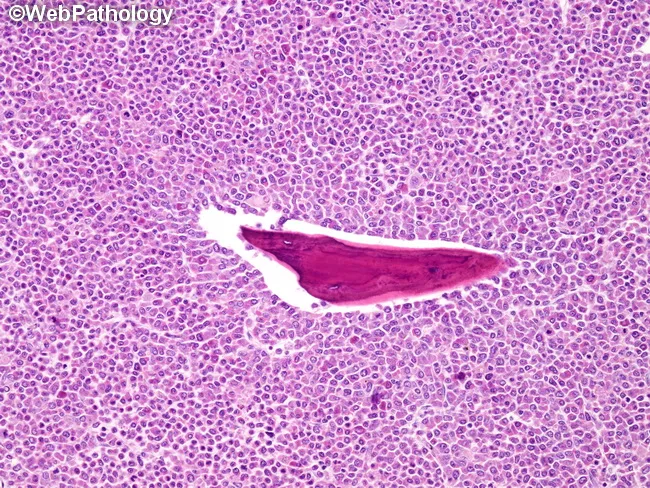
Imaging modality: light microscopy of a hematoxylin and eosin stained bone-tissue section from the femur, obtained in a 65-year-old male with a pathologic fracture. The specimen demonstrates a diffuse, high-cellularity infiltrate composed predominantly of immature myeloid cells, including myeloblasts, promyelocytes, and eosinophilic myelocytes. The tumor occupies the medullary cavity and expands the bony trabeculae with scant extracellular stroma. Morphology shows round to oval cells with high nuclear-to-cytoplasmic ratio, fine chromatin, conspicuous nucleoli, and mitotic activity; occasional cells show eosinophilic cytoplasm consistent with eosinophilic myelocytes. The background marrow is overtaken by neoplastic hematopoietic elements, with little evidence of maturation toward segmented granulocytes. The tissue architecture is diffuse rather than organized into blasts arranged in clusters. The presence of eosinophilic myelocytes supports a myeloid lineage; the pattern is compatible with myeloid sarcoma (granulocytic sarcoma) with predominant blast-rich differentiation. Clinically, this finding indicates an extramedullary myeloid tumor and may be associated with acute myeloid leukemia or myelodysplastic syndromes. Accurate classification (blastic vs immature vs differentiated) informs prognosis and guides systemic therapy, including AML-type chemotherapy, targeted approaches, and bone-targeted strategies. Differential considerations include lymphoma, small round blue cell tumors, and Ewing sarcoma; correlation with peripheral blood and marrow studies is essential for staging and management.
CML bone marrow hypercellular myeloid hyperplasia Philadelphia chromosome
This diagnostic image displays a fluorescence in situ hybridization (FISH) analysis of human bone marrow cells, used primarily for detecting the BCR-ABL1 gene fusion associated with Chronic Myeloid Leukemia (CML). The image shows two blue-stained nuclei (DAPI) against a dark background. On the left, a larger metaphase cell exhibits a normal signal pattern with two distinct cyan/green signals and two distinct red signals (2G2R), representing the normal location of the ABL1 and BCR genes on their respective chromosomes. On the right, a smaller interphase cell demonstrates a fusion signal where a red and a cyan/green signal overlap or are closely apposed, indicative of a chromosomal translocation. This visual is a key educational tool for demonstrating molecular cytogenetics, specifically the dual-color, dual-fusion probe technique used in hematopathology to identify the Philadelphia chromosome.
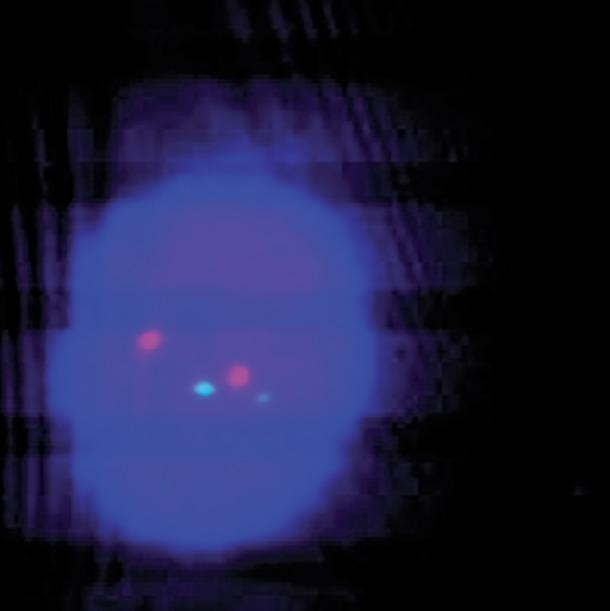
This diagnostic image demonstrates a human bone marrow cell during interphase, analyzed using Fluorescence In Situ Hybridization (FISH) technique. The cell nucleus is stained with a blue DAPI counterstain, providing a background for visualizing chromosomal probes. Within the nucleus, four distinct fluorescent signals are visible: two green (G) signals and two red (R) signals, establishing a '2G2R' pattern. This specific arrangement of discrete, non-fused spots indicates a normal signal pattern, specifically used in hematopathology to rule out chromosomal translocations such as the BCR-ABL1 fusion (Philadelphia chromosome) commonly associated with Chronic Myeloid Leukemia (CML). The absence of overlapping or fused 'yellow' signals confirms the lack of a fusion event in this specific cell. This image serves as an educational reference for normal cytogenetic results in clinical hematology and oncology.
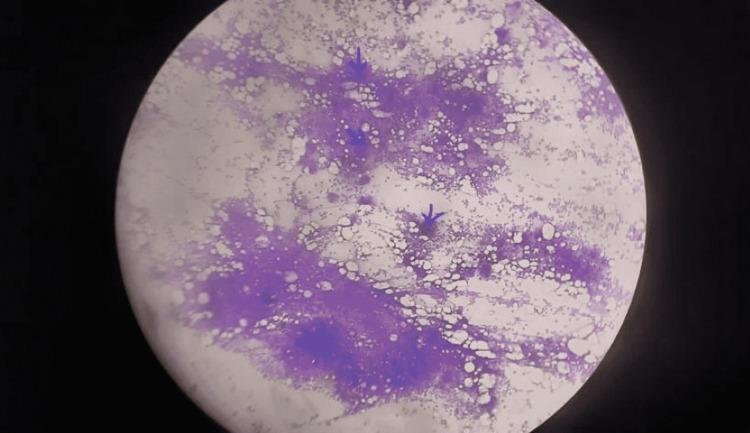
A low-magnification light micrograph of a human bone marrow aspirate, likely stained with a Romanowsky-type stain (e.g., Giemsa or Wright-Giemsa). The image shows hypercellular marrow fragments characterized by dense, purple-stained hematopoietic cellular clusters interspersed with clear, round vacuoles representing adipose tissue (marrow fat). Within these hypercellular areas, there is evidence of megakaryocytic hyperplasia (marked megakaryocytosis). Prominent, large basophilic cells representing megakaryocytes are visible, some of which are indicated by dark blue arrows. The surrounding stroma appears mottled with varying cellular density. This diagnostic image demonstrates the hematological manifestations often associated with POEMS syndrome, specifically the proliferation of the megakaryocytic lineage within the marrow compartment.
Chronic Myeloid Leukemia (CML) - Histology & Gross Pathology
Molecular/Cytogenetic Diagnosis
BCR-ABL1 FISH - Bone Marrow Cells
Histology - Bone Marrow
Myeloid Sarcoma / Extramedullary CML Blast Phase
Gross Pathology
Splenomegaly with Splenic Infarction in CML
Gross Spleen Specimen - Spontaneous Rupture in CML
CML Mouse Model - Gross Splenomegaly Comparison
Key CML Pathology Summary
| Feature | Finding |
|---|---|
| Peripheral blood | Marked leukocytosis, left shift (myelocytes, metamyelocytes, basophilia, eosinophilia) |
| Bone marrow | Hypercellular, myeloid hyperplasia, decreased fat, dwarf megakaryocytes |
| Spleen | Massive splenomegaly (can reach 1-4 kg), splenic infarcts, leukemic infiltration |
| Liver | Hepatomegaly, leukemic infiltration of sinusoids |
| Molecular marker | BCR-ABL1 fusion (Philadelphia chromosome t(9;22)(q34;q11)) |
| Blast crisis | >20% blasts in marrow = transformation to acute leukemia |
Search for latest CML tyrosine kinase inhibitor treatment guidelines and clinical trials
To draw easy diagram of peripheral smart
chronic myeloid leukemia tyrosine kinase inhibitor treatment guidelines
CML chronic myeloid leukemia TKI treatment guidelines 2024 2025 NCCN ELN
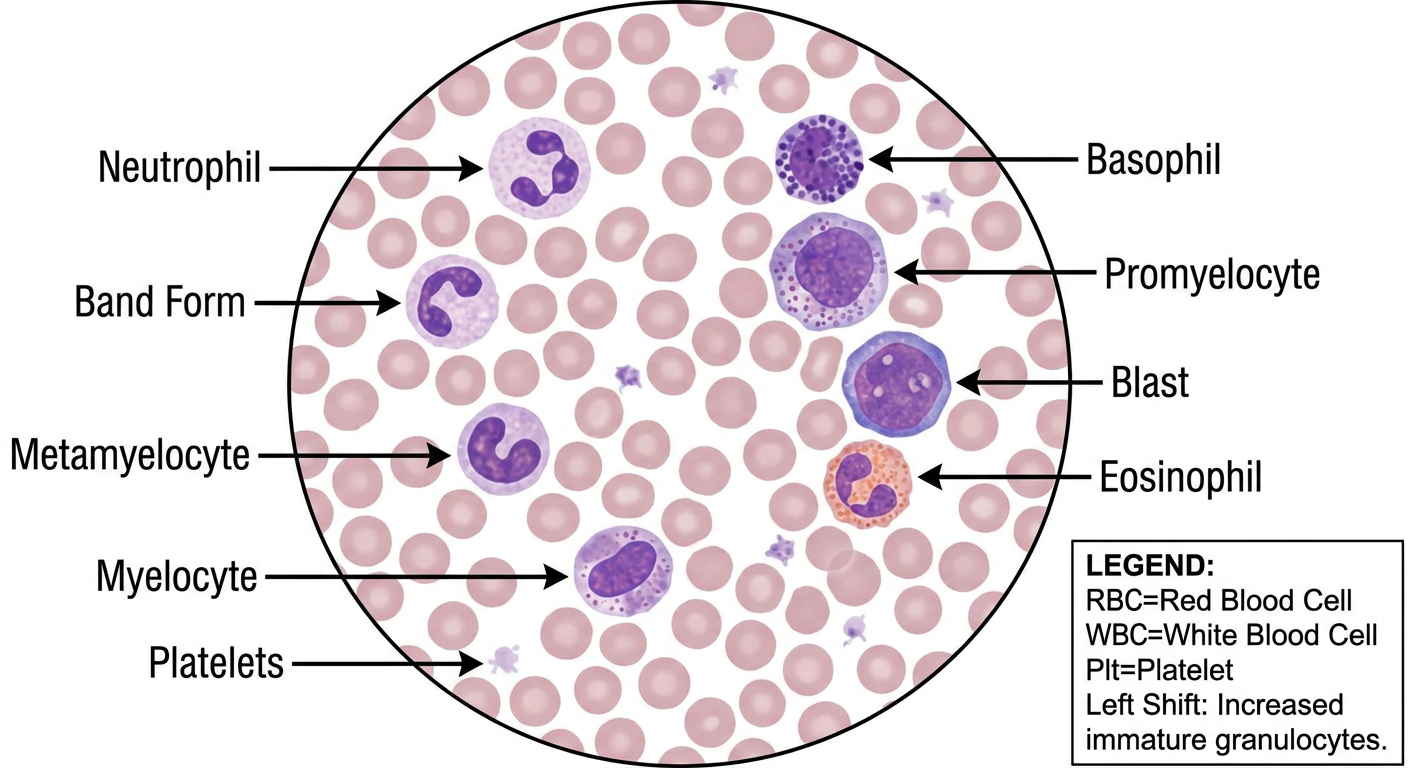
A clear educational diagram of a CML (Chronic Myeloid Leukemia) peripheral blood smear under microscope, showing: many red blood cells in background, markedly increased white blood cells including neutrophils, myelocytes, metamyelocytes, band forms, promyelocytes, and occasional blasts representing a left shift, increased basophils (dark purple granules), increased eosinophils (orange-pink granules), platelets scattered throughout, labeled with arrows identifying each cell type, Wright-Giemsa stain appearance, clean white background with a legend
PMID: 41254114
CML asciminib ponatinib treatment-free remission clinical trial
https://pmc.ncbi.nlm.nih.gov/articles/PMC12529753
asciminib CML frontline chronic phase randomized trial
PMID: 38820078
PMID: 41397287
CML Peripheral Blood Smear - Educational Diagram
Latest CML TKI Treatment Guidelines (2024-2026)
Current Approved TKIs (Frontline)
| Generation | Drug | Dose | Notes |
|---|---|---|---|
| 1st gen | Imatinib (generic) | 400 mg/day | Best OS data, lowest cost (<$500/yr generic), preferred in older patients |
| 2nd gen | Dasatinib | 100 mg/day (or 50 mg/day) | 50 mg equally effective, less toxic |
| 2nd gen | Nilotinib | 300 mg BID (empty stomach) | Superior DMR/TFR rates vs imatinib |
| 2nd gen | Bosutinib | 400 mg/day | Use dose escalation to reduce GI toxicity |
| 3rd gen (STAMP) | Asciminib | 80 mg once daily | Newest FDA-approved frontline option (2024) |
| 3rd gen | Ponatinib | 45 mg → taper | For T315I mutation or after 2 TKI failures |
Landmark 2024-2026 Clinical Trials
ASC4FIRST Trial - Asciminib vs All TKIs (Phase III RCT)
- MMR at Week 48: 67.7% (asciminib) vs 49.0% (all TKIs), p<0.001
- MMR at Week 96 (updated): 74.1% vs 52.0% - difference of 22.4%
- vs Imatinib specifically: 76.2% vs 47.1% at 96 weeks (difference 29.7%)
- vs 2G TKIs: 72.0% vs 56.9% (trend favoring asciminib, though not a primary endpoint)
- Safety: Grade ≥3 adverse events LESS frequent with asciminib (38%) vs imatinib (44.4%) vs 2G TKIs (54.9%)
- Discontinuation due to AEs: 4.5% (asciminib) vs 11.1% (imatinib) vs 9.8% (2G TKIs)
- Conclusion: Asciminib is now considered a strong frontline option with superior efficacy and tolerability
SUSTRENIM Trial - Nilotinib vs Imatinib ± Switch for TFR (Phase III RCT)
- 448 newly diagnosed CP-CML patients, median follow-up 45.9 months
- Goal: achieving deep molecular response (MR4.5) as prerequisite for treatment-free remission (TFR)
- MR4.5 at 24 months: 65/228 (nilotinib) vs 42/220 (imatinib ± switch to nilotinib), p=0.02
- Even with early switching from imatinib to nilotinib in non-optimal responders (37.2% of the imatinib arm switched), upfront nilotinib was more effective
- Conclusion: Nilotinib achieves deeper molecular responses faster, supporting its use when TFR is the primary goal
2025 ELN & NCCN Guideline Highlights
Frontline TKI Selection (2025 consensus)
- If goal = overall survival: Generic imatinib (best value, well-tolerated, 20+ years of safety data)
- If goal = deep molecular response/TFR: 2nd gen TKI (generic dasatinib 50 mg preferred for cost/safety) OR asciminib
- High-risk CML: Consider 2nd/3rd generation TKI upfront
- Young patients (30-50+ yr lifespan): Prefer earlier DMR with 2G TKI or asciminib for TFR potential
- Older patients: Generic imatinib - survival normalization is achievable and well-tolerated
- T315I mutation: Ponatinib (initiate 45 mg, reduce to 15-30 mg to minimize vascular risk) - antiplatelet agent often co-administered
Treatment Response Milestones
| Timepoint | Optimal Response | Warning | Failure |
|---|---|---|---|
| 3 months | BCR::ABL1 ≤10% (IS) | >10% | - |
| 6 months | BCR::ABL1 ≤1% | 1-10% | >10% |
| 12 months | MMR (≤0.1%) | 0.1-1% | >1% |
| Any time | MR4.5 = TFR eligibility | - | Loss of MMR |
Important 2025 update: Both ELN and experts now caution that strict "failure" milestones (e.g., BCR::ABL1 >10% at 3-6 months) may be over-triggering unnecessary TKI switches. Patients still benefiting from the same TKI may be harmed by switching - consensus is being updated. (Management of CML in 2025, PMC12529753)
Treatment-Free Remission (TFR) - Stopping TKI
- On TKI therapy for ≥5 years
- Maintained deep molecular response (MR4 or MR4.5) for ≥2 years
- Access to high-quality molecular monitoring (every 4-8 weeks for 6 months after stopping)
- If MMR is lost: restart TKI within 4 weeks, then monthly monitoring until MMR regained
Drugs Under Development (3rd Gen, Pipeline)
- Olverembatinib - targets ABL1 kinase domain (approved in China for T315I)
- ELVN-001 - next-generation ABL kinase domain inhibitor
- TGRX-678 / TERN-701 - myristoyl pocket inhibitors (STAMP class, like asciminib)
Advanced Phase CML (AP/BP)
- Use 3rd gen TKI (ponatinib) + chemotherapy (myeloid or lymphoid regimens based on blast lineage)
- Goal: rapid response → allogeneic HSCT as soon as response is obtained
- Post-HSCT: TKI maintenance for 3-5 years based on tolerability
Make a easy diagram For Endometriosis gross and histology digram only don't want the explanation
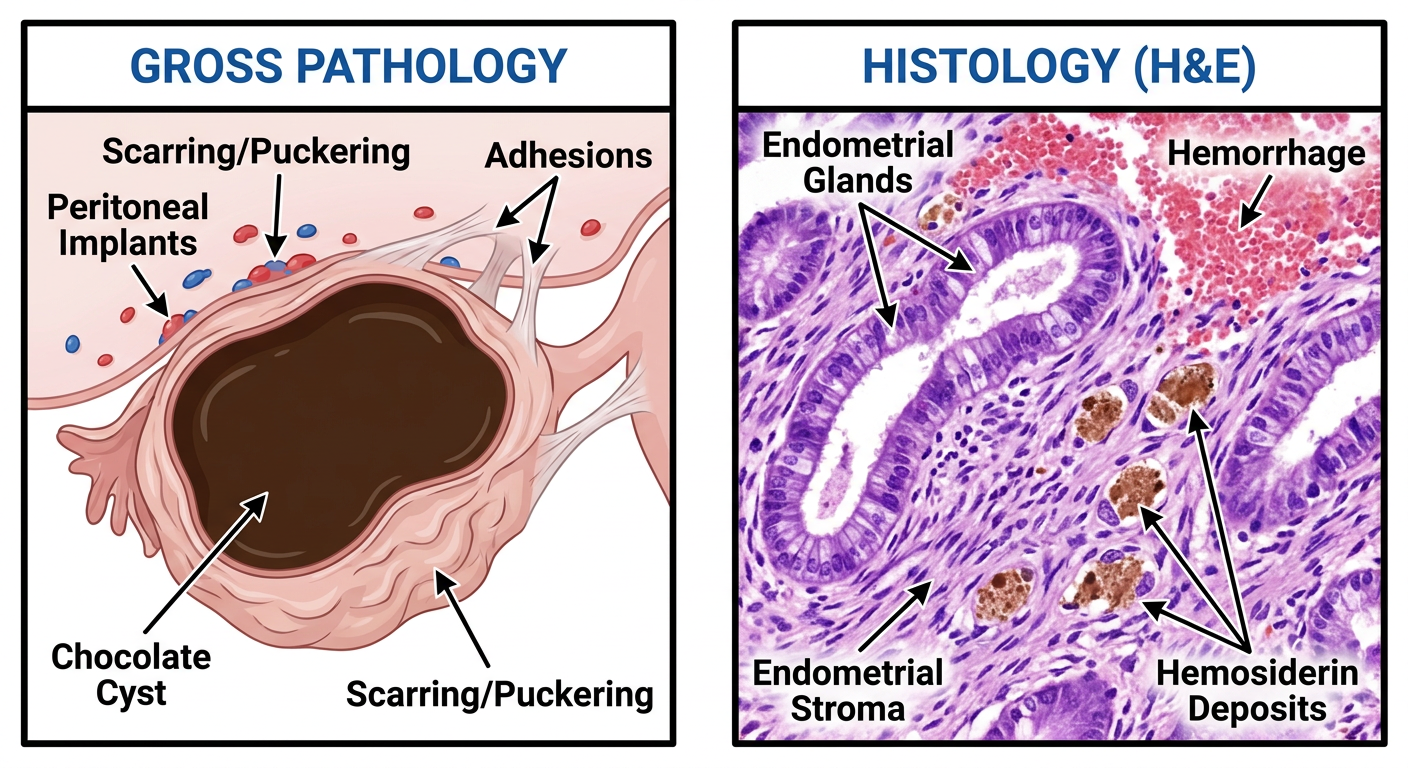
Two side-by-side educational medical diagrams labeled clearly: LEFT PANEL - "GROSS PATHOLOGY": Cross-section of ovary showing a chocolate cyst (endometrioma) filled with dark brown old blood, with puckered scarring on the surface. Also show peritoneal implants as small red-blue nodules on surrounding tissue, and adhesions as fibrous bands. Labels pointing to: Chocolate Cyst, Dark Brown Fluid, Peritoneal Implants, Adhesions, Scarring/Puckering. RIGHT PANEL - "HISTOLOGY (H&E)": Microscopic view showing endometrial glands (tubular glandular structures with columnar epithelium), endometrial stroma (spindle-shaped stromal cells surrounding glands), hemosiderin-laden macrophages (brown pigment deposits), and hemorrhage in background. Labels pointing to: Endometrial Glands, Endometrial Stroma, Hemosiderin Deposits, Hemorrhage. Clean white background, simple bold labels, medical illustration style.
Easy diagram of gross of endometrium and easy histology diagram for endometriosis should be easy generate the picture only with title endometriosis with salite points in it it should be easy to draw and memoriasabke easy don't want explanation
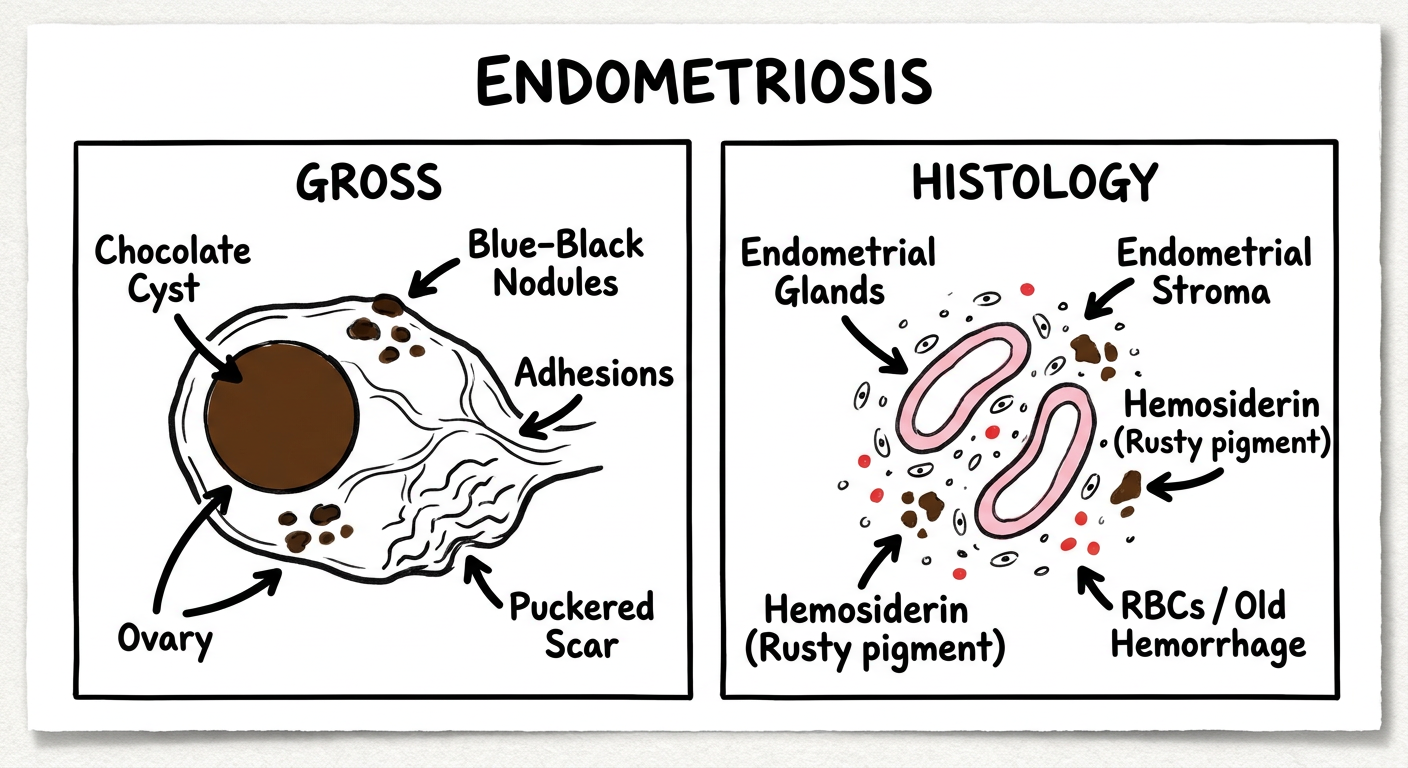
A clean, simple, hand-drawn style educational flashcard titled "ENDOMETRIOSIS" in bold at the top. Divided into two clearly labeled boxes side by side: LEFT BOX titled "GROSS": Simple sketch of an ovary cut open showing: - A round cyst filled with dark brown fluid, labeled "Chocolate Cyst" - Small dark dots on surface labeled "Blue-Black Nodules" - Wavy lines between structures labeled "Adhesions" - Wrinkled surface labeled "Puckered Scar" All labels in bold simple text with short arrow lines. Very minimal sketch style, like a student's notebook drawing. RIGHT BOX titled "HISTOLOGY": Simple sketch showing: - Two or three oval tubular shapes labeled "Endometrial Glands" - Dots/small oval cells around them labeled "Endometrial Stroma" - A few dark brown specks labeled "Hemosiderin (Rusty pigment)" - Small red dots labeled "RBCs / Old Hemorrhage" All in simple bold labels with arrows. Like a student notebook sketch. Overall style: clean white background, bold black outlines, minimal color (brown for cyst fluid and hemosiderin, pink for glands), easy to memorize and reproduce by hand. Medical student flashcard aesthetic.
Create a comparison poster of endometriosis types
A clean medical education comparison poster titled "ENDOMETRIOSIS - TYPES COMPARISON" in large bold text at the top with a dark teal/maroon header banner. The poster is divided into 3 main columns, one for each type, with a consistent row structure for easy comparison: COLUMN 1 - "SUPERFICIAL PERITONEAL ENDOMETRIOSIS" - Small icon: flat peritoneal surface with tiny blue-black dots/lesions on it - Location: Peritoneal surface, pelvic sidewall, bladder, bowel serosa - Gross appearance: Flat red/blue/black powder-burn lesions, flame-like red lesions - Histology: Endometrial glands + stroma, minimal fibrosis - Symptoms: Dysmenorrhea, pelvic pain - Color accent: BLUE COLUMN 2 - "OVARIAN ENDOMETRIOMA (Chocolate Cyst)" - Small icon: Cross-section of ovary with large round cyst filled with dark brown fluid - Location: Ovary (most common) - Gross appearance: Thick-walled cyst, dark brown tarry fluid "chocolate", puckered scarring - Histology: Pseudostratified epithelium, hemosiderin deposits, fibrotic wall - Symptoms: Pelvic mass, infertility, dyspareunia - Color accent: BROWN COLUMN 3 - "DEEP INFILTRATING ENDOMETRIOSIS (DIE)" - Small icon: Sagittal pelvis sketch showing lesion penetrating >5mm into tissue - Location: Rectovaginal septum, uterosacral ligaments, bowel, ureter, bladder - Gross appearance: Firm nodular fibrotic mass, >5mm depth infiltration, white scar tissue - Histology: Sparse glands buried in dense fibromuscular stroma, smooth muscle metaplasia - Symptoms: Severe dysmenorrhea, dyschezia, dysuria, infertility - Color accent: DARK RED At the bottom, a thin row labeled "COMMON HISTOLOGY HALLMARKS (All Types)": Three boxes: 1) Endometrial Glands 2) Endometrial Stroma 3) Hemosiderin-laden macrophages Clean white background, color-coded columns, bold labels, simple medical illustration icons for each type, medical student poster style, easy to read and memorize.
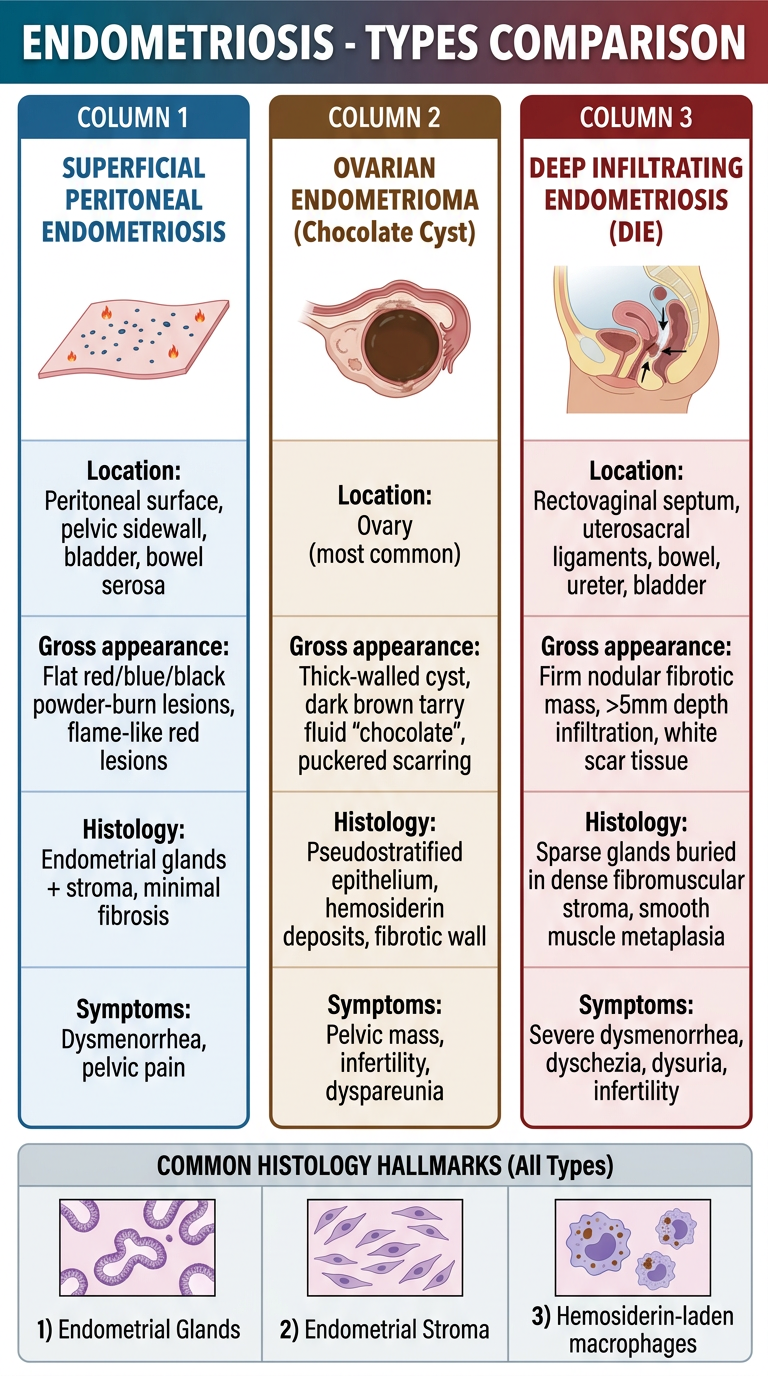
| Superficial Peritoneal | Ovarian Endometrioma | Deep Infiltrating (DIE) | |
|---|---|---|---|
| Key gross feature | Powder-burn dots | Chocolate cyst | Fibrotic nodule >5mm deep |
| Key histo feature | Glands + stroma, minimal fibrosis | Hemosiderin + pseudostratified epithelium | Sparse glands in dense fibromuscular stroma |
| Classic symptom | Dysmenorrhea | Pelvic mass + infertility | Severe dysmenorrhea + dyschezia |