
Pcod detailed explanation
"polycystic ovary syndrome"[MeSH Terms] AND diagnosis AND management
polycystic ovary syndrome PCOS ovarian cysts ultrasound diagram
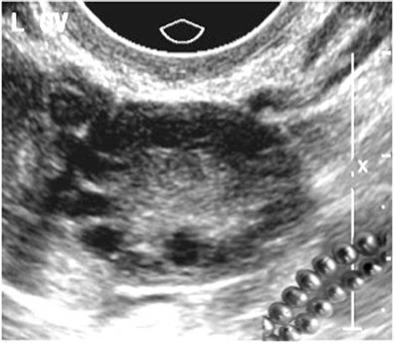
This diagnostic image is an endovaginal ultrasound of a human ovary, commonly associated with the diagnosis of polycystic ovary syndrome (PCOS). The ultrasound shows a transverse cross-section of the ovary characterized by an increased volume and specific follicular distribution. Numerous small, hypoechoic to anechoic cystic structures (follicles), typically measuring 2–8 mm in diameter, are visible. These follicles are arranged in a classic subcapsular distribution, lining up along the periphery of the organ to create the characteristic 'string-of-pearls' sign. The central portion of the ovary consists of a prominent, hyper-echodense ovarian stroma, which appears brighter relative to the dark peripheral cysts. This imaging pattern is a hallmark sonographic criterion for PCOS in the context of clinical signs like hirsutism or metabolic dysfunction. An inset image in the bottom right corner provides a visual analogy using a literal string of pearls to illustrate the diagnostic pattern.
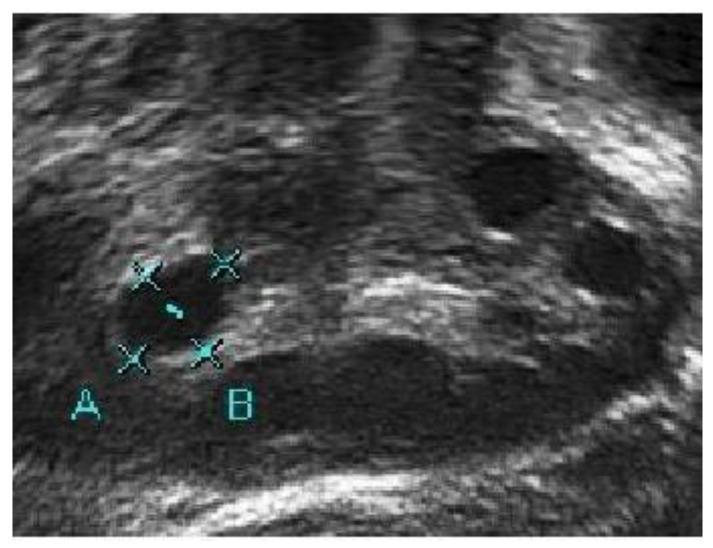
This diagnostic image is a B-mode ultrasound scan of a human ovary, demonstrating characteristic features of Polycystic Ovary Syndrome (PCOS). The image shows multiple hypoechoic (dark) regions representing ovarian follicles. Two specific regions are labeled 'A' and 'B'. Region A is a rounded, anechoic structure marked with measurement calipers to determine follicle size. Region B is a larger, more elongated hypoechoic area situated lower in the stroma. The image quality is characterized by low contrast and significant speckle noise, which is typical for raw clinical ultrasound data before digital enhancement. These factors result in poorly defined follicle boundaries that blend into the surrounding echogenic ovarian stroma. The educational focus of this image is on the visual identification and manual measurement of follicles for PCOS diagnosis, highlighting the technical challenges in distinguishing fluid-filled cysts from adjacent tissue and pelvic capillaries in low-light-intensity ultrasound captures.
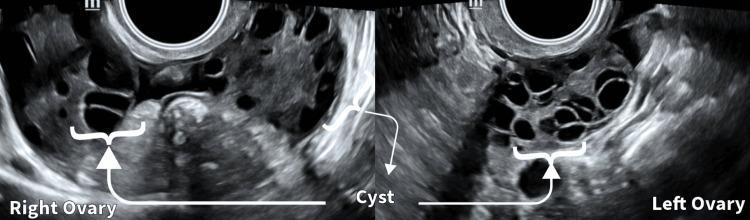
This diagnostic image is a side-by-side transvaginal ultrasound (sonography) displaying the right and left ovaries in a 31-year-old female patient on day 2 of her menstrual cycle. The modality is gray-scale ultrasound, showing transverse or longitudinal views of the pelvic adnexa. Both ovaries demonstrate significant polycystic morphology, characterized by an increased number of small, peripherally arranged follicles and a dense stroma. The right ovary shows multiple scattered anechoic (dark) cysts, while the left ovary displays a more crowded, classic 'string of pearls' or honeycomb appearance with densely packed fluid-filled follicles. These findings are consistent with the clinical diagnosis of Polycystic Ovary Syndrome (PCOS). The image labels highlight specific cystic structures within the enlarged ovarian volume. The educational focus is on identifying diagnostic sonographic criteria for PCOS, including follicular count, size, and distribution within the ovarian stroma during a clinical evaluation for symptoms like irregular cycles and hirsutism.
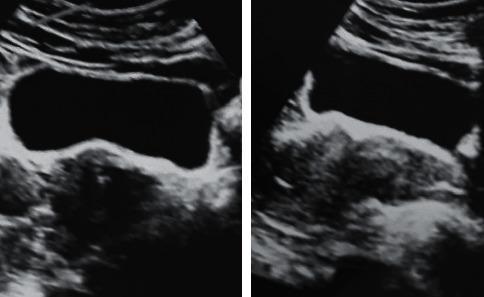
Two diagnostic ultrasound images of the pelvic region demonstrate the classical sonographic findings of Polycystic Ovary Syndrome (PCOS). The images show bilateral ovarian enlargement, with the right ovary measuring 14 ml and the left ovary measuring 17 ml. Both ovaries exhibit a characteristic distribution of multiple small, subcentimeter, hypoechoic follicles located at the periphery, creating a 'string of pearls' appearance. There is a notable increase in the central echogenicity and volume of the ovarian stroma, termed stromal hyperplasia or prominent stroma. These visual features are consistent with the Rotterdam criteria for polycystic ovary morphology in a clinical context of hyperandrogenism. This image serves as an educational reference for identifying gynecological pathology through ultrasonography, specifically highlighting morphological changes in the adnexa associated with endocrine disorders like PCOS and ovarian hyperthecosis.
PCOS pathophysiology insulin resistance androgen hormones diagram
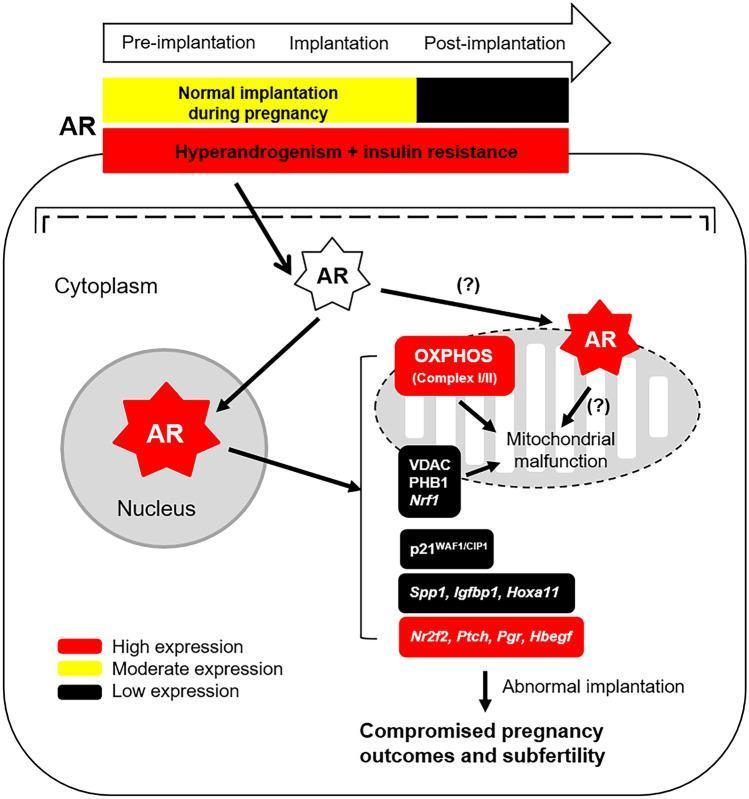
This pathophysiology diagram illustrates the dysregulation of the Androgen Receptor (AR) signaling pathway in the gravid uterus under conditions of hyperandrogenism and insulin resistance. A temporal comparison at the top shows that in normal pregnancy, AR expression transitions from moderate (yellow) during pre-implantation and implantation to low (black) post-implantation. In contrast, hyperandrogenism + insulin resistance maintains sustained high (red) AR expression across all stages. The cellular model depicts high AR expression (red star symbols) localized within the nucleus, cytoplasm, and mitochondrion. Nuclear AR translocation affects the transcription of implantation-related genes, including p21WAF1/CIP1, Spp1, Igfbp1, and Hoxa11, as well as Nr2f2, Ptch, Pgr, and Hbegf. Concurrently, mitochondrial AR localization and interaction with OXPHOS (Complex I/III), VDAC, PHB1, and Nrf1 contribute to mitochondrial malfunction. These combined molecular disturbances lead to abnormal implantation, compromised pregnancy outcomes, and subfertility, modeling mechanisms often associated with Polycystic Ovary Syndrome (PCOS).
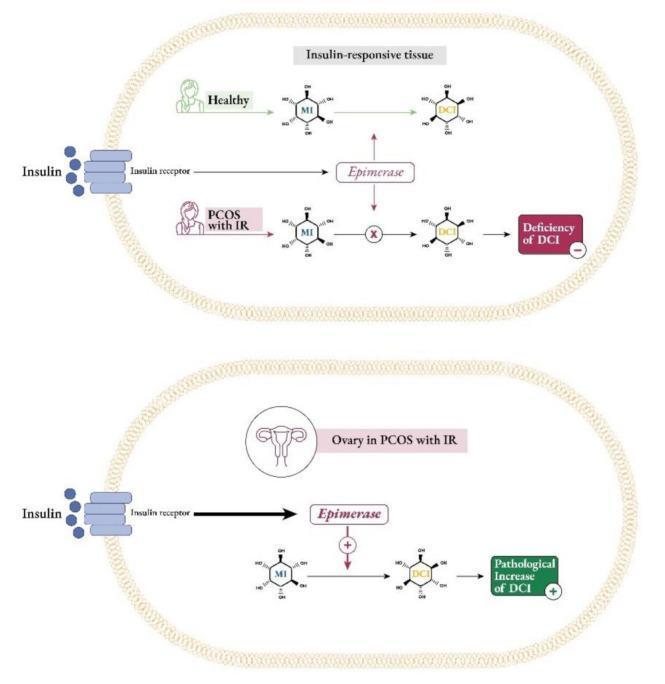
This pathophysiology diagram illustrates the differential regulation of inositol metabolism in classic insulin-responsive tissues versus the ovaries in Polycystic Ovary Syndrome (PCOS) with insulin resistance (IR). The top panel compares healthy and PCOS states in peripheral tissues. In healthy individuals, insulin binding to the insulin receptor activates the epimerase enzyme, facilitating the conversion of myo-inositol (MI) to D-chiro-inositol (DCI). In PCOS with IR, this conversion is blocked (indicated by an 'X'), leading to a 'Deficiency of DCI'. The bottom panel depicts the 'ovarian paradox'. In the ovary of a patient with PCOS and IR, hyperinsulinemia overstimulates the insulin receptor and the epimerase enzyme (indicated by a plus sign and thick arrows). This overactivity causes an excessive conversion of MI to DCI, resulting in a 'Pathological Increase of DCI'. The diagram uses chemical structures for MI and DCI and flow-based signaling pathways to explain how metabolic dysregulation in PCOS leads to tissue-specific inositol imbalances, contributing to endocrine dysfunction.
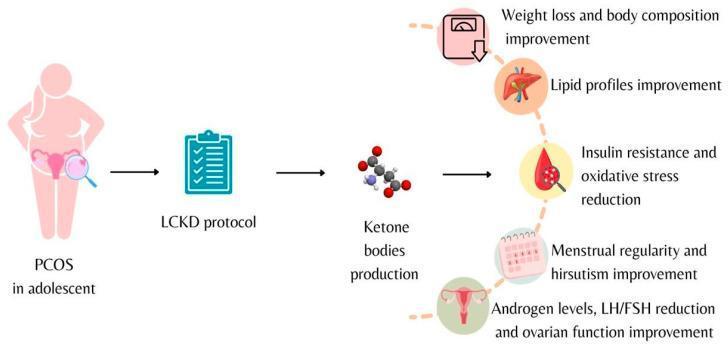
A pathophysiology diagram illustrating the clinical impact of a Low-Calorie Ketogenic Diet (LCKD) protocol on adolescents with Polycystic Ovary Syndrome (PCOS). The schematic follows a linear progression from left to right. It begins with an adolescent figure representing a PCOS diagnosis, highlighting the pelvic region. The next stage depicts the 'LCKD protocol' intervention, which leads to the biochemical phase of 'Ketone bodies production,' represented by a molecular model. The final section branches into multiple physiological benefits, categorized by icons: a scale indicating weight loss and body composition improvement; a liver icon for lipid profile improvement; a blood drop for reduction in insulin resistance and oxidative stress; a calendar for menstrual regularity and hirsutism improvement; and a reproductive system icon for the reduction of androgen levels and LH/FSH ratios, alongside improved ovarian function. This infographic summarizes the multi-systemic metabolic and endocrine benefits of nutritional ketosis in managing PCOS symptoms.
PCOD / PCOS - Detailed Explanation
Terminology note: PCOD (Polycystic Ovarian Disease) and PCOS (Polycystic Ovary Syndrome) refer to the same condition. "PCOS" is the internationally preferred term because "syndrome" better reflects its heterogeneous, multi-system nature rather than implying a single disease.
1. Definition
- Oligo-ovulation or anovulation (irregular or absent periods)
- Hyperandrogenism - clinical (hirsutism, acne, androgenic alopecia) or biochemical (elevated testosterone)
- Polycystic-appearing ovaries on ultrasound - ≥20 antral follicles OR ovarian volume ≥10 cm³ in at least one ovary, OR elevated AMH (anti-Müllerian hormone)
- Goldman-Cecil Medicine, p. 2560
- Harrison's Principles of Internal Medicine, 22nd Ed. (2025), p. 3135
2. Epidemiology
| Fact | Data |
|---|---|
| Prevalence | 6-12% of women of reproductive age |
| Most common endocrine disorder | In women of reproductive age |
| Risk of type 2 diabetes | >50% of affected women develop it by age 40 |
| Obesity prevalence | High; worsens all features |
| No ethnic/geographic predilection | Affects all populations equally |
3. Pathophysiology
A. Hypothalamic-Pituitary Axis Dysfunction
- Abnormal GnRH pulsatility leads to elevated LH with relatively low and constant FSH
- High LH stimulates ovarian thecal cells to overproduce androgens (mainly testosterone and androstenedione)
- Low FSH means granulosa cells cannot convert androgens to estrogens properly - follicles arrest in development
B. Insulin Resistance & Hyperinsulinemia
- Present across all racial/ethnic groups with PCOS - the likely common underlying defect
- Insulin resistance occurs mainly in skeletal muscle and adipose tissue
- Compensatory hyperinsulinemia further stimulates ovarian androgen production via insulin receptors on thecal cells
- Reduces hepatic sex hormone-binding globulin (SHBG) production, increasing free androgens
C. Ovarian Androgen Excess
- Elevated androgens directly inhibit follicular maturation, causing follicles to arrest at 2-8mm
- These arrested follicles form the characteristic "string of pearls" appearance on ultrasound
- Genetic variants in CYP17 (17α-hydroxylase/17,20-lyase) and CYP19 (aromatase) contribute
- Genome-wide association studies have identified ~19 loci associated with PCOS
D. The Vicious Cycle
High LH → ↑ Androgens → Anovulation → No progesterone
    ↑                                        ↓
Hyperinsulinemia ←──── Insulin Resistance ←──┘
    ↓
↓ SHBG → More free androgens → More symptoms
4. Clinical Features (Symptoms & Signs)
Menstrual Disturbances
- Oligomenorrhea (cycles >35 days) or amenorrhea - most common presentation
- Occasionally heavy/irregular bleeding (dysfunctional uterine bleeding)
- Onset typically at menarche, worsening with time
Hyperandrogenic Features
- Hirsutism - excess hair on face, chest, abdomen, inner thighs (assessed by modified Ferriman-Gallwey score ≥4-6)
- Acne - often persistent into adulthood
- Androgenic alopecia - male-pattern hair thinning
- Clitoromegaly (rare, severe cases)
Metabolic Features
- Obesity - central/abdominal pattern; worsens prognosis
- Acanthosis nigricans - velvety, darkened skin folds at neck/axillae; marker of insulin resistance
- Elevated fasting glucose, dyslipidemia, hypertension
Reproductive Consequences
- Subfertility / Infertility - infrequent or absent ovulation
- Increased risk of miscarriage
- Increased risk of gestational diabetes and preeclampsia
Severe Variant: Hyperthecosis
- Marked obesity, anovulation, mild glucose intolerance
- Very high insulin and androgen levels
- Acanthosis nigricans, hyperuricemia, severe hirsutism
- Ovaries show greatly increased androgen-producing stromal/thecal cells
5. Diagnosis
Diagnostic Criteria (Rotterdam 2023)
| Criterion | Definition |
|---|---|
| Irregular menses | <8 cycles/year (adults); >2 years post-menarche in adolescents |
| Hyperandrogenism | Elevated testosterone/free testosterone, OR hirsutism/acne/alopecia |
| Polycystic ovaries | ≥20 antral follicles per ovary, OR ovarian volume ≥10 cm³, OR elevated AMH |
Differential Diagnosis - Must Exclude:
- Cushing syndrome
- Congenital adrenal hyperplasia (late-onset/mild)
- Androgen-secreting tumors (adrenal or ovarian) - rapid onset of hirsutism is a red flag
- Hypothyroidism / Hyperthyroidism
- Hyperprolactinemia
- Non-classical adrenal hyperplasia
Laboratory Investigations
| Test | Purpose |
|---|---|
| Total & free testosterone | Confirm hyperandrogenism |
| LH/FSH ratio | Often >3, but NOT diagnostic alone |
| Fasting glucose + HbA1c | Screen for diabetes |
| Oral glucose tolerance test | If risk factors present |
| Lipid profile | Dyslipidemia screening |
| TSH | Exclude thyroid disease |
| Prolactin | Exclude hyperprolactinemia |
| 17-OH progesterone (morning) | Exclude CAH |
| AMH | Supports PCOS diagnosis; elevated |
Ultrasound Findings
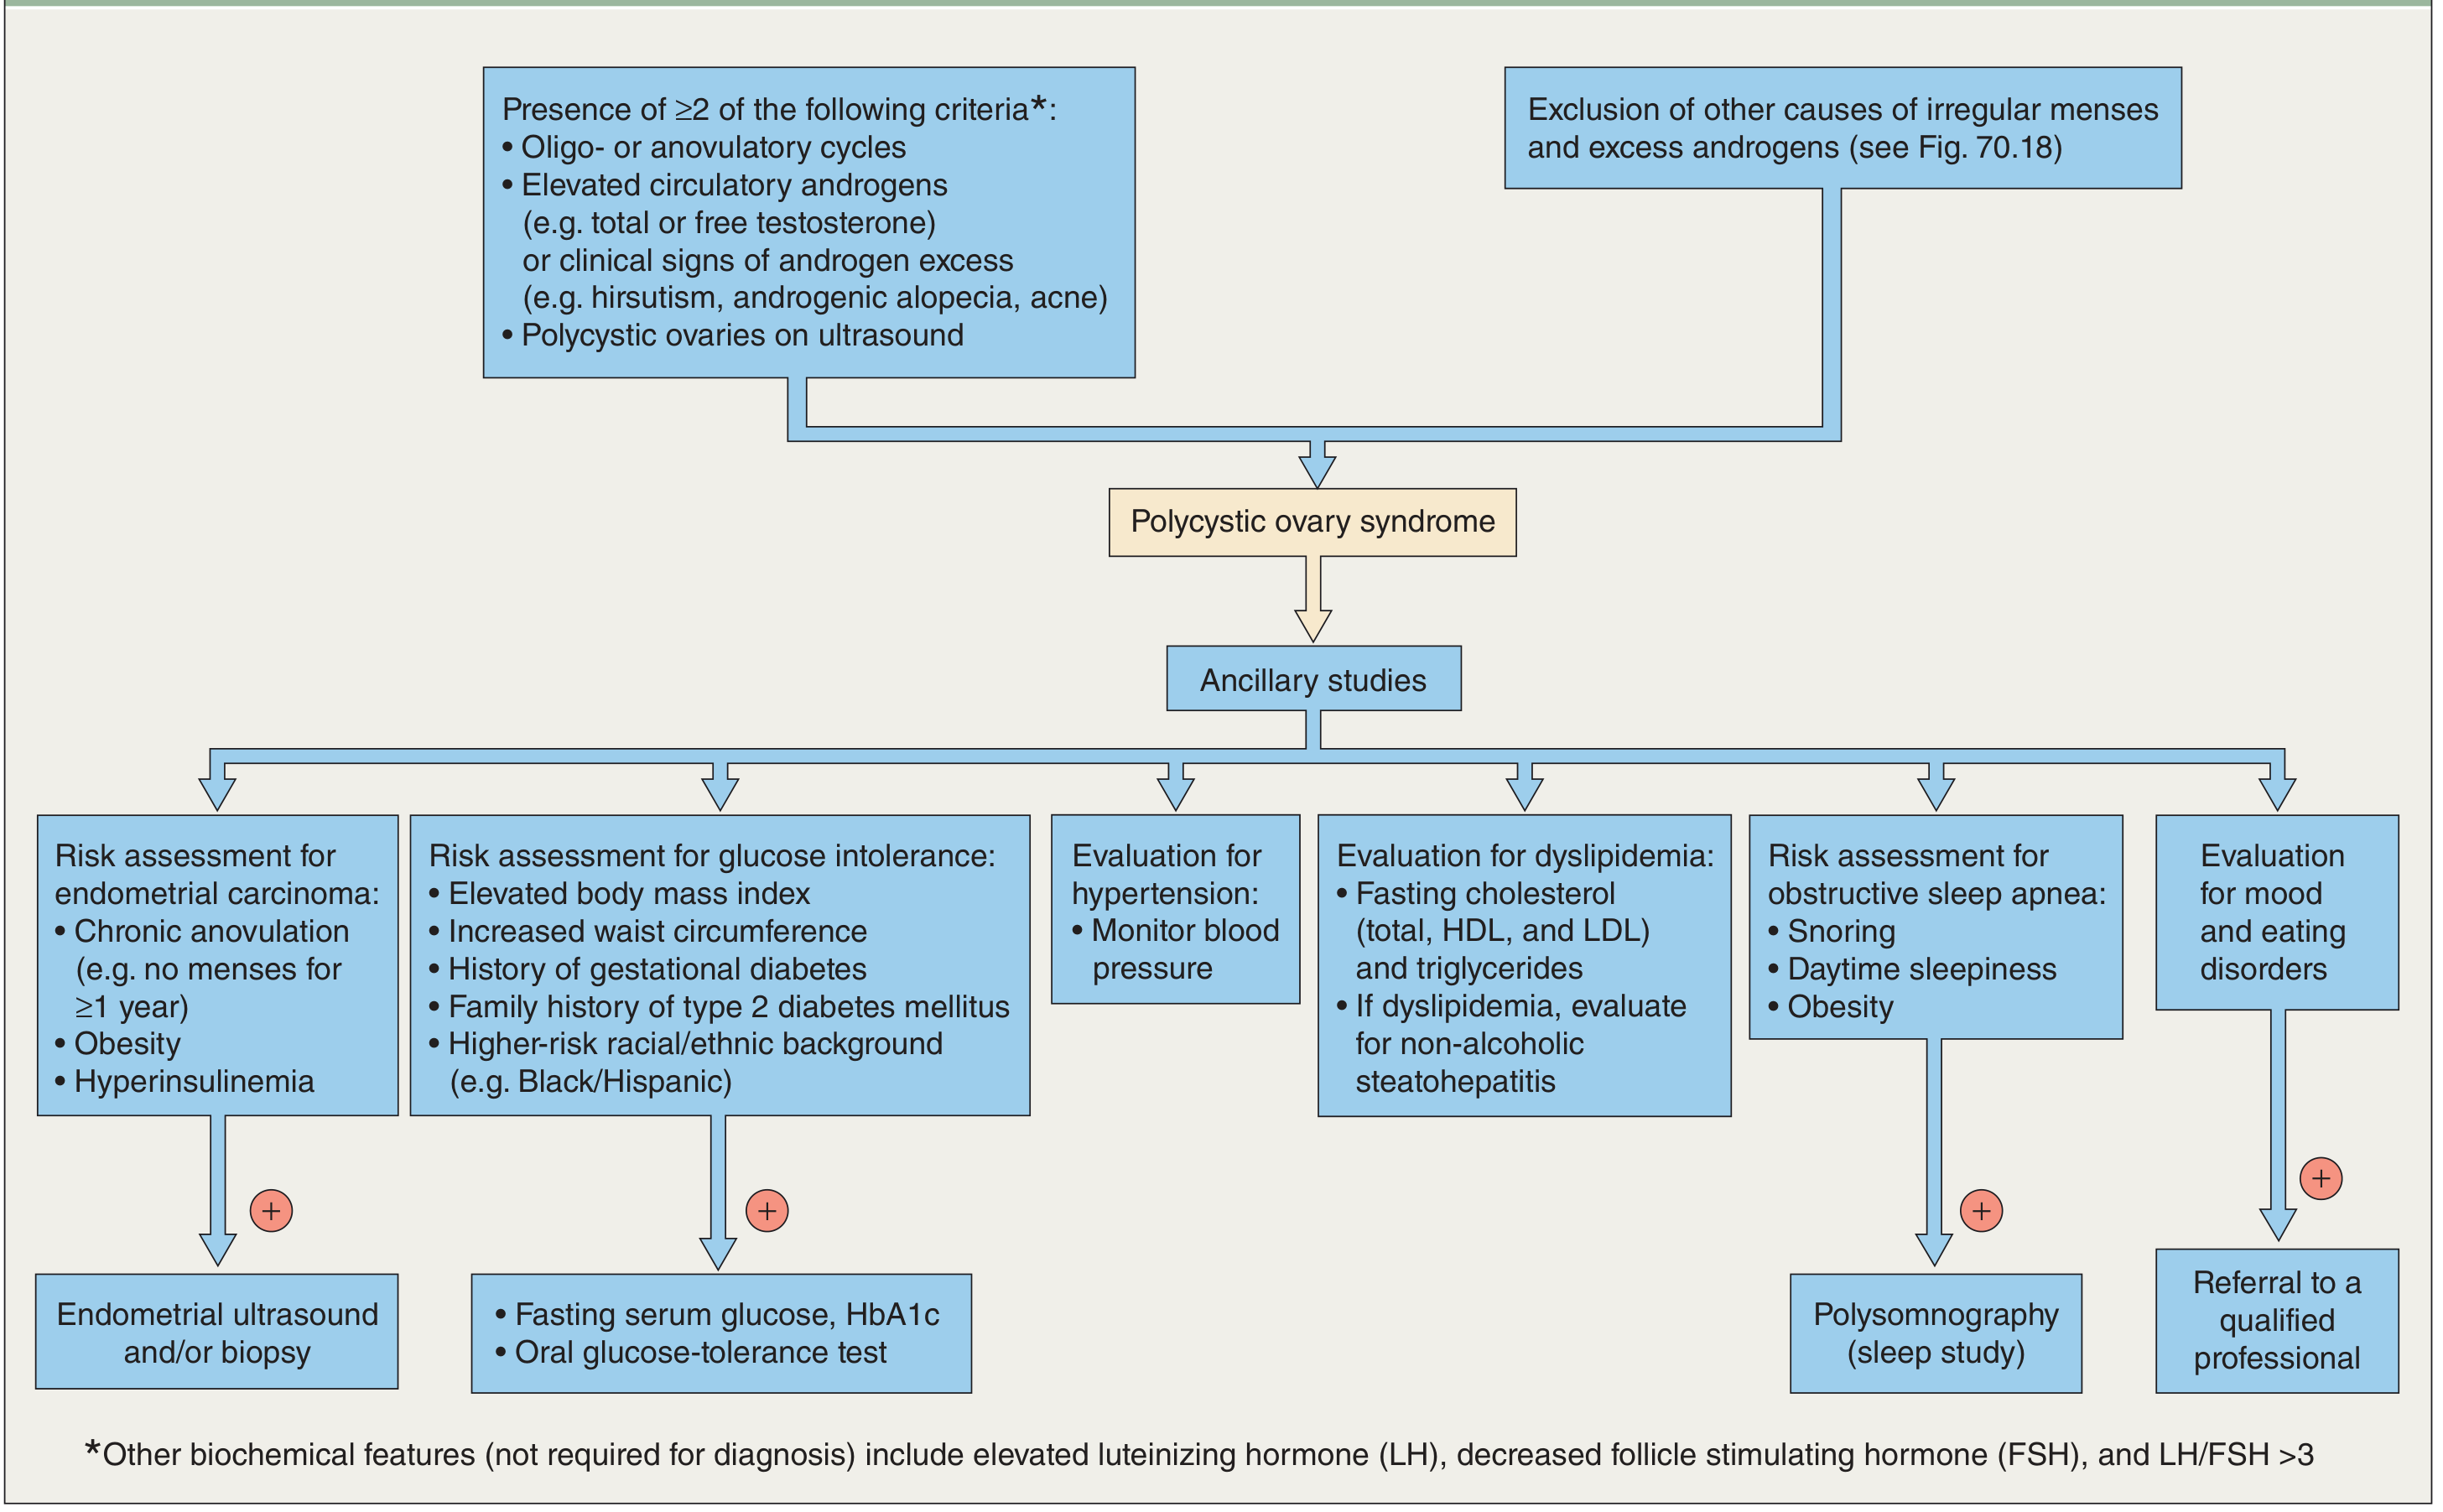
PCOS Diagnostic & Evaluation Flowchart
6. Long-Term Health Risks
| System | Risk |
|---|---|
| Metabolic | Type 2 diabetes (>50% by age 40), metabolic syndrome |
| Cardiovascular | Dyslipidemia, hypertension, increased CV risk |
| Endometrial | Endometrial hyperplasia and carcinoma (2-6x increased risk due to unopposed estrogen from chronic anovulation) |
| Hepatic | Metabolic dysfunction-associated steatotic liver disease (MDSLD), independent of BMI |
| Respiratory | Obstructive sleep apnea (screen for snoring, daytime sleepiness, obesity) |
| Psychiatric | Depression, anxiety disorders, disordered eating, body image distress (high prevalence) |
- Harrison's Principles of Internal Medicine, 22nd Ed., p. 3135
7. Treatment
A. Lifestyle Modification (First-line for all)
- Weight loss of even 5-10% can restore ovulation and improve all metabolic parameters
- Regular aerobic exercise
- Low-calorie or low-glycemic-index diet
- Benefits: reduces insulin resistance, lowers androgens, improves menstrual regularity
B. Not Desiring Pregnancy (Menstrual/Androgen Management)
| Treatment | Mechanism | Use |
|---|---|---|
| Combined oral contraceptive pills (COCPs) | ↑ SHBG → ↓ free androgens; suppresses LH; regulates cycles | First-line - regulates menses, treats hirsutism/acne, prevents endometrial hyperplasia |
| Cyclic progestins (medroxyprogesterone 5-10 mg x 10-14 days/month) | Protects endometrium from unopposed estrogen | Alternative if COCPs contraindicated |
| Spironolactone (50-200 mg/day) | Anti-androgen; blocks androgen receptors | Add-on for hirsutism/acne; use contraception concurrently |
| Metformin | ↓ Insulin resistance; ↓ ovarian androgen production | Metabolic improvement; second-line for cycle regulation |
| Eflornithine (topical) | Slows facial hair growth | Adjunct for hirsutism |
C. Desiring Pregnancy (Ovulation Induction)
| Treatment | Notes |
|---|---|
| Letrozole (aromatase inhibitor, 2.5-7.5 mg day 3-7) | Current first-line for ovulation induction in PCOS |
| Clomiphene citrate (50-150 mg day 3-7) | Traditional first-line; still used |
| Metformin | Can improve response to clomiphene; used in insulin-resistant patients |
| Gonadotropins (FSH/LH injections) | Used if clomiphene/letrozole fail; risk of OHSS |
| Laparoscopic ovarian drilling (LOD) | Surgical electrocautery of ovarian surface; lowers androgen production; for clomiphene-resistant cases |
| IVF | For cases failing all other treatments |
D. New and Emerging Therapies (2024-2025)
- GLP-1 receptor agonists (e.g., semaglutide, liraglutide): reduce weight, improve insulin resistance, lower androgens, and may restore ovulation - particularly in obese PCOS patients. Two 2024 meta-analyses confirm efficacy (PMID 38444070, PMID 39178623)
- Probiotics/Prebiotics/Synbiotics: show early evidence for improving insulin resistance and hormonal balance (PMID 39599701)
- Inositol (myo-inositol + D-chiro-inositol): addresses the "ovarian paradox" of inositol dysregulation; improving evidence for metabolic and reproductive outcomes
8. PCOS in Adolescents - Special Considerations
- Diagnosis should NOT be made until at least 3 years after menarche
- Normal puberty causes irregular cycles and acne - overlap with PCOS is high
- Only use menstrual irregularity + hyperandrogenism criteria (NOT ultrasound/AMH)
- COCPs are first-line for symptom management
- Avoid labeling prematurely as this causes significant psychological distress
9. Pregnancy Outcomes in PCOS
- Gestational diabetes mellitus
- Preeclampsia
- Preterm birth
- Cesarean section rates
10. Summary: Key Points
| Feature | Detail |
|---|---|
| Most common endocrine disorder | 6-12% of reproductive-age women |
| Core mechanism | LH excess + insulin resistance → hyperandrogenism → anovulation |
| Diagnosis | 2 of 3 Rotterdam criteria (after exclusion) |
| Hallmark sign | "String of pearls" on USS; acanthosis nigricans on skin |
| First-line Rx (no fertility) | COCP |
| First-line Rx (fertility desired) | Letrozole |
| Biggest long-term risk | Endometrial cancer, type 2 diabetes, cardiovascular disease |
| Emerging treatment | GLP-1 agonists (semaglutide etc.) |
- Goldman-Cecil Medicine International Edition, p. 2560
- Harrison's Principles of Internal Medicine, 22nd Ed. (2025), p. 3135
- Berek & Novak's Gynecology, p. 1879
- PubMed: PMID 38444070, 38965226, 39599701, 39178623