
Write a answer on electrocardiography 10 mks
Reading File
Now let me search the medical library for comprehensive ECG content.
Finding Sources
Finding Sources
Finding Sources
Finding Sources
Finding Sources
Reading File
Reading File
Reading File
Finding Sources
Finding Sources
Reading File
Reading File
Reading File
Finding Sources
Reading File
Reading File
Reading File
Reading File
I now have comprehensive content from the textbooks. Let me fetch the key ECG diagram image and compile the full answer.
Loading Image
Loading Image
I now have all the content needed. Let me compile the full 10-mark answer on electrocardiography.
Electrocardiography (ECG)
Definition
Electrocardiography is the recording of potential differences on the body surface that reflect the electrical activity of the heart. These measurable voltages arise because the entire myocardium does not depolarize simultaneously - the atria depolarize before the ventricles, and different portions of the ventricles depolarize in a precise sequence, establishing potential differences that can be detected by electrodes placed on the skin. - Costanzo Physiology, 7th Edition
Principle / Basis
The heart is suspended in a conductive medium (body fluids, lung tissue). When one portion of the ventricles depolarizes, it becomes electronegative relative to the rest, and electrical current flows outward in circuitous routes through surrounding fluid. If the algebraic average of all these current vectors is calculated, the net current flows from the base of the heart toward the apex during most of ventricular depolarization. Electrodes on the body surface detect these changing potential differences. - Guyton & Hall Textbook of Medical Physiology
ECG Paper and Standard Settings
ECG is recorded on standardized graph paper with a grid of horizontal and vertical lines. Thin lines are 1 mm apart; thick lines are 5 mm apart.
- Paper speed: 25 mm/sec (standard)
- 1 small square (1 mm) = 0.04 sec (40 ms)
- 1 large square (5 mm) = 0.20 sec (200 ms)
- Calibration: Standard amplitude = 10 mm/mV
ECG Waveforms, Intervals, and Segments

Waves
| Wave | Represents | Normal Features |
|---|---|---|
| P wave | Atrial depolarization | Small positive deflection; duration < 0.12 s; amplitude < 2.5 mm |
| Q wave | Initial septal depolarization (left to right) | First negative deflection of QRS |
| R wave | Main ventricular depolarization | First positive deflection of QRS |
| S wave | Terminal ventricular depolarization | Negative deflection following R wave |
| T wave | Ventricular repolarization | Follows QRS; normally upright in most leads |
| U wave | Possibly Purkinje fiber repolarization | Small, same polarity as T wave; not always seen |
Note: Atrial repolarization is not visible on the normal ECG because it is buried within and obscured by the QRS complex. - Costanzo Physiology
Intervals and Segments
| Interval/Segment | Definition | Normal Duration |
|---|---|---|
| PR interval | Onset of P wave to onset of QRS complex; includes AV nodal conduction time | 0.12 - 0.20 s (3-5 small squares) |
| QRS interval | Onset to end of QRS complex; ventricular depolarization time | < 0.12 s (< 3 small squares) |
| ST segment | End of QRS to beginning of T wave; isoelectric; corresponds to plateau of ventricular action potential | Isoelectric (flat) |
| QT interval | Onset of QRS to end of T wave; total ventricular electrical systole | Rate-dependent; ~0.35-0.45 s |
| R-R interval | Time between two consecutive QRS complexes; equals one cardiac cycle | Used to calculate heart rate |
Source: Medical Physiology (Boron & Boulpaep)
Heart rate calculation: Heart rate = 1 / R-R interval (in seconds) × 60 = 300 / number of large squares between two R waves
ECG Leads (12-Lead System)
The standard 12-lead ECG uses 10 electrodes to generate 12 different "views" (leads) of cardiac electrical activity.
Historical Development
- Willem Einthoven (1903): First recorded the ECG using a string galvanometer; won Nobel Prize in 1924. He introduced the three standard bipolar limb leads.
- Frank Wilson (1930s): Developed precordial unipolar leads.
- Emmanuel Goldberger (1942): Developed the augmented limb leads (aVR, aVL, aVF).
- AHA + Cardiac Society of Great Britain (1938): Standardized the six precordial lead positions.
Together, these form the modern standard 12-lead ECG. - Roberts and Hedges' Clinical Procedures in Emergency Medicine
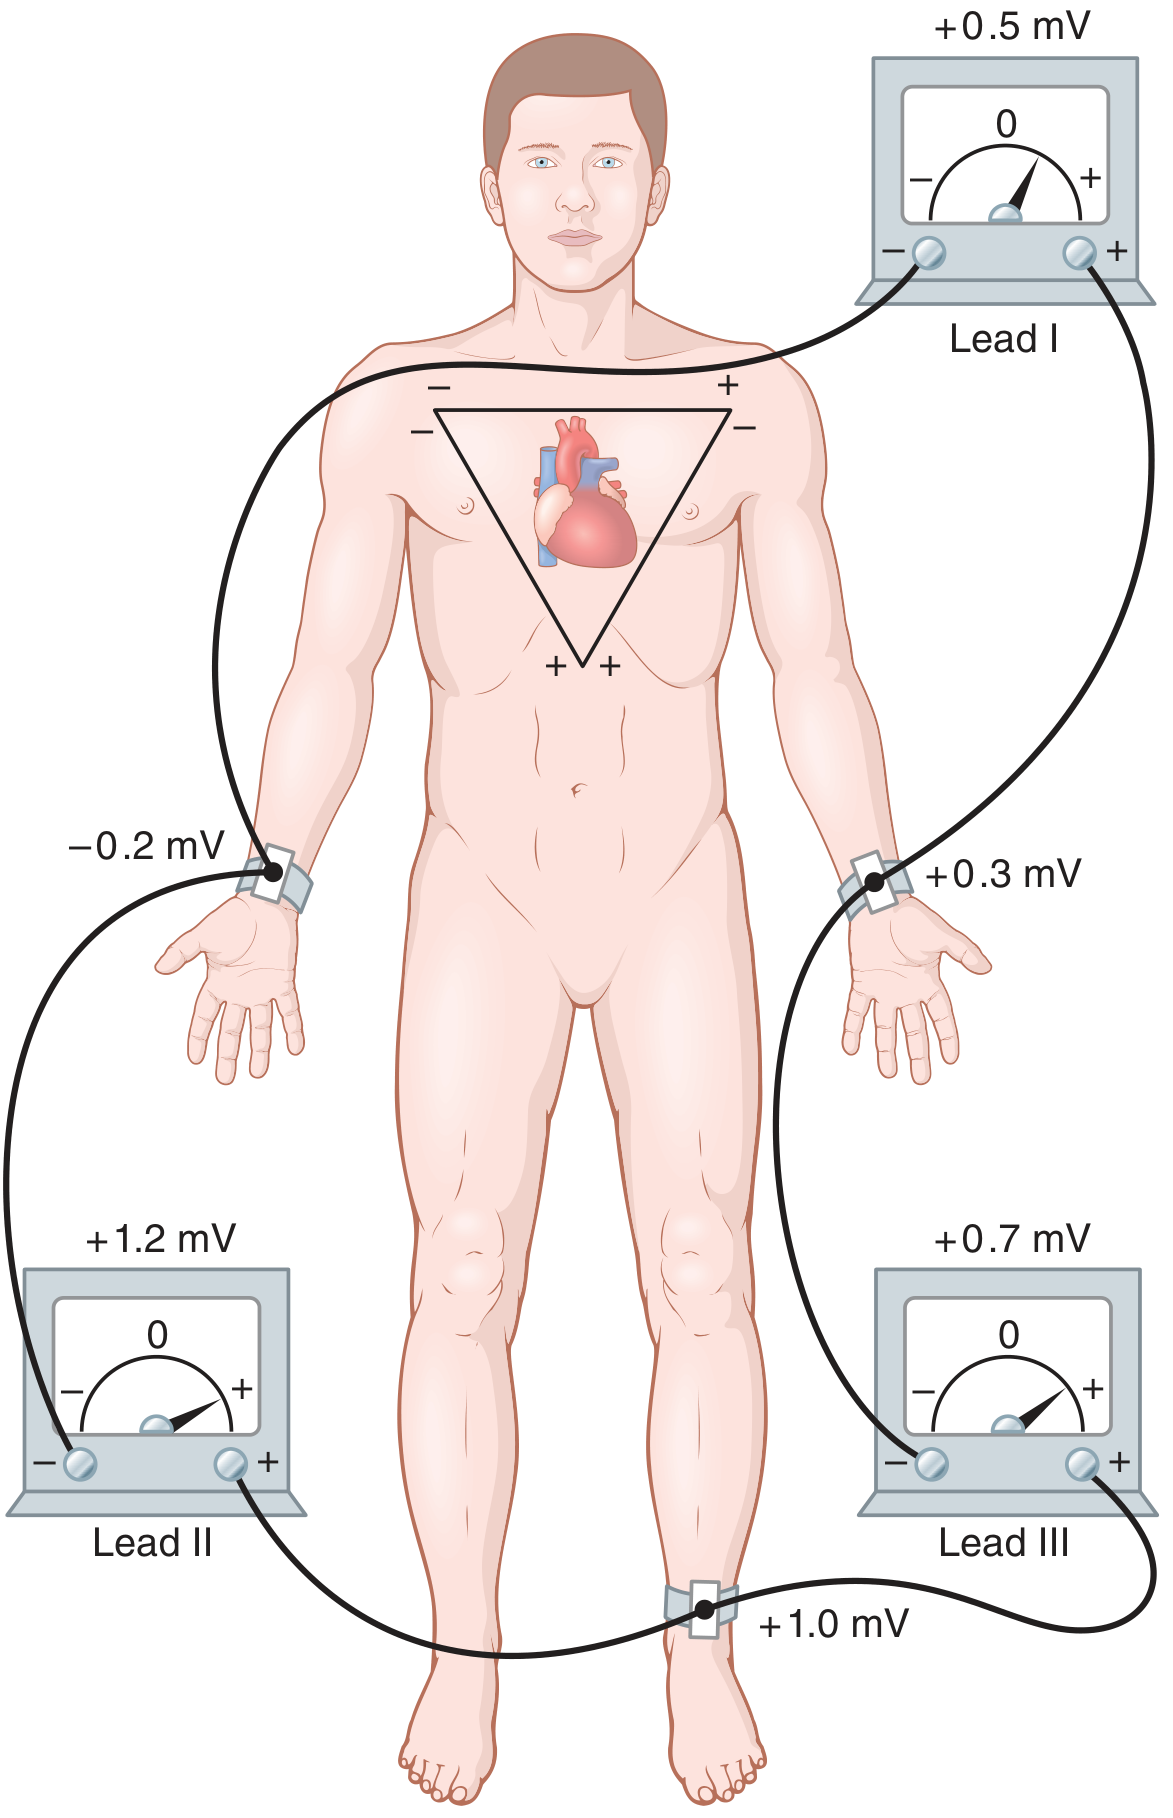
A. Bipolar Limb Leads (Einthoven's Leads)
Leads I, II, and III record the potential difference between two limb electrodes:
- Lead I: Right arm (-) to Left arm (+)
- Lead II: Right arm (-) to Left leg (+)
- Lead III: Left arm (-) to Left leg (+)
These three leads form Einthoven's Triangle with the heart at its center. Einthoven's Law states that at any instant: Lead I + Lead III = Lead II
B. Augmented Unipolar Limb Leads
Leads aVR, aVL, and aVF use one limb as the positive electrode and the other two as a combined negative (reference):
- aVR: Right arm (positive electrode)
- aVL: Left arm (positive electrode)
- aVF: Left foot (positive electrode)
These six frontal leads view the heart in the frontal (coronal) plane.
C. Precordial (Chest) Leads
Six unipolar leads (V1-V6) are placed on the chest wall and view the heart in the horizontal (transverse) plane:
| Lead | Placement |
|---|---|
| V1 | 4th intercostal space, right sternal border |
| V2 | 4th intercostal space, left sternal border |
| V3 | Between V2 and V4 |
| V4 | 5th intercostal space, midclavicular line |
| V5 | Anterior axillary line (same level as V4) |
| V6 | Midaxillary line (same level as V4 & V5) |
-
V1, V2: Mainly negative QRS (closest to heart base, which is electronegative during depolarization)
-
V4, V5, V6: Mainly positive QRS (closest to apex, which is electropositive during depolarization)
-
Guyton & Hall Textbook of Medical Physiology
ECG Lead Groupings and Territory
| Group | Leads | Cardiac Territory |
|---|---|---|
| Inferior | II, III, aVF | Inferior wall of LV (RCA territory) |
| Lateral | I, aVL, V5, V6 | Lateral wall of LV (LCx territory) |
| Anterior | V1, V2, V3, V4 | Anterior wall of LV (LAD territory) |
| Septal | V1, V2 | Interventricular septum |
Indications for ECG
Common clinical indications include:
- Chest pain - most frequent indication; evaluation for acute coronary syndrome (ACS)
- Dyspnea - assessment for pulmonary embolism, heart failure
- Syncope - detecting arrhythmias, heart block
- Palpitations - identifying tachyarrhythmias
- Preoperative assessment - especially in high-risk patients
- Drug toxicity monitoring (e.g., digoxin, antiarrhythmics)
- Electrolyte abnormalities (e.g., hyperkalemia causes peaked T waves, widened QRS, loss of P waves)
- Arrhythmia diagnosis - including atrial fibrillation, heart block
The ECG has a sensitivity of approximately 55% for acute MI (improving to 68% with serial ECGs). - Roberts and Hedges' Clinical Procedures in Emergency Medicine
Clinical Interpretation: Systematic Approach
A systematic approach to ECG reading:
- Rate - Calculate from R-R interval (normal: 60-100 bpm)
- Rhythm - Regular or irregular? Every QRS preceded by a P wave?
- Axis - Determined from frontal leads; normal axis: -30° to +90°
- P wave - Morphology, duration, axis
- PR interval - Prolonged (heart block) or short (pre-excitation)
- QRS complex - Width, morphology (bundle branch block if > 0.12 s)
- ST segment - Elevation (STEMI, pericarditis) or depression (ischemia)
- T wave - Inversion, peaked, flattened
- QT interval - Corrected QTc (prolonged QTc > 440 ms in men, > 460 ms in women)
Important ECG Patterns and Their Significance
| Finding | Clinical Significance |
|---|---|
| ST elevation | STEMI, acute pericarditis, Brugada syndrome |
| ST depression | Subendocardial ischemia, digitalis effect |
| Tall peaked T waves | Hyperkalemia |
| Diffuse ST elevation + PR depression | Acute pericarditis |
| Delta waves (short PR + wide QRS) | Wolff-Parkinson-White syndrome |
| Electrical alternans (alternating QRS amplitude) | Cardiac tamponade |
| Low voltage QRS (<5 mm in all limb leads) | Pericardial effusion, obesity, hypothyroidism |
Summary
Electrocardiography is a non-invasive, inexpensive, and indispensable tool in clinical medicine. It records the sum of electrical activity generated by all cardiac myocytes during depolarization and repolarization. The standard 12-lead ECG provides 12 different electrical "views" of the heart - six in the frontal plane and six in the horizontal plane. The waves (P, QRS, T), intervals (PR, QRS, QT), and segments (ST) each reflect distinct electrophysiological events. Systematic interpretation allows diagnosis of arrhythmias, conduction defects, ischemia, infarction, chamber hypertrophy, and metabolic disturbances.
Sources: Costanzo Physiology, 7th Ed.; Guyton & Hall Textbook of Medical Physiology; Roberts and Hedges' Clinical Procedures in Emergency Medicine; Medical Physiology (Boron & Boulpaep); Miller's Anesthesia, 10th Ed.
This is a shared conversation. Sign in to Orris to start your own chat.