
spinocerebellar ataxia
"spinocerebellar ataxia"[MeSH Terms]
spinocerebellar ataxia MRI cerebellum atrophy
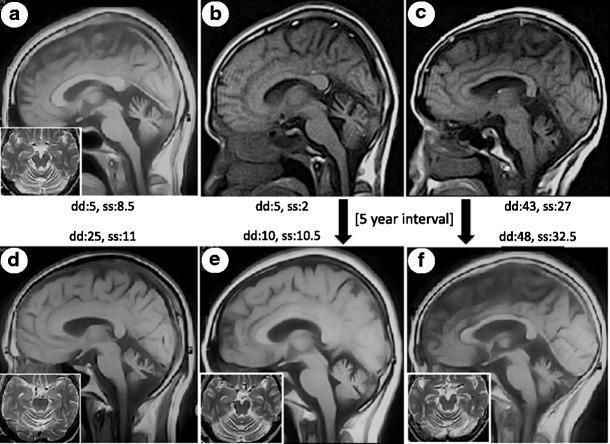
This diagnostic imaging panel presents a series of brain MRI scans illustrating progressive cerebellar atrophy in Spinocerebellar Ataxia Type 13 (SCA13). The primary images are T1-weighted midline sagittal sections (a-f), accompanied by T2-weighted axial insets (a, d, e, f). The sagittal views demonstrate varying degrees of cerebellar vermis shrinkage and enlargement of the pericerebellar CSF spaces. Notably, while the cerebellum shows marked volume loss particularly in long-duration cases (d and f), the brainstem and pons appear relatively preserved. The axial insets highlight widening of the cerebellar fissures and thinning of the folia, characteristic of global cerebellar atrophy. Serial scans for two patients (b to e; c to f) taken over a 5-year interval show subtle radiographic progression despite clinically significant increases in Scale for Assessment and Rating of Ataxia (SARA) scores. The images correlate disease duration (dd) and clinical severity (ss) with structural neuroanatomical changes, serving as an educational resource for identifying isolated cerebellar neurodegeneration.
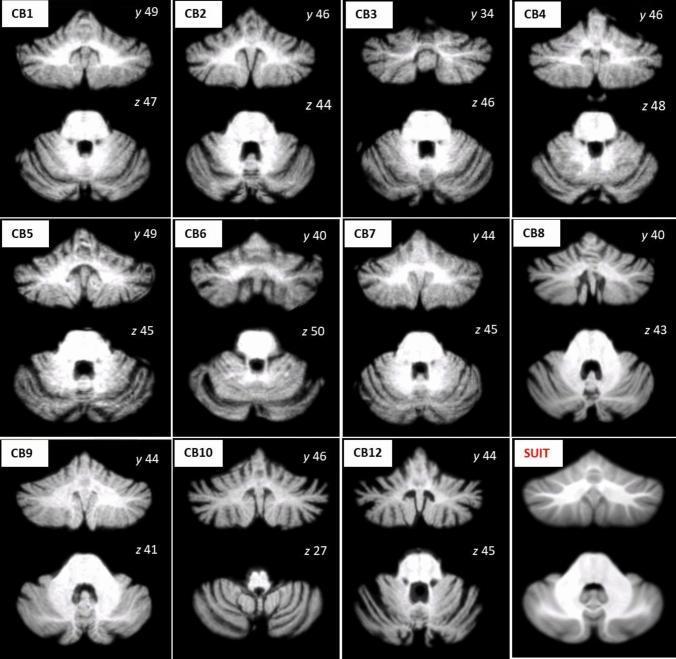
This diagnostic image set features T1-weighted MRI scans of the cerebellum and brainstem from eleven patients with Spinocerebellar Ataxia type 2 (SCA2), labeled CB1 through CB12 (excluding CB11). The scans are presented in representative axial (z-plane) and coronal (y-plane) sections, all normalized to the Spatially Unbiased Infratentorial Template (SUIT) shown in the bottom right for comparison. The educational focus is on the spectrum of cerebellar atrophy characteristic of SCA2. Morphological changes across the patient cohort include a significant reduction in cerebellar volume, narrowing of the cerebellar folia, and prominent widening of the cerebellar sulci and fissures compared to the healthy template. Specific variations are visible in the cerebellar vermis and hemispheres, ranging from mild volume loss to severe shrinkage (e.g., CB6 and CB10). These neuroimaging findings demonstrate the progressive neurodegenerative effects on the posterior fossa structures, which are essential for diagnosing and monitoring the clinical severity of autosomal dominant ataxias.
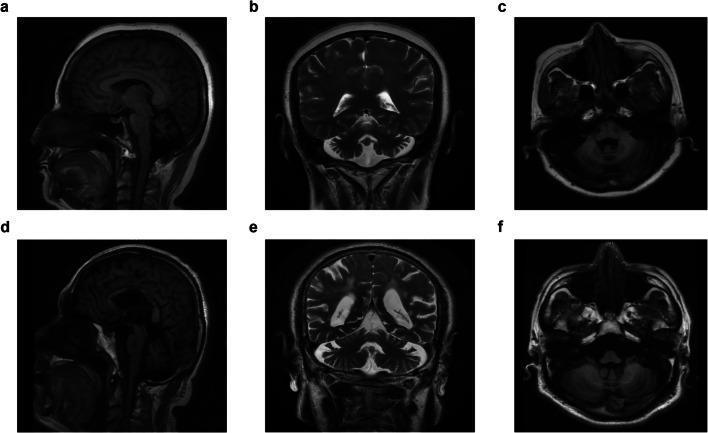
This diagnostic imaging panel presents a multi-planar MRI series of the brain for two separate individuals diagnosed with Spinocerebellar Ataxia Type 5 (SCA5). The top row (a–c) displays the proband, while the bottom row (d–f) displays a sporadic patient. The modalities include sagittal T1-weighted images (a, d), coronal T2-weighted images (b, e), and axial T1-weighted images (c, f). The primary clinical finding across both patients is moderate cerebellar atrophy. In the sagittal views, there is noticeable widening of the cerebellar fissures and a reduction in the volume of the cerebellar vermis. The coronal T2-weighted images highlight prominent cerebellar folia and enlarged CSF spaces surrounding the cerebellum, indicative of parenchymal loss. Despite the cerebellar changes, the supratentorial structures, including the cerebral cortex and ventricular system, appear largely preserved with normal ventricular size. This pattern is characteristic of pure cerebellar ataxia syndromes where atrophy is predominantly isolated to the infratentorial compartment, specifically the cerebellum and brainstem.
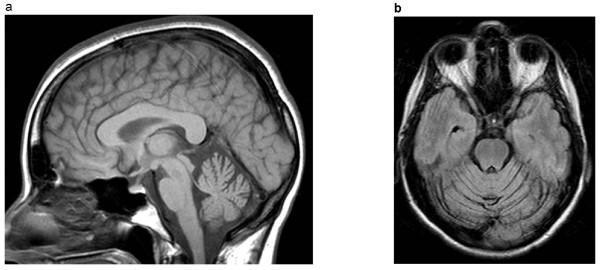
Diagnostic neuroimaging (MRI) of the brain in T1-weighted sequences, presenting a sagittal view (A) and an axial view (B). The images demonstrate significant olivopontocerebellar atrophy in a patient with Spinocerebellar Ataxia Type 2 (SCA2). In the sagittal view, there is marked volume loss of the cerebellum and the brainstem (specifically the pons and medulla), characterized by prominent cerebellar fissures and a diminished pontine belly. The axial view confirms these findings, showing disproportionate cerebellar atrophy relative to the cerebral hemispheres, with widening of the cerebellar sulci and thinning of the folia. These radiological features are consistent with the clinical presentation of progressive ataxia, dysarthria, and slowed saccadic eye movements. The images serve as an educational example of neurodegeneration in Autosomal Dominant Cerebellar Ataxia (ADCA), highlighting the anatomical distribution of tissue loss in the posterior fossa.
"spinocerebellar ataxia" AND treatment
Spinocerebellar Ataxia (SCA)
Overview
-
Collective prevalence: 1.0-5.6 per 100,000 - all are rare by US government definition
-
SCA3 (Machado-Joseph disease) is the most common SCA worldwide
-
Bradley and Daroff's Neurology in Clinical Practice
Genetic Classification and Mutations
| Mutation Type | SCAs Involved | Mechanism |
|---|---|---|
| CAG trinucleotide repeat (polyQ expansion) | SCA 1, 2, 3, 6, 7, 17; DRPLA | Toxic gain of function by mutant polyQ protein |
| CTG repeat (3'UTR of ATXN8OS) | SCA8 | Toxic untranslated RNA |
| Intronic pentanucleotide repeat | SCA10, SCA31, SCA37 | Toxic untranslated RNA |
| Hexanucleotide repeat expansion | SCA36 | Toxic RNA |
| Missense mutations | Most other SCAs | Toxic gain of function or dominant negative effect |
| Deletions | SCA15/16, SCA14 | Haploinsufficiency |
| Duplications | SCA20 | - |
| Translocation | SCA27 | Haploinsufficiency |
- Bradley and Daroff's Neurology in Clinical Practice
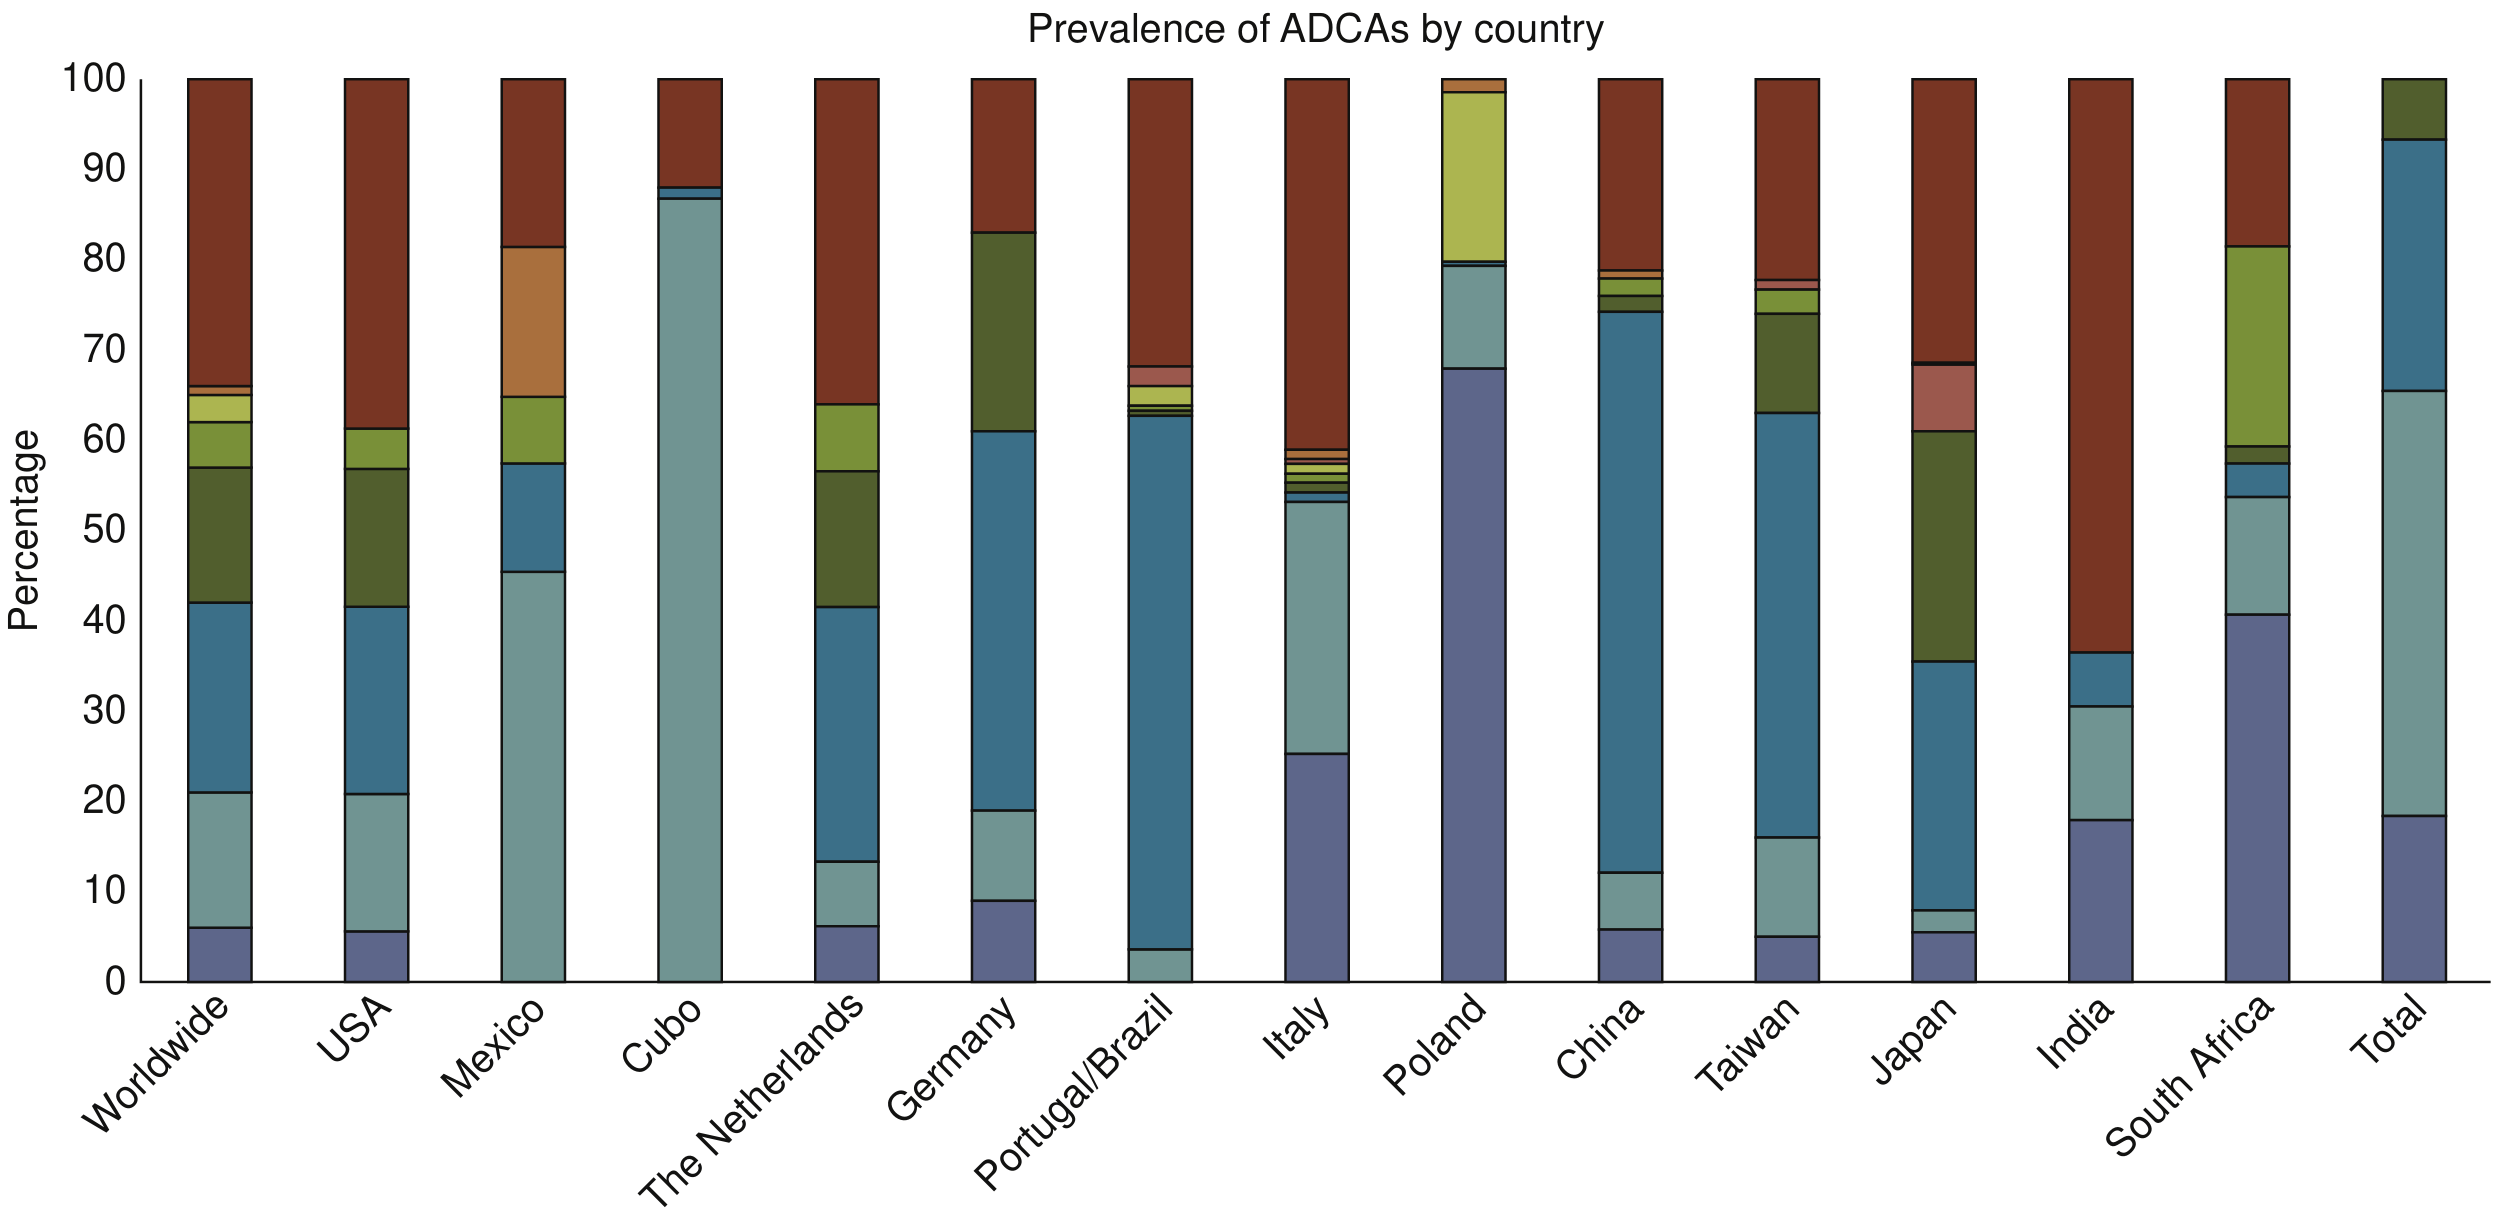
Regional and Ethnic Distribution
| Region | Predominant SCA |
|---|---|
| US & Europe | SCA1, 2, 3, 6, 7, 8 |
| Poland | SCA1 (high frequency, founder effect) |
| Cuba, Mexico, Italy | SCA2 |
| UK, Germany, Japan | SCA6 |
| South Africa, Mexico, Venezuela | SCA7 |
| Latin America | SCA10 |
| India, Italy | SCA12 |
Clinical Classification (Harding's ADCA Types)
- SCA2: slow saccades
- SCA3: dystonia
- SCA1, SCA17, and others
- SCA7 (the only known ADCA II)
- SCA6 (most typical)
Core Clinical Features
- Progressive gait ataxia and balance loss (typically the onset symptom)
- Limb dysmetria
- Dysarthria (scanning or explosive speech)
- Nystagmus and oculomotor abnormalities
| SCA Type | Distinctive Features |
|---|---|
| SCA1 | Pyramidal signs, peripheral neuropathy, ophthalmoplegia |
| SCA2 | Slow saccades (highly characteristic), hyporeflexia, parkinsonism (may be L-DOPA responsive); long ATXN2 alleles are an ALS risk factor |
| SCA3 (MJD) | Spasticity, cramps, fasciculations of face/tongue, protuberant eyes, external ophthalmoparesis, dystonia, rigidity; onset 3rd-7th decade |
| SCA6 | Pure cerebellar, late onset, very mild progression, no anticipation |
| SCA7 | Pigmentary retinal degeneration - progressive visual loss alongside ataxia |
| SCA10 | Seizures (especially in Latin American patients) |
| SCA17 | Dementia, psychiatric features, parkinsonism (resembles Huntington disease) |
- Bradley and Daroff's Neurology in Clinical Practice
Genetic Anticipation
- Explains de novo cases and juvenile-onset presentations
- SCA6 lacks anticipation (small, stable CAG repeats)
- SCA17 partially lacks anticipation (CAA interruptions within the expanded CAG)
Pathogenic Mechanisms
Neuroimaging
- Cerebellar atrophy - widening of cerebellar fissures, thinning of folia, reduced vermis volume
- Olivopontocerebellar atrophy - especially in SCA2, with marked volume loss of pons and medulla alongside cerebellum
- Cerebellar atrophy tends to be isolated (supratentorial structures relatively preserved) in "pure" cerebellar subtypes like SCA6

- Grainger & Allison's Diagnostic Radiology
Diagnosis
- Clinical evaluation - phenotype, family history, ethnic background, anticipation pattern
- Genetic testing - targeted repeat-expansion PCR for common SCAs (SCA1, 2, 3, 6, 7, 8, 10, 12, 17, etc.)
- MRI brain - cerebellar atrophy pattern
- Electrophysiology - nerve conduction studies for associated neuropathy
Management
- Tremor/ataxia: Acetazolamide (especially SCA6), 4-aminopyridine (reduces downbeat nystagmus and ataxia in SCA6)
- Spasticity: Baclofen, tizanidine
- Dystonia: Botulinum toxin, anticholinergics
- Parkinsonism (SCA2): L-DOPA may help in some cases
- Physiotherapy and balance training
- Speech therapy for dysarthria
- Occupational therapy
- Mobility aids, fall prevention
- RNA silencing (ASO/siRNA) - targeting toxic gain-of-function mutations (especially SCA1, 2, 3)
- Gene replacement therapy - for haploinsufficiency subtypes
- Small molecule chaperones and proteasome modulators
Key Points Summary
| Feature | Detail |
|---|---|
| Inheritance | Autosomal dominant (most common) |
| Pathogenesis | Polyglutamine toxicity (most), toxic RNA (some), haploinsufficiency (rare) |
| Most common worldwide | SCA3 (Machado-Joseph Disease) |
| Hallmark of polyQ SCAs | Genetic anticipation |
| Only ADCA II | SCA7 (retinal degeneration) |
| Distinguishing feature SCA2 | Slow saccades |
| Distinguishing feature SCA6 | Pure cerebellar, no anticipation, acetazolamide-responsive |
| Treatment | No disease-modifying therapy; symptomatic only |
| Imaging | Cerebellar (± brainstem) atrophy on MRI |