
MRI brain
What would you like to know about MRI brain?
MRI brain sequences T1 T2 FLAIR comparison
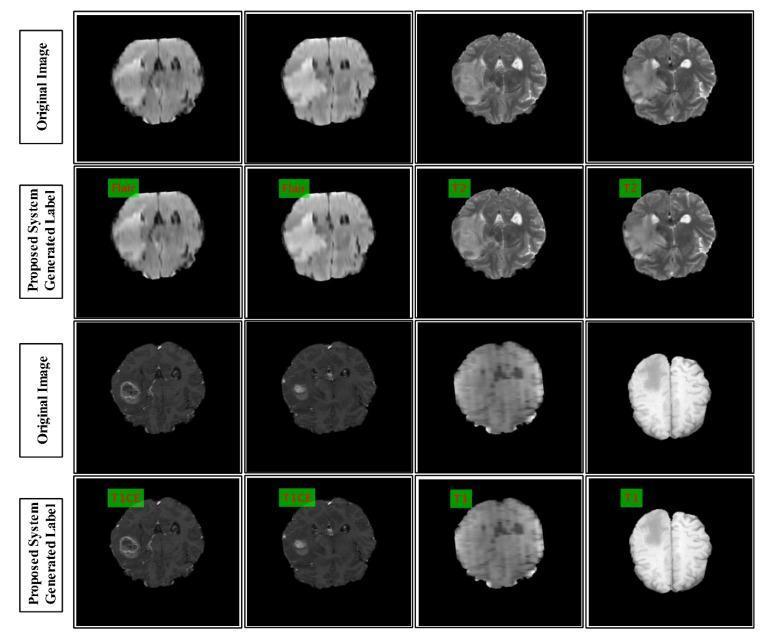
A comparison grid of diagnostic images displaying axial brain scans from Magnetic Resonance Imaging (MRI) datasets, specifically focusing on multimodal tumor classification. The image is organized into four rows alternating between 'Original Image' and 'Proposed System Generated Label.' The scans illustrate different MRI modalities including FLAIR, T2-weighted, T1-contrast enhanced (T1CE), and T1-weighted sequences. Visible pathology includes hyperintense lesions and edema in the FLAIR and T2 scans, indicating potential gliomas, and ring-enhancing or solid lesions in the T1CE slices. The 'Proposed System Generated Label' rows demonstrate the output of an automated classification algorithm, where specific sequences are identified by red text labels ('Flair', 'T2', 'T1CE', 'T1') overlaid on small green rectangular boxes in the upper left corner of each frame. The display highlights the visual similarities between modalities like FLAIR and T2, as well as the low-contrast challenges inherent in T1 sequences, emphasizing the system's role in automated pattern recognition for neuro-oncology.
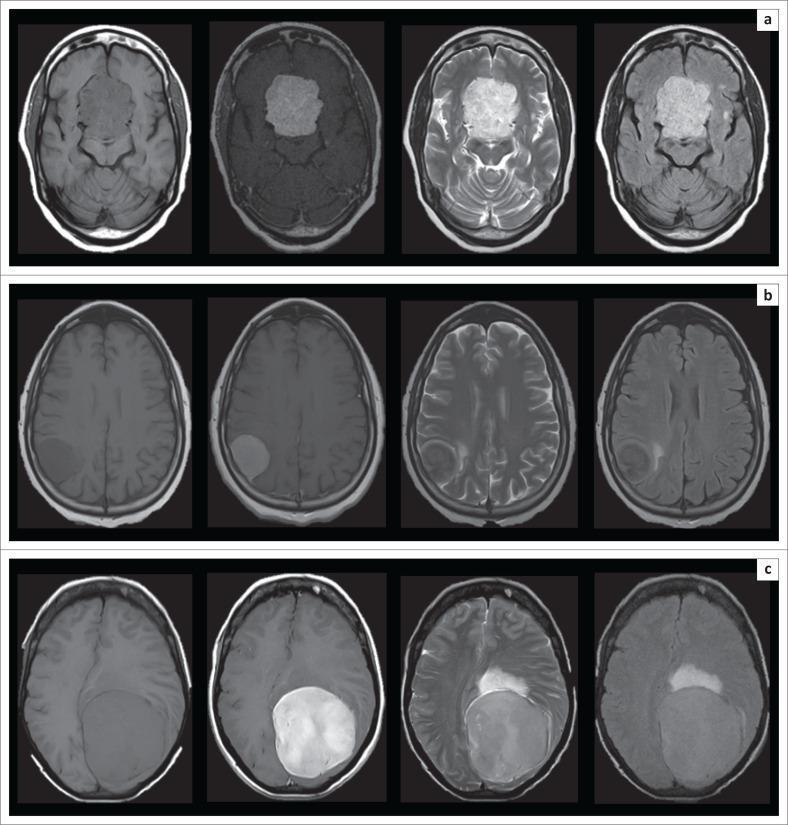
This diagnostic image set consists of three rows (a, b, c) of axial brain MRI sequences comparing WHO Grade I meningioma subtypes: meningothelial, transitional, and fibroblastic. Each row displays four standard sequences from left to right: T1-weighted imaging (T1-WI), T1-WI post-gadolinium, T2-weighted imaging (T2-WI), and Fluid Attenuation Inversion Recovery (FLAIR).
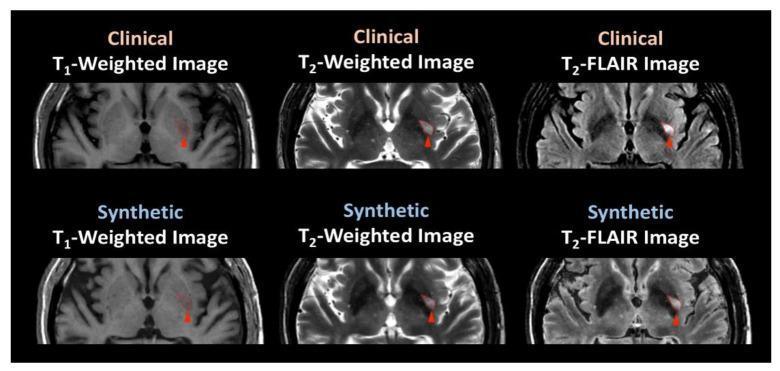
A comparison chart of axial brain Magnetic Resonance Imaging (MRI) scans from a 64-year-old male patient with an ischemic stroke. The image displays a 2x3 grid comparing clinical MRI acquisitions (top row) with synthetically generated counterparts (bottom row). Three distinct pulse sequences are shown: T1-weighted, T2-weighted, and T2-FLAIR. An acute/subacute stroke lesion is identified in the right basal ganglia/thalamic region, marked by red arrowheads across all views. In both clinical and synthetic T1-weighted images, the lesion appears hypointense relative to the surrounding brain parenchyma. In the T2-weighted and T2-FLAIR sequences, the lesion exhibits a clear hyperintense signal. The synthetic images demonstrate high fidelity in replicating the contrast, lesion morphology, and anatomical detail of the clinical scans, including the suppression of cerebrospinal fluid signal in the FLAIR images. This diagnostic comparison highlights the utility of synthetic MRI in identifying cerebrovascular pathology and its clinical equivalence to standard imaging modalities in neuro-radiology.
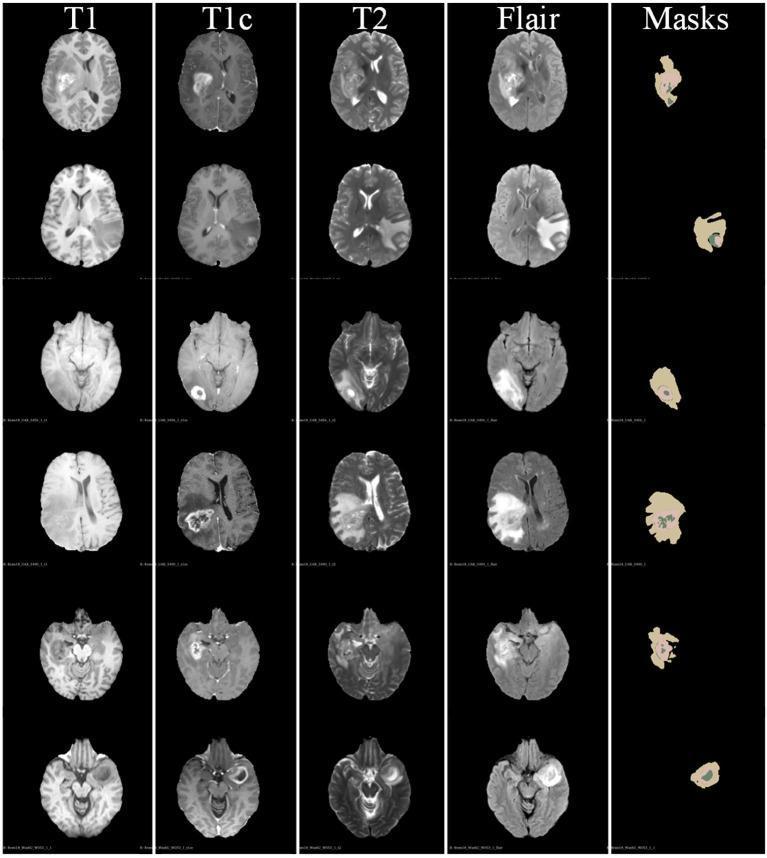
A multi-modal comparison chart displaying axial brain MRI slices from the BraTS 2018 dataset, focused on neuro-oncological diagnostic imaging. The image is organized into a grid with six rows of distinct axial slices and five columns representing different MRI sequences and segmentation masks. The sequences include T1-weighted (T1), contrast-enhanced T1 (T1c), T2-weighted (T2), and Fluid Attenuated Inversion Recovery (FLAIR). The final column, 'Masks', displays color-coded segmentation results. The visual demonstrates the varying presentation of brain tumors: T1 shows hypointense regions; T1c highlights enhancing tumor cores; T2 and FLAIR exhibit hyperintense signals that delineate peritumoral edema and the whole tumor (WT) extent. The segmentation masks demonstrate the automated classification of tumor sub-regions, including the enhancing tumor, tumor core (TC), and edema. This comparison illustrates how different modalities contribute to identifying tumor margins and internal morphology for clinical diagnosis and radiotherapy planning in neuroradiology.
Localizer T1axl T2 axl DWI axi Flair axi GRE Sag t1 Cot t2 Adc
MRI brain protocol sequences localizer scout axial
DWI ADC map brain stroke restricted diffusion
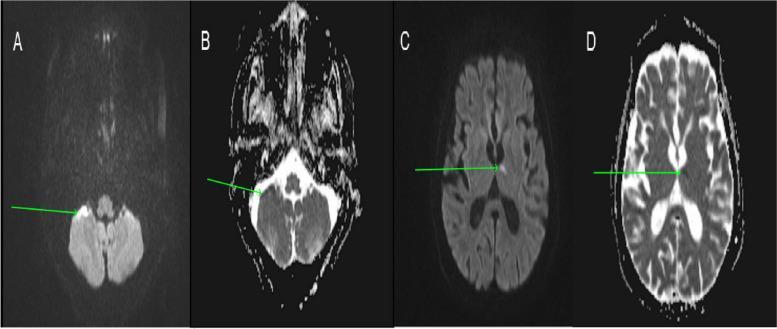
This diagnostic image displays four axial sections of a brain MRI, comparing Diffusion-Weighted Imaging (DWI) and Apparent Diffusion Coefficient (ADC) maps to demonstrate multifocal restricted diffusion. Sections A (DWI) and B (ADC) focus on the posterior fossa, where a hyperintense signal on DWI in the right cerebellar hemisphere corresponds to a hypointense signal on the ADC map (green arrows), indicative of acute cytotoxic edema. Sections C (DWI) and D (ADC) show higher axial levels, highlighting a focal area of increased signal intensity in the left thalamus on DWI with a corresponding signal drop on the ADC map (green arrows). These findings are characteristic of multi-territorial acute ischemic infarcts. The comparison effectively illustrates the inverse relationship between DWI and ADC sequences, a critical concept in neuroradiology for identifying acute stroke and distinguishing restricted diffusion from T2 shine-through.
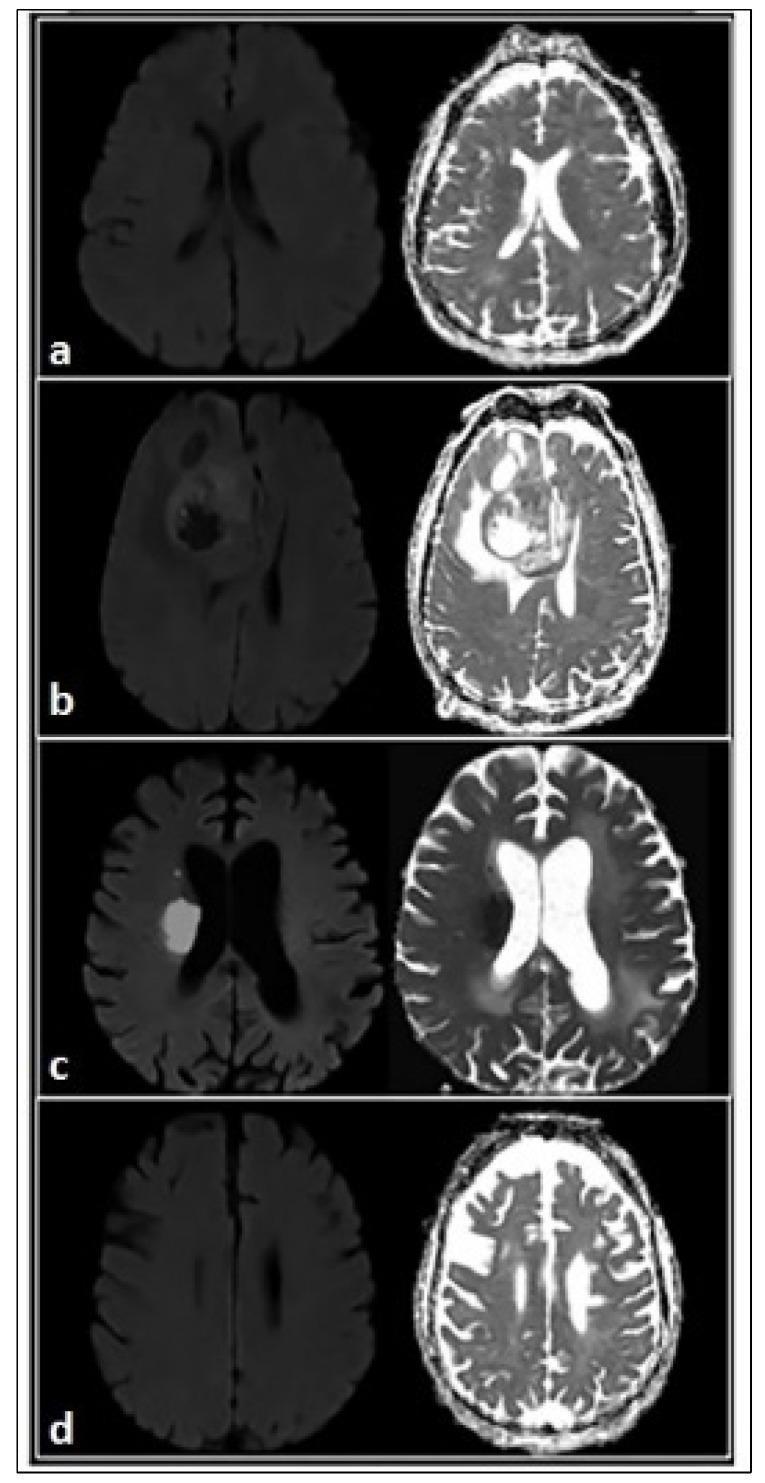
A comparison chart of axial brain Magnetic Resonance Imaging (MRI) demonstrating various pathologies using Diffusion-Weighted Imaging (DWI) on the left and corresponding Apparent Diffusion Coefficient (ADC) maps on the right. Row 'a' illustrates demyelination with increased ADC (bright signal on ADC map). Row 'b' displays an intracranial tumor showing restricted diffusion characterized by high DWI signal and low (dark) ADC signal, indicative of high cellular density. Row 'c' shows acute brain ischemia with cytotoxic edema, characterized by restricted diffusion (bright DWI, dark ADC) in a vascular distribution. Row 'd' represents gliosis or axonal loss, which presents as an increase in extracellular space resulting in elevated ADC values. This diagnostic visual facilitates the differentiation between cytotoxic edema (restricted diffusion) and vasogenic edema or tissue loss (increased diffusion), essential for neuroradiology education and clinical stroke or oncology assessment.
Standard Brain MRI Protocol - Sequence by Sequence
1. Localizer (Scout)
- What it is: A very fast, low-resolution 3-plane image (axial + sagittal + coronal) taken at the very start
- Purpose: To plan/prescribe all subsequent sequences - sets the angulation and coverage for every other sequence
- Time: ~10-20 seconds
- No diagnostic value on its own; purely for positioning
2. T1 Axial
- Principle: Short TR, short TE. Reflects T1 relaxation (longitudinal/spin-lattice recovery)
- Appearance:
- White matter = bright (white)
- Gray matter = gray
- CSF = dark (black)
- Fat = bright
- Best for: Anatomy, subacute hemorrhage (metHb = bright), gadolinium enhancement (post-contrast T1 shows enhancing lesions as bright), melanin, proteinaceous fluid
- Rule of thumb: Looks like a real anatomical brain slice
3. T2 Axial
- Principle: Long TR, long TE. Reflects T2 relaxation (transverse/spin-spin decay)
- Appearance:
- White matter = dark gray
- Gray matter = light gray
- CSF = bright (white)
- Edema/pathology = bright
- Best for: Detecting pathology - edema, tumors, demyelination, infarcts, gliosis. Most pathological processes increase tissue water and appear T2 bright
- Rule of thumb: Looks like a photographic negative of T1
4. DWI Axial (Diffusion-Weighted Imaging)
- Principle: Uses paired SE gradient pulses to detect Brownian motion of water molecules
- Appearance of restricted diffusion: Bright on DWI (water cannot move freely, e.g., dead/swollen cells)
- Classic uses:
- Acute ischemic stroke - bright within minutes of onset (most important clinical use)
- Cerebral abscess - bright core (pus restricts diffusion)
- High-grade tumors (lymphoma, GBM)
- Active demyelination
- Pitfall: "T2 shine-through" - a T2-bright lesion can appear bright on DWI even without true restriction → must confirm with ADC
5. FLAIR Axial (Fluid-Attenuated Inversion Recovery)
- Principle: An inversion recovery sequence that nulls CSF signal using a specific inversion time (~2000 ms)
- Appearance:
- CSF = dark (suppressed)
- Pathological lesions near CSF = remain bright and stand out clearly
- Best for:
- Periventricular MS plaques (would be hidden in T2 by adjacent bright CSF)
- Cortical/juxtacortical lesions
- Subarachnoid hemorrhage (SAH) - CSF appears bright instead of dark
- Leptomeningeal disease
- Establishing chronicity of infarcts (FLAIR positivity after ~6 hours)
- Meningitis (sulcal FLAIR hyperintensity)
6. GRE (Gradient Echo) / T2* Axial
- Principle: Uses a gradient instead of a 180° refocusing pulse. Highly sensitive to magnetic susceptibility differences (T2* effects)
- Appearance: Paramagnetic substances cause "blooming artifact" - a dark signal larger than the actual lesion
- Best for detecting:
- Microbleeds and hemorrhage (hemosiderin, deoxyhemoglobin appear very dark)
- Calcifications
- Cavernous malformations
- Diffuse axonal injury (DAI) in trauma
- ARIA-H (microbleeds from amyloid-related imaging abnormalities)
- Modern upgrade: SWI (Susceptibility-Weighted Imaging) is a 3D version even more sensitive than GRE
"GRE or, ideally, SWI should be part of every MRI protocol for brain trauma" - Bradley and Daroff's Neurology in Clinical Practice
7. Sagittal T1
- Why sagittal? The midline sagittal plane is perfect for evaluating:
- Corpus callosum (MS lesions here called "Dawson's fingers")
- Cerebellum and brainstem - tonsillar herniation, Chiari malformation
- Pituitary gland and sella turcica
- Midline shift
- Ventricular system morphology
- Same T1 contrast as above but in the sagittal plane
8. Coronal T2 ("Cor T2")
- Why coronal?
- Hippocampal evaluation - best plane for mesial temporal sclerosis (epilepsy workup)
- Temporal lobes in detail
- Posterior fossa lesions
- Pituitary and parasellar region
- Falcine/tentorial subdural hematomas
- T2 contrast: CSF bright, pathology bright
9. ADC Map (Apparent Diffusion Coefficient)
- Derived from DWI - calculated by acquiring two b-values (b=0 and b=1000)
- Quantitative map of how freely water diffuses in each voxel
- Inverse relationship with DWI:
| Finding | DWI | ADC |
|---|---|---|
| True restricted diffusion (acute infarct, abscess) | Bright ↑ | Dark ↓ |
| T2 shine-through (chronic gliosis) | Bright | Bright ↑ (not restricted) |
| Vasogenic edema / demyelination | Variable | Bright ↑ |
- Rule: Bright DWI + Dark ADC = TRUE restriction = acute pathology
- Formula: ADC = -ln(S/S₀) / b, where S = signal at high b-value, S₀ = signal at b=0
Quick Summary Table
| Sequence | Plane | Key Use | CSF Signal |
|---|---|---|---|
| Localizer | 3-plane | Positioning only | - |
| T1 Axial | Axial | Anatomy, post-contrast, subacute bleed | Dark |
| T2 Axial | Axial | Pathology detection (edema, demyelination) | Bright |
| DWI Axial | Axial | Acute stroke, abscess | Variable |
| FLAIR Axial | Axial | Periventricular lesions, SAH, meningitis | Suppressed (dark) |
| GRE Axial | Axial | Hemorrhage, microbleeds, calcification | Dark |
| T1 Sagittal | Sagittal | Corpus callosum, brainstem, pituitary | Dark |
| T2 Coronal | Coronal | Hippocampus, temporal lobes | Bright |
| ADC Map | Axial | Confirm true restriction (DWI complement) | Bright |
MRI brain
What aspect of MRI brain would you like to cover?
Aoi
What did you mean by 'Aoi'?
MRI brain area of interest FOV positioning scout localizer planning
MRI Brain - Area of Interest (AOI) / Positioning & Planning
What is AOI?
- All relevant anatomy is covered
- Slices are correctly angulated
- No important structures are cut off
Brain MRI - Standard AOI Coverage
Overall Coverage (All Sequences)
- Superior border: Top of the skull / vertex (include the whole calvarium)
- Inferior border: Foramen magnum / base of skull - must include the posterior fossa and cerebellum
- This ensures coverage of the entire brain from vertex to foramen magnum
Axial Sequences (T1, T2, DWI, FLAIR, GRE, ADC)
Positioning on Sagittal Localizer:
| Parameter | Setting |
|---|---|
| Angulation | Parallel to the AC-PC line (Anterior Commissure - Posterior Commissure line) |
| Superior extent | Vertex of skull |
| Inferior extent | Foramen magnum / base of skull |
| FOV | 22-24 cm (covers entire cranium) |
| Slice thickness | 5 mm (standard) / 3 mm (high-res) |
| Gap | 1-1.5 mm (or no gap for 3D sequences) |
AC-PC Line - Why It Matters:
- The AC-PC line is the international standard reference for brain slice angulation
- Anterior Commissure (AC) = white matter bundle at the base of the septum pellucidum
- Posterior Commissure (PC) = small bundle above the cerebral aqueduct
- Aligning slices to this line ensures reproducibility and comparability across scans
- Easily identified on the midsagittal localizer image
Sagittal T1 - AOI Planning
Positioning on Axial or Coronal Localizer:
| Parameter | Setting |
|---|---|
| Angulation | True midline, parallel to the falx cerebri / interhemispheric fissure |
| Coverage | From right to left temporal lobe (include both hemispheres) |
| FOV | 22-24 cm |
| Slice thickness | 5 mm |
| Key structures to include | Corpus callosum, brainstem, cerebellum, pituitary, 4th ventricle |
Coronal T2 - AOI Planning
Positioning on Sagittal Localizer:
| Parameter | Setting |
|---|---|
| Angulation | Perpendicular to the long axis of the hippocampus (for epilepsy) OR perpendicular to the brainstem |
| Coverage | From frontal lobe to occipital lobe |
| FOV | 20-22 cm |
| Slice thickness | 3-5 mm |
| Key structures to include | Hippocampi, temporal lobes, ventricles, basal ganglia |
Landmark for Patient Positioning in the Bore
| Landmark | Position |
|---|---|
| Isocenter | Nasion (bridge of the nose) OR outer canthus of eye |
| Head coil | Head and neck coil, patient supine |
| Patient position | Supine, head first, arms by sides |
| Alignment light | Centered to nasion/glabella |
The isocenter should be placed at the center of the brain - approximately at the level of the nasion when the patient is in the head coil. This ensures the brain sits at the optimal part of the magnetic field (most homogeneous).
FOV (Field of View) Considerations
| Factor | Brain Standard |
|---|---|
| FOV size | 220-240 mm |
| Matrix | 256 × 256 (minimum) |
| Phase direction | Anterior-Posterior (A-P) to move wrap artifact away from brain |
| Frequency direction | Right-Left |
| Saturation bands | Superior sat band to reduce pulsation artifacts from eyes/vessels |
Common AOI Errors to Avoid
| Error | Consequence |
|---|---|
| Not including posterior fossa inferiorly | Miss cerebellum, brainstem lesions |
| Slices not parallel to AC-PC | Poor reproducibility, poor anatomy display |
| FOV too small | Wrap/aliasing artifact from scalp |
| Phase direction wrong | Motion artifact from orbits overlaps brain |
| Coronal not perpendicular to hippocampus | Inaccurate hippocampal volume assessment |
Visual Summary - Slice Angulation
SAGITTAL view:
                    [VERTEX]
                       |
     ==================|==================  ← Axial slices
     AC -------- PC line (parallel)
     ==================|==================
                       |
                [FORAMEN MAGNUM]

AXIAL view:
     Left ←——— Falx cerebri ———→ Right
     (Sagittal slices parallel to falx)