
Copd with pink buffer treatment
pink puffer COPD emphysema patient
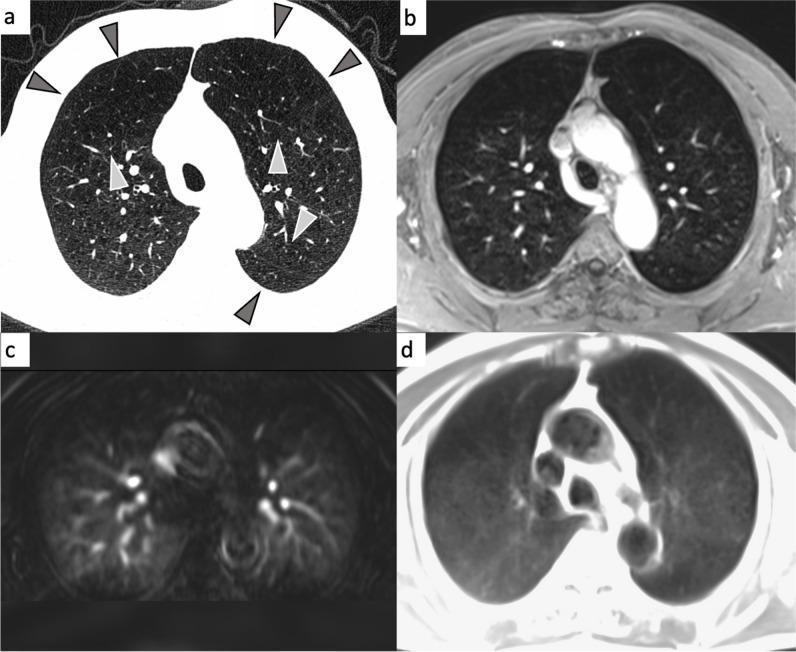
This multi-panel figure presents a comparison of diagnostic imaging modalities—CT and MRI—for evaluating emphysema-predominant Chronic Obstructive Pulmonary Disease (COPD) in a 69-year-old patient. Panel (a) shows a transverse CT scan displaying severe emphysema, characterized by multiple low-attenuation areas (arrowheads) indicating tissue destruction and hyperinflation in both anterior upper lobes and the left lower lobe tip. Panel (b) is a contrast-enhanced transverse 3D T1-weighted gradient echo MRI, where emphysematous regions appear as parenchymal defects with decreased signal intensity. Panel (c) provides a dynamic contrast-enhanced (DCE) perfusion MRI, illustrating perfusion deficits in the affected lobes due to vascular pruning and reduced blood flow. Panel (d) shows a transverse half-Fourier fast spin echo MRI, where diseased areas manifest as signal voids (dark regions). The images collectively demonstrate how emphysema affects lung structure, perfusion, and signal characteristics across radiological modalities, used for phenotyping COPD in clinical research.
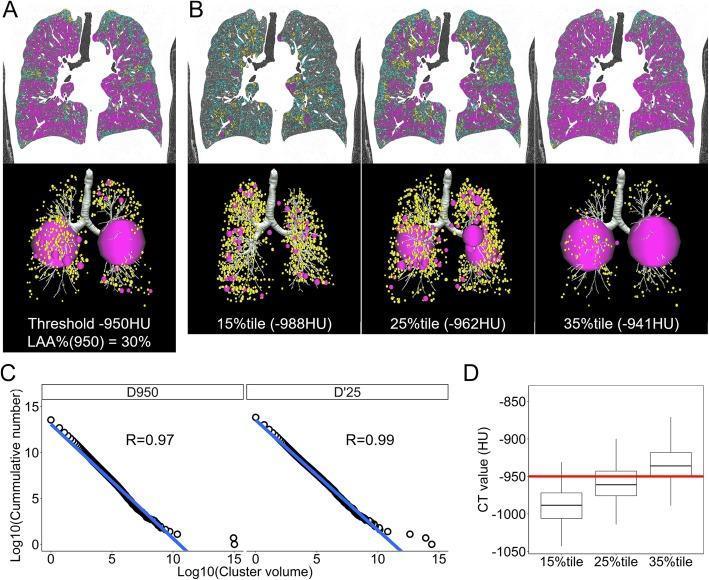
This composite educational image illustrates quantitative CT analysis of emphysematous lung destruction using low attenuation area (LAA) cluster modeling. Panel A shows a coronal CT section and corresponding 3D sphere model based on a fixed threshold of -950 Hounsfield Units (HU), highlighting localized large clusters (pink spheres, >500 mm³). Panel B presents a comparison of percentile-based thresholds (15th, 25th, and 35th percentiles), demonstrating how different density cut-offs capture varying distributions of moderate (yellow spheres, 50-499 mm³) and small LAA clusters throughout the pulmonary parenchyma. Panel C contains log-log plots showing the linear relationship between LAA cluster volume and cumulative frequency, used to derive the fractal dimension (D), a measure of structural complexity in COPD. High correlation coefficients (R=0.97-0.99) indicate a strong power-law distribution. Panel D is a box plot showing the distribution of CT values corresponding to the 15th, 25th, and 35th percentiles across a study cohort, with a reference line at -950 HU. This material is designed for advanced medical imaging and pulmonology education regarding automated quantification of emphysema progression.
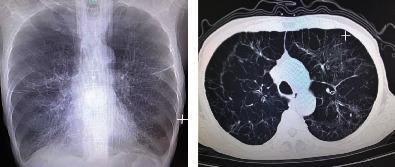
This dual-panel image displays diagnostic thoracic imaging from a patient with Chronic Obstructive Pulmonary Disease (COPD). The left panel is a posterior-anterior (PA) chest X-ray showing classic features of severe emphysema, including hyperinflated lung fields, sparse bronchovascular markings, and a widened chest diameter consistent with a barrel chest deformity. Diaphragmatic flattening and a narrowed mediastinal silhouette are also visible. The right panel is an axial CT scan of the chest (lung window) at the level of the upper lobes, revealing extensive bullous emphysema. Multiple large, thin-walled bullae are visible, particularly in the subpleural regions, along with architectural distortion of the lung parenchyma. These findings demonstrate advanced obstructive lung disease and are clinically significant for explaining symptoms of chronic shortness of breath and impaired gas exchange in elderly patients with a significant smoking history.
COPD - "Pink Puffer" (Emphysema Phenotype): Overview and Treatment
What is the "Pink Puffer"?
| Feature | Pink Puffer (Emphysema) | Blue Bloater (Chronic Bronchitis) |
|---|---|---|
| Dominant pathology | Parenchymal destruction | Airway disease, mucus hypersecretion |
| Colour | Pink (maintains oxygenation by hyperventilating) | Cyanotic (blue) |
| Build | Thin, cachectic | Overweight, oedematous |
| Breathing | Pursed-lip breathing, accessory muscle use | Productive cough, wheezing |
| ABG | Near-normal PaO2, ↓ PaCO2 (compensates) | Hypoxaemia + hypercapnia |
| PFTs | ↓ FEV1/FVC, ↑ TLC, ↑ RV, ↓ DLCO | ↓ FEV1/FVC, normal/↑ TLC, normal DLCO |
| Cor pulmonale | Late | Early |
- Barrel chest (hyperinflation increases AP diameter)
- Pursed-lip breathing
- Use of accessory respiratory muscles
- Hyperresonant percussion
- Decreased breath sounds
- Prolonged forced exhalation (>6 seconds)
- Muffled heart sounds
- No clubbing (clubbing should prompt investigation for lung cancer)
- Signs of cor pulmonale appear late
Investigations
| Test | Finding in Pink Puffer |
|---|---|
| Spirometry | ↓ FEV1/FVC (<0.70 post-bronchodilator); ↓ FEV1 |
| Lung volumes | ↑ TLC, ↑ RV (air trapping), ↑ FRC |
| DLCO | Reduced (parenchymal destruction) |
| ABG | Near-normal PaO2, ± low PaCO2 |
| CXR/CT | Hyperinflation, flattened diaphragm, hyperlucency, bullae, diminished vascular markings |
| Bloods | Polycythemia (if chronic hypoxaemia), ↑ bicarbonate (chronic CO2 retention) |
| Alpha-1 antitrypsin | Screen all COPD patients at least once |
Treatment
1. Reduce Exposure to Noxious Agents
- Smoking cessation - single most important intervention
- Avoid biomass fuels, occupational dust/fumes
- Improve indoor ventilation
2. Maximise Lung Function - Inhaled Pharmacotherapy
| GOLD Group | Characteristics | Initial Inhaled Therapy |
|---|---|---|
| A | 0-1 exacerbations, minimal symptoms | Any bronchodilator (SABA or SAMA) |
| B | 0-1 exacerbations, significant symptoms | LABA or LAMA |
| C | ≥2 exacerbations/≥1 hospitalization, minimal symptoms | LAMA |
| D | ≥2 exacerbations/≥1 hospitalization, significant symptoms | LAMA; if CAT >20 add LABA; if eosinophils >300 consider ICS+LABA |
- LAMAs (e.g., tiotropium, umeclidinium) and LABAs (e.g., salmeterol, formoterol, indacaterol) - reduce exacerbations and improve quality of life but do NOT slow FEV1 decline or improve survival
- SABAs/SAMAs (salbutamol, ipratropium) - for rescue
- NOT recommended as monotherapy in COPD
- Add ICS to LAMA/LABA if: continued frequent exacerbations, eosinophils >300 cells/µL, or history of asthma
- Consider ICS withdrawal if: <2 exacerbations/year, no hospitalizations, eosinophils <300 cells/µL
3. Supplemental Oxygen
- PaO2 ≤55 mmHg or SpO2 ≤88% at rest
- PaO2 56-59 mmHg or SpO2 <89% if cor pulmonale, right heart failure, or erythrocytosis (hematocrit >55%)
- Note: oxygen therapy does NOT improve mortality in patients with moderate resting desaturation (SpO2 89-93%) or only exercise-induced desaturation
4. Pulmonary Rehabilitation
- Refer ALL patients at diagnosis, after hospitalisation for exacerbation, and before lung volume reduction surgery (LVRS) or transplant
- Aerobic training at 60-80% maximal exercise capacity
- Upper extremity strength training
- Significantly improves dyspnea, exercise tolerance, and quality of life
5. Surgical Options (selected patients)
- Lung Volume Reduction Surgery (LVRS): removes 20-30% of hyperinflated lung; beneficial in upper-lobe predominant emphysema with low exercise capacity
- Bronchoscopic lung volume reduction (endobronchial valves or coils): less invasive alternative in suitable patients
- Lung transplantation: improves quality of life; median survival ~6 years post-transplant
6. Non-invasive Positive Pressure Ventilation (NIPPV)
- Nocturnal NIPPV indicated when resting PaCO2 ≥52 mmHg; improves dyspnea, exercise capacity, and time to hospital readmission
7. Nutritional Support
- Malnutrition (low BMI) is associated with increased mortality
- Small, frequent meals recommended (large meals worsen dyspnea by splinting the diaphragm)
- Nutritional supplementation can improve BMI, exercise tolerance, and quality of life in advanced disease
8. Vaccinations and Exacerbation Prevention
- Annual influenza vaccine
- Pneumococcal vaccine
- COVID-19 vaccination
Pink Puffer vs Blue Bloater - Why It Matters Clinically
- They are relatively protected from cor pulmonale early in the disease
- They are at risk of respiratory muscle fatigue and cachexia
- Oxygen therapy must be used carefully: unlike the blue bloater who may lose hypoxic drive with supplemental O2, the pink puffer generally tolerates supplemental O2 better, but target SpO2 of 88-92% is still recommended to avoid suppressing ventilatory drive